Volume 139, No. 5, May 7, 2012. Pages 371–388.
We have recently discovered that the current data acquisition software for analytical ultracentrifuges, ProteomeLab XL-A/XL-I Graphical User Interface version 6.0 by Beckman Coulter, deployed worldwide by the manufacturer since early 2011, introduces timestamp discrepancies into the scan data files (Rhyner, 2013; Zhao et al., 2013). As described in detail elsewhere (Zhao et al., 2013), the scan files contain entries for elapsed times that underreport the experimental times by 10% at rotor speeds of 50,000 rpm. Although reported scan times are irrelevant for the interpretation of sedimentation equilibrium (SE) experiments, in sedimentation velocity (SV), these discrepancies lead to overestimates of the derived sedimentation coefficients by 10%. We have shown that a corrective time dilation factor can be retrieved from the scan file timestamps of the Windows operating system, as implemented in current versions of the SEDFIT software.
A subset of the conventional SV data on GluA2 and enhanced green fluorescent protein (EGFP) in some of the studies we originally reported was collected with Beckman Coulter acquisition software version 6.0. Therefore, we have reanalyzed these data with accurate timestamps, leading to the following corrections:
(1) For the EGFP control experiments, the s-value at 20°C from timestamp-corrected conventional analytical ultracentrifugation (AUC) data are 2.61 ± 0.03 S (previously 2.87 ± 0.03 S), which is now reasonably consistent considering instrument-dependent errors in temperature calibration with the fluorescence detection optics (FDS)-derived value of 2.54 ± 0.02 S, and with the value of 2.62 ± 0.02 S determined using the absorbance detector in the same FDS instrument.
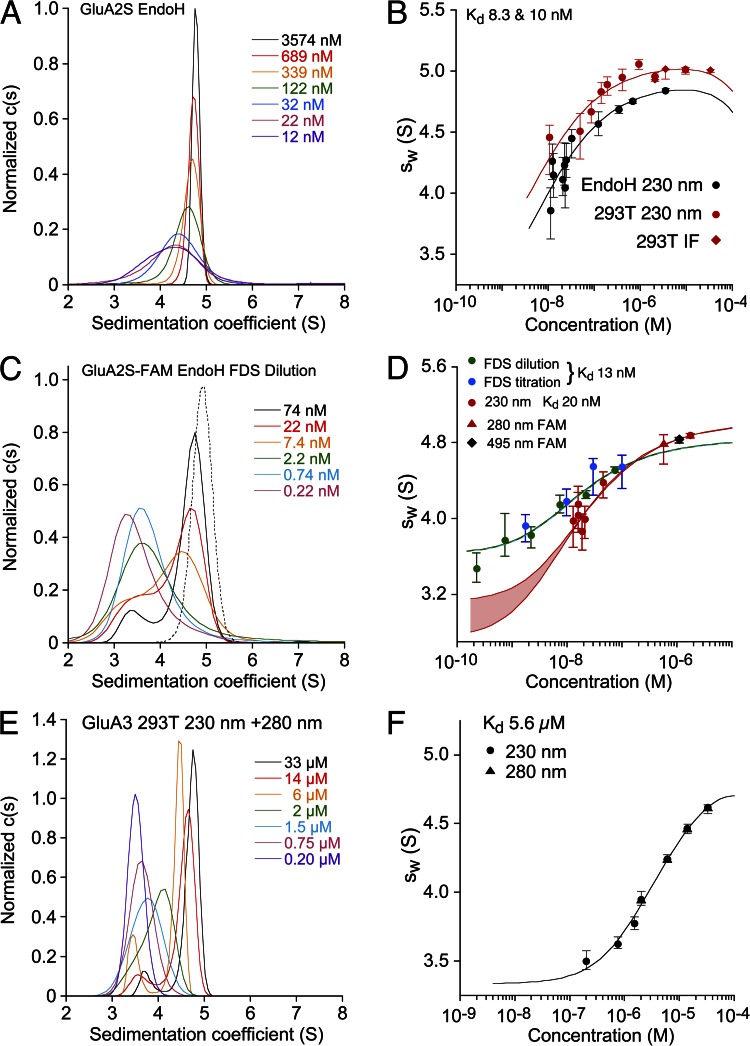
(2) Corrections were applied to the following GluA2 datasets shown in Fig. 3: The absorbance c(s) data shown in A and C, the sw isotherm for EndoH in B, as well as the absorbance-derived sw isotherm shown in D now have 10% lower s-values, with concomitant slight corrections to the reported binding constants. Studies on GluA3 shown in E and F were conducted before the installation of ProteomeLab version 6.0 data acquisition software and are unaffected. A corrected Fig. 3 is pro vided below. Notably, the gross difference in the limiting s-values for dimeric GluA2 in FDS and conventional detection is now removed (corrected Fig. 3, C and D). However, the best-fit unconstrained isotherm of the FDS-derived GluA2-FAM, with its high s w values for low concentrations and hydrodynamically unlikely ratio of best-fit dimer-to-monomer ratio of s-values, is unchanged. As a consequence, the last two sentences of the abstract no longer adequately summarize our results and should be deleted.
Figure 3.
Sedimentation velocity AUC analysis for GluA2 ATD performed with different optical systems. (A–D) Shown as pairs are the normalized sedimentation coefficient c(s) distributions (A and C) and the sw isotherm (B and D) derived by integration. All SV data and isotherm models are shown in units of experimental s-values. (A) c(s) distributions for EndoH-digested GluA2S measured at 230 nm. (B) Comparison of sw isotherms for the same data (black), and for GluA2S with complex glycosylation (red) acquired by absorbance at 230 nm (circles) and interference detection (diamonds); fits for a monomer–dimer association were calculated with hydrodynamic constraints for monomer s-values of 2.75–3.37 S (293T) or 2.9–3.3 S (EndoH). The best-fit dimer s-values were 5.18 S (EndoH) and 5.35 S (293T), with K d values of 10 and 8.3 nM, respectively. (C) Fluorescence-detected c(s) distributions for EndoH-digested, FAM-labeled GluA2S are shown as solid lines; the dotted line shows the c(s) distribution for absorbance detection at 495 nm of EndoH-digested, FAM-labeled GluA2S. (D) sw isotherms for EndoH-digested GluA2S derived from integration of fluorescence-detected c(s) profiles for a dilution series (green) and a titration series with unlabeled protein (blue), with the global best-fit isotherm in the absence of hydrodynamic constraints (blue-green line). For comparison, sw isotherms were measured by absorbance at 230 and 280 nm for the same preparation before (red circles) and after FAM labeling (red triangle), respectively, and by absorbance at 495 nm from a different FAM-labeled preparation (black diamond). The best-fit s-value of the dimer was 5.28 S, but the monomer s-value was undefined, with a range from 2.9 to 3.3 S, yielding statistically indistinguishable fits indicated by the red lines for the extreme values, with the shaded area highlighting the range. (E and F) GluA3 c(s) distributions and the isotherm of sw values fit with a monomer–dimer K d of 5.6 µM are unchanged from the original version.
(3) After correcting for these timestamp discrepancies, we find that the GluA2-binding constants derived from sw isotherms from three experiments have only slightly different values, within the previously reported confidence intervals (CIs). Even though all s w values of these isotherms are uniformly 10% lower, which by itself should leave K d values invariant, different best-fit values arise because hydrodynamic constraints were derived from hydrodynamic modeling and did not experience the same offsets. A corrected Table 1 is provided below. Overall, the range of best-fit K d values for unlabeled GluA2 is unchanged, but the average of individual measurements at 20°C for all constructs becomes 9.4 nM, rather than the previously stated 7.1 nM (page 378). In addition, we discovered a previous inconsistency in the hydrodynamic constraints applied to the FDS-SV data when analyzed alone, in comparison with the constraints applied to conventional SV. Adjustment of the FDS-SV constraints to the range of 2.9 to 3.3 S for the monomer and 4.6 to 5.3 S for the dimer, respectively, leads to a FDS-derived K d of the hydrodynamically constrained fit of 2.5 nM (95% CI; 0.4–7.8 nM), rather than 5.3 nM (95% CI; 3.0–14 nM) stated on page 386, confirming the consistency of FDS and conventional K d values as previously concluded.
TABLE 1.
Kd values determined for GluA2 constructs by different techniques
| Technique | Temperature | GluA2S | GnTI− | EndoH | GluA2L | GluA2S-FAM | EndoH-FAM | EndoH-DyLight |
| SV | 10°C | 6.0a [2.1–22] | 14.9b [7.6–47] | |||||
| 20°C | 8.3 [2.0–22] | 11 [0.8–43] | 12c [7.0–30] | 5.5 [2.8–43] | ||||
| 8.3 [5.1–27] | ||||||||
| 10 [3.0–20] | ||||||||
| FDS-SV | 20°C | 13d [0.76–203] | ||||||
| 2.5e [0.4–7.8] | ||||||||
| 10f [3.6–19] | ||||||||
| SE | 4°C | 160 [83–268] | ||||||
| 284 [159–461] | ||||||||
| 30g [ND–260] | ||||||||
| 10°C | 13h [0.14–50] | |||||||
| 17 [ND–74] | ||||||||
| 244h [46–643] | ||||||||
| FAI | 20°C | 10.8 [2.4–29] | ||||||
| 11.3 [ND–68] | ||||||||
| 8.43 [ND–50.8] |
Kd values are reported in nanomolar units. Errors represent the 95% CI using an automated surface projection method, unless indicated otherwise. 10 independent AUC experiments were performed for GluA2S digested with EndoH, as indicated by replicate entries for the mean and 95% CI. SV, sedimentation velocity with absorbance and interference optics; FDS-SV, sedimentation velocity with fluorescence detection optics; SE, sedimentation equilibrium with absorbance optics; FAI, fluorescence anisotropy.
68.3% CI.
The data obtained after FAM labeling of GluA2 led to the highest best-fit value, but the labeling does not significantly affect binding within the 95% CI of this assay.
Global analysis of the absorbance data at 230 nm shown in Fig. 3 D, with additional data acquired from the same experiment at 210 nm shown in Fig. S2 (top right).
Analysis of FDS-SV data only without hydrodynamic constraints.
Analysis of FDS-SV data only with hydrodynamic constraints.
Analysis of FDS-SV data with one additional single high concentration data point measured by absorbance at 488 nm.
Analysis with low loading concentration and 210-nm detection.
Analysis with oil layer to increase pressure.
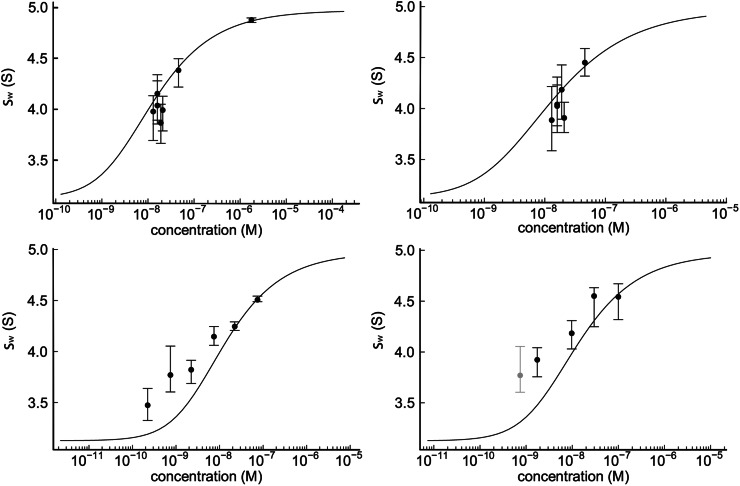
(4) As described on page 380 (Results) and page 386 (Discussion), we previously hypothesized that there may be an unrecognized instrument error causing a difference of 10% between data from the FDS-equipped instrument and the conventional instruments, for example, from possible temperature calibration errors. Accordingly, we previously applied ad hoc upward corrections to the FDS data and examined global fits of FDS and absorbance data, as shown in Figs. S2 and S3. These figures should now be deleted, as we have determined the source of the instrument difference, and a new, corrected replacement Fig. S2 substituted, where rather than increasing the FDS data the corrected absorbance data decrease by 10%.
Figure S2.
Global fit of the data shown in Fig. 3 D, consisting of the absorbance data at 230 nm (top left) and at 210 nm (top right) of GluA2S-EndoH, and the FDS-detected dilution series of FAM-labeled GluA2S-EndoH of the same preparation (bottom left) and its titration series with unlabeled material (bottom right). (A light gray data point at the lowest concentration of the titration series indicates the starting point of the titration and is identical to the second data point of the dilution series; it was excluded from the fit to avoid duplication.) The global fit was performed with a hydrodynamic constraint for the monomer s-value to be in the interval from 2.9 to 3.3 S, resulting in a K d of 12 nM (95% CI; 5.4–20 nM), although clearly the fit is of poor quality.
In summary, our conclusions regarding the source of the 2,400-fold range of K d values in the literature, which were the main focus of our paper, are unaffected by the accuracy of the scan data files generated by current Beckman Coulter data acquisition software for absorbance and interference systems (Zhao et al., 2013). In contrast, the mysterious large overall discrepancy between s-values determined with the FDS-equipped instrument and those determined with our set of conventional AUCs is resolved, but with one exception. The timestamp discrepancies introduced by the data acquisition software fully explain the 10% larger s-values measured in our control experiments with EGFP. Likewise, the same 10% overestimate applies to the s-values measured in conventional AUCs by absorbance optics as a control for the FAM-labeled, EndoH-digested GluA2 molecules. However, a surprising feature of the GluA2-binding isotherm determined by FDS is that the s-value of the GluA2 monomer is larger than predicted by hydrodynamics. At present, we do not know the cause of the discrepancy.
References
- Rhyner M.N. 2013. [RASMB] Timestamp Issue. Beckman Coulter, Inc. http://list.rasmb.org/pipermail/rasmb-rasmb.org/2013/002669.html (accessed March 29, 2013) .
- Zhao H., Ghirlando R., Piszczek G., Curth U., Brautigam C.A., Schuck P. 2013. Recorded scan times can limit the accuracy of sedimentation coefficients in analytical ultracentrifugation. Anal. Biochem. 437:104–108. 10.1016/j.ab.2013.02.011 [DOI] [PMC free article] [PubMed] [Google Scholar]


