

Abstract
Introduction
Elevated levels of plasma mitochondrial DNA (mtDNA) have been reported in trauma patients, and may contribute to the systemic immune response. We sought to determine the plasma levels of mtDNA in emergency department (ED) patients with and without sepsis and evaluate their association with severity of illness.
Methods
Prospective observational study of patients presenting to one of three large, urban, tertiary care EDs. Patients were enrolled into one of three cohorts: 1) sepsis defined as suspected infection and two or more SIRS criteria without hypotension; 2) septic shock defined as sepsis plus hypotension despite an adequate fluid challenge; and 3) control defined as non-infected ED patients without SIRS/hypotension. Plasma levels of three mtDNAs were measured using real-time quantitative PCR. Levels of mtDNAs were compared between the three cohorts and linear regression was used to assess the association between mtDNAs, IL-6, IL-10, and sequential organ failure assessment (SOFA) scores in patients with sepsis.
Results
We enrolled 93 patients: 24 controls, 29 with sepsis, and 40 with septic shock. As expected, co-morbidities and SOFA score increased across categories. We found no difference in mtDNA levels between the three groups (p = 0.14-0.30). Among patients with sepsis, we found a small but significant negative association between mtDNA level and SOFA score, most clearly with cytochrome b (p=0.03).
Conclusions
We found no difference in mtDNA levels between controls and patients with sepsis. mtDNA levels were negatively associated with organ dysfunction, suggesting that plasma mtDNA does not significantly contribute to the pathophysiology of sepsis.
Keywords: Sepsis, SIRS, mtDNA, mitochondrial DNA, inflammation
Introduction
Severe sepsis remains a significant public health concern, with over 750,000 patients hospitalized annually in the United States alone.(1) The characteristic presentation of the patient with sepsis includes systemic inflammatory response (SIRS), which results from an inflammatory immune response to both extrinsic and intrinsic factors.(2) Recently it was reported that in major trauma fragments of mitochondrial DNA (mtDNA) are released into the bloodstream, resulting in direct activation of polymorphonuclear neutrophils (PMNs) via Toll-like receptor-9 and formyl-peptide receptor-1 and a SIRS phenotype. The presumption of this reaction is based on the homology of mtDNA with pathogen associated molecular patterns recognized as foreign by the body.(3)
An increasing body of literature has reported significant dysregulation in number and function of mitochondria in sepsis.(4,5) Several studies have reported mtDNA in mononuclear cells and whole blood to be decreased in sepsis for reasons that remain unclear.(6,7) Although serum levels of cell-free nuclear DNA are reported to be elevated in bacteremia(8) and sepsis,(9) to our knowledge no report has evaluated plasma levels of mtDNA in sepsis. Our hypothesis was plasma mtDNA content in sepsis would be elevated due to cellular and mitochondrial injury, and these elevations would be associated with increased inflammation and severity of illness.
Methods
We performed a prospective, observational study of a convenience sample of patients presenting to three large, urban, tertiary care emergency departments. Patients were enrolled into one of three cohorts. The diagnosis of sepsis and septic shock followed American College of Chest Physicians / Society of Critical Care Medicine consensus definitions.(10) The sepsis cohort required suspected or confirmed infection, two or more SIRS criteria and no hypotension after adequate fluid resuscitation (systolic blood pressure (SBP) >90 mmHg after 20 mL/kg crystalloids). The septic shock cohort had to meet the inclusion criteria of suspected or confirmed infection, two or more SIRS criteria, and required refractory hypotension after fluid challenge or requirement for vasopressors. The third cohort of control patients comprised ED patients who had no suspicion of infection, no SIRS criteria and no evidence of hypoperfusion or hypotension.
Patients were excluded if they were <18 years old; were pregnant; had an established “Do Not Resuscitate” order prior to enrollment; had any of the following primary diagnoses: acute traumatic or burn injury, acute cerebrovascular event, acute coronary syndrome, acute pulmonary edema, cardiac dysrhythmia, acute and active gastrointestinal bleeding, acute drug overdose; had a requirement for immediate surgery; or had inability to obtain written informed consent. The study was approved by the Institutional Review Board at all institutions.
Clinical data and management
Demographic variables, co-morbidities, vital signs, and pertinent laboratory data were collected on all patients. Clinical management of severe sepsis at each participating institution follows the Surviving Sepsis Campaign guidelines.
Bio-Plex Analyte Profiling
Analyte concentrations were measured and quantified using a Bio-Plex Suspension Array System (Bio-Rad, Hercules, CA, USA). Assays for IL6 and IL10 (Bio-Rad) were performed according to the manufacturer's instructions. These assays use color-coded bead sets, each of which is conjugated with analyte-specific antibodies and designed in a capture sandwich immunoassay format. The samples were diluted with the supplied diluents as directed. The antibody-coupled beads were mixed and incubated with diluted plasma samples, or with the standards. Unbound proteins were removed by washing in the Bio-Plex Pro wash station and a biotinylated detection antibody was added to the beads. Each captured analyte was detected by the addition of a reporter molecule, streptavidin-phycoerythrin. The contents of each well were drawn into the Bio-plex array reader where precision fluidics align the beads and lasers excite them in order to quantify the captured analytes. Analyte concentrations were automatically calculated with Bio-Plex Manager software by using a standard curve derived from the recombinant standard provided with the assays.
mtDNA Isolation from Plasma and real-time quantitative PCR
Mitochondrial DNA was isolated from plasma using the Qiamp DNA Micro Kit (Qiagen, Valencia, CA) per vendor's directions. mtDNA was eluted in 50 μl of nuclease-free water. Real-time quantitative PCR (qPCR) was performed using previously described primers3 synthesized by IDT which amplify human cytochrome B (Cyt B), human cytochrome C oxidase subunit III (COX III) and human NADH dehydrogenase (NADH). The PCR reaction mixture consisted of 5 μl of DNA, 12.5 μl of 2X SYBR® Green PCR Master Mix (Applied Biosystems), 1 μl of forward and reverse primer (5 μM), and 5.5 μl of nuclease-free water. PCR was carried out with an ABI Prism 7500 Sequence Detection System at 50°C for 20 seconds, 95°C for 10 minutes, followed by 40 cycles at 95°C for 15 seconds, 60 seconds at the primer specific annealing temperature (53°C for Cyt B, 58°C for COX III, 55°C for NADH), and 30 seconds at the product specific fluorescence acquisition temperature (73°C for Cyt B, 78°C for COX III, 75°C for NADH). For concentration determination, a standard curve was generated by amplifying serial dilutions of a known quantity of amplicons. Amplicons consisted of purified PCR products which were gel purified using Qiagen's (Qiagen, Inc., Valencia, CA, USA) QIAquick Gel Extraction Kit as per the manufacturer's protocol. The concentration of the standards was determined by measuring absorbance at 260 nm (Nanodrop, Wilmington, DE). The standards in triplicate and DNA samples were co-amplified in the same reaction prepared from a master mix. Unknown concentrations were interpolated from the standard curve of known concentrations using the threshold cycle of the unknown sample. Concentrations are expressed as μg/mL.
Data Analysis and Outcomes
Baseline characteristics of the three groups were collected and continuous data were summarized using means or medians and standard deviations or interquartile ranges, as appropriate. Comparisons between groups were performed using one way ANOVA or Kruskal-Wallis tests, as appropriate. Categorical data were compared using chi-square, or Fisher exact tests, as appropriate. Correlations between inflammatory markers IL-6 and IL-10 were performed using Pearson's product moment correlation coefficient. In order to assess the prognostic value of mtDNA levels among the patients with sepsis, we first assessed for correlation between SOFA score at enrollment and levels of mtDNAs using Pearson's product moment correlation coefficient. In order to assess for the effect of potential confounders, we created a linear regression using SOFA score as the dependent variable, and NADH, Cox-III, and cytochrome b levels as the variables of interest in three separate models of only patients with sepsis and septic shock. Data were transformed as necessary to meet the assumptions of the model and the model was refined using reverse stepwise elimination. Candidate variables with a p<0.10 were maintained in the model. Bootstrap and jackknife estimations were performed on each of the models. Data were analyzed using commercially available statistical software (StatsDirect 2.7.7, Cheshire, England and STATA 10.0, College Station, TX). All statistical tests were two sided with p<0.05 considered significant.
Results
Baseline clinical data of the three cohorts are presented in Table 1. Both pro- and anti-inflammatory cytokines correlated with SOFA score (IL-10: κ = 0.45, p < 0.0001; IL-6: κ = 0.44, p <0.0001), as illustrated in Figures 1. IL-10 demonstrated a negative correlation across all mtDNAs as shown in Table 2 and Figure 2. IL-6 demonstrated a similar trend, but the only the relationship with COX-III was statistically significant (Table 2 and Figure 2). We found no significant difference in mtDNA measurements between cohorts. Plasma mtDNA measurements are summarized by cohort (Figures 3). Only 1/29 patients in the sepsis group and 1/40 patients in the septic shock group were later found to have non-infectious etiologies of their symptoms. Repeat analysis with exclusion of these patients demonstrated no significant changes to our results or conclusions (data not shown).
Table 1.
Patient demographics and clinical characteristics.
| Variable | Control group (N = 24) | Sepsis group (N = 29) | Septic Shock group (N = 40) |
|---|---|---|---|
| Age (years, SD) | 64.2 (16.8) | 55.1 (16.5) | 62.0 (18.6) |
| Race (%) | |||
| Caucasian - Non-hispanic | 13 | 20 | 28 |
| African American | 10 | 8 | 9 |
| Caucasian - Hispanic | 1 | 1 | 2 |
| Asian | 0 | 0 | 1 |
| Sex (%) | |||
| Male | 7 | 19 | 25 |
| Female | 17 | 10 | 15 |
| Co-morbidities (%) | |||
| Diabetes mellitus | 29 | 31 | 35 |
| Congestive heart failure | 8 | 17 | 25 |
| Chronic obstructive pulmonary disease | 8 | 14 | 15 |
| Malignancy | 0 | 14 | 15 |
| Disease severity*,+ | |||
| Initial lactate (mmol/L) | 1.1 (0.9, 1.8) | 1.5 (0.8, 1.8) | 2.0 (1.3, 3.9) |
| SOFA score (at Enrollment) | 0 (0, 1) | 1 (0, 2) | 4 (1, 5) |
| SOFA score (at 24 hours) | 1 (0, 2) | 1 (0, 3) | 4 (1, 8) |
| In-hospital mortality | 0 (0) | 1 (3) | 10 (25) |
Abbreviations: SOFA - Sequential Organ Failure Assessment
Median (IQR)
Disease severity scores calculated at time of enrollment
Fig. 1.
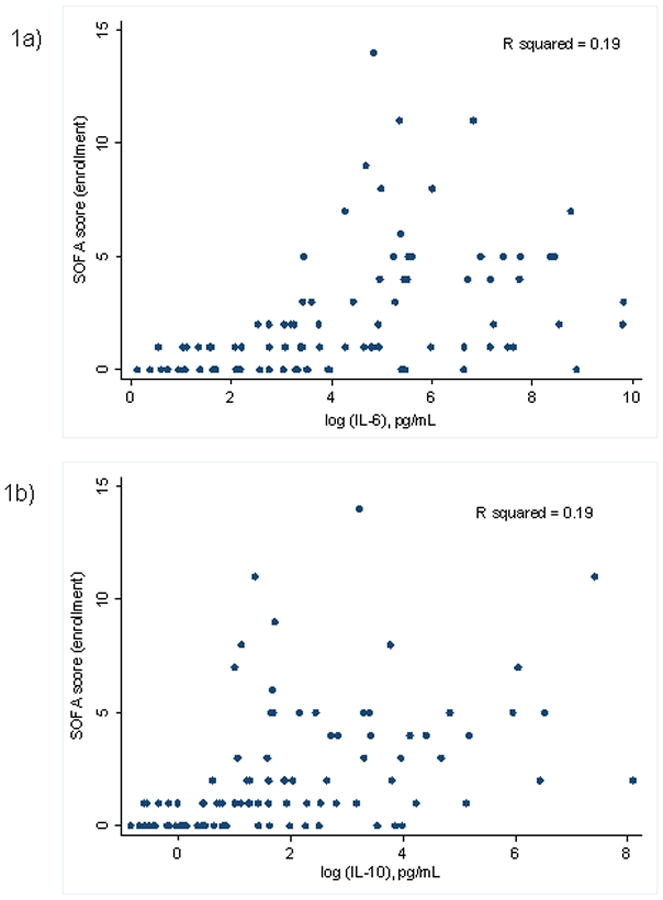
Scatterplots of SOFA score versus cytokines (A) IL-6 and (B) IL-10. Sequential Organ Failure Assessment score was calculated at enrollment for all patients and measurements of IL-6 and IL-10 in plasma taken from patients at enrollment, performed using Bio-Plex suspension array system.
Table 2.
Correlation between IL-10, IL-6, and plasma mtDNA levels in patients with sepsis (Pearson).
Significant at p <0.05
Fig. 2.

Scatterplots of cytokines IL-10 and IL-6 versus mtDNA in patients with sepsis. Measurements of IL-6 and IL-10 in plasma taken from patients at enrollment, performed using Bio-Plex suspension array system. Real-time quantitative PCR was used to measure mtDNAs (COX III, cytochrome b, and NADH) in concurrently drawn plasma.
Fig. 3.
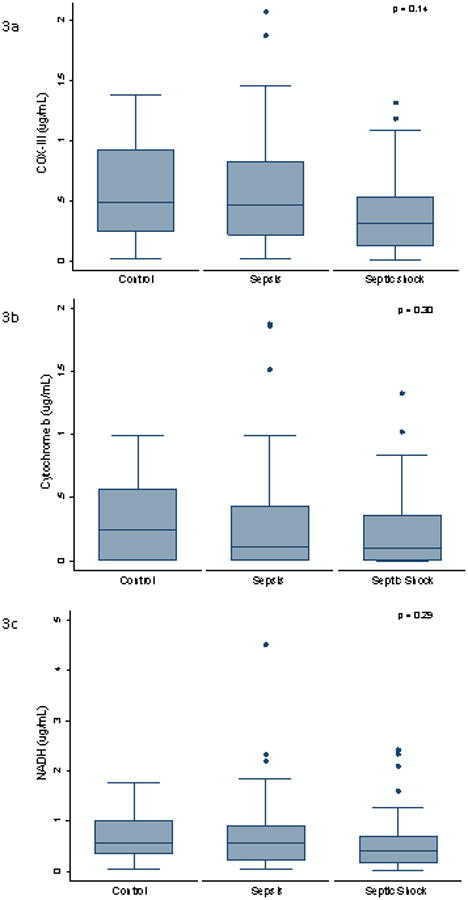
Box plots of plasma levels of mitochondrial (A) COX III, (B) cytochrome b, and (C) NADH at enrollment. Mitochondrial DNAs measured by Real-time quantitative PCR. The y axis represents concentration (in micrograms per milliliter).
Cytochrome b and COX-III levels demonstrated a small but significant negative correlation with severity of illness as measured by SOFA score at enrollment (Table 3) in our simple linear regression. In our multiple linear regression model, initial lactate was independently associated with SOFA score, though none of the other baseline demographics or co-morbidities were independently associated with SOFA score. Examination of residuals demonstrated no significant violation of any of the model assumptions. Bootstrap and jackknife estimations were consistent with the results of the models. After adjustment for confounders, cytochrome b and COX-III levels maintained a small but significant negative association with SOFA score (p=0.008 and p = 0.03).
Table 3.
Correlation between mtDNA and SOFA score at enrollment in patients with sepsis (Pearson)
| Variable (n=69) | Correlation with SOFA score at enrollment | P value |
|---|---|---|
| COX-III | -0.26 | 0.03 |
| Cytochrome b | -0.26 | 0.03 |
| NADH | -0.19 | 0.11 |
Discussion
In this prospective study of ED patients with sepsis, we found no difference between plasma levels of mtDNA between patients with sepsis versus controls. Additionally, we found a significant positive association between cytokine levels and SOFA score, and a negative relationship between cytokine levels and plasma mtDNA levels. We also found cytochrome b and COX-III to have a significant negative associations with SOFA score. We interpret these data to suggest that despite the pro-inflammatory effects of plasma mtDNA in trauma, mtDNA does not significantly contribute to the pathophysiology of the SIRS response in sepsis, contrary to our initial hypothesis. Rather, this data supports other observations in the literature that cellular damage, even in the bloodstream, is not a major finding in the setting of sepsis.
Interestingly, rather than finding a positive association with severity of illness, we found plasma mtDNA to be negatively correlated with severity of illness, even after controlling for potential confounders. We chose to focus our study on levels of free mtDNA in the plasma, based on the observations by Zhang that suggest that mtDNA directly induces inflammation due to homology with pathogen associated molecular patterns.(3) Our findings are not inconsistent with the findings by Cote, who found depressed mtDNA / nuclear DNA ratios in whole blood in patients with sepsis, though findings likely differ between these studies secondary to technical differences. First, Cote examined the ratio between mtDNA and nuclear DNA, whereas our study only examined mtDNA levels. Second, their study utilized an extraction from the buffy coat of whole blood samples, which includes the mtDNA of both plasma and cellular (platelet and white blood cell) mtDNA content. Their finding of depressed mtDNA in whole blood from septic patients may be secondary to depressed cellular rather than plasma mtDNA. This hypothesis is supported by work by Pyle, who demonstrated depressed mtDNA levels in peripheral leukocytes, and an association between depressed mtDNA count and poor outcome.(6) A potential explanation for these findings are that depressed mtDNA levels are associated with decreased number of mitochondria, and ultimately decreased energy metabolism. Such an explanation is supported by findings that increased mitochondrial biogenesis secondary to increased mtDNA copy number is associated with improved outcomes in a murine model sepsis.(11) However, further studies are needed to confirm if depressed levels of plasma mtDNA are indeed associated with increased severity of illness, to investigate if such levels are a marker of depressed mitochondrial protein synthesis, and ultimately to evaluate if this results in a measurable phenotypic change.
The strengths of this study include prospective enrollment of ED patients with and without sepsis, severe sepsis, and septic shock. This allowed us to evaluate the prognostic value of these markers at the most proximal phase of evaluation, with various severities of illness. Several weaknesses of the study deserve consideration, as well. First, we only studied plasma levels in the emergency department, and did not measure levels serially, so we cannot assess the variation of these levels in the intensive care unit or over time. Second, the overall severity of illness in this study is low, and it is possible that a more critically ill cohort would yield different results. Third, we did not measure intracellular mtDNA, and we cannot extrapolate these findings to cellular mtDNA content. Fourth, we examined a convenience sample of patients rather than consecutive patients. Finally, our study design only allows us to evaluate associations, and not causation.
Conclusion
We found no difference in mtDNA levels between controls and patients with sepsis. mtDNA levels were negatively correlated with severity of illness, suggesting that as opposed to trauma, the proinflammatory nature of plasma mtDNA does not significantly contribute to the pathophysiology of sepsis.
Acknowledgments
Dr Puskarich is supported by grant 10POST3560001 from the American Heart Association.
Reference List
- 1.Angus D, Linde-Zwirble W, Lidicker J, Clermont G, Carcillo J, Pinsky M. Epidemiology of severe sepsis in the United States: analysis of incidence, outcome, and associated costs of care. Crit Care Med. 2001;29:1303–1310. doi: 10.1097/00003246-200107000-00002. [DOI] [PubMed] [Google Scholar]
- 2.van der Poll T, Opal SM. Host-pathogen interactions in sepsis. Lancet Infect Dis. 2008;8:32–43. doi: 10.1016/S1473-3099(07)70265-7. [DOI] [PubMed] [Google Scholar]
- 3.Zhang Q, Raoof M, Chen Y, Sumi Y, Sursal T, Junger W, Brohi K, Itagaki K, Hauser CJ. Circulating mitochondrial DAMPs cause inflammatory responses to injury. Nature. 2010;464(4):104–108. doi: 10.1038/nature08780. [DOI] [PMC free article] [PubMed] [Google Scholar]
- 4.Fink MP. Bench-to-bedside review: Cytopathic hypoxia. Critical Care. 2002;6:491–499. doi: 10.1186/cc1824. [DOI] [PMC free article] [PubMed] [Google Scholar]
- 5.Singer M. Mitochondrial dysfunction in sepsis: Acute phase versus multiple organ failure. Crit Care Med. 2007;35(9):S441–S448. doi: 10.1097/01.CCM.0000278049.48333.78. [DOI] [PubMed] [Google Scholar]
- 6.Pyle A, Burn DJ, Gordon C, Swan C, Chinnery PF, Baudouin SV. Fall in circulating mononuclear cell mitochondrial DNA content in human sepsis. Intensive Care Med. 2010;36:956–962. doi: 10.1007/s00134-010-1823-7. [DOI] [PMC free article] [PubMed] [Google Scholar]
- 7.Cote HC, Day AG, Heyland DK. Longitudinal increased in mitochondrial DNA levels in blood cells are associated with survival in critically ill patients. Crit Care. 2007;11(4):R88. doi: 10.1186/cc6096. [DOI] [PMC free article] [PubMed] [Google Scholar]
- 8.Huttunen R, Kuparinen T, Jylhava J, Aittoniemi J, Vuento R, Huhtala H, Laine J, Syrjanen J, Hurme M. Fatal Outcome in Bacteremia is Characterized by High Plasma Cell Free DNA Concentration and Apoptotic DNA Fragmentation: A Prospective Cohort Study. PLoS One. 2011;6(7):1–8. doi: 10.1371/journal.pone.0021700. [DOI] [PMC free article] [PubMed] [Google Scholar]
- 9.Rhodes A, Wort SJ, Thomas H, Collinson P, Bennett ED. Plasma DNA concentration as a predictor of mortality and sepsis in critically ill patients. Crit Care. 2006;10(2):1–7. doi: 10.1186/cc4894. [DOI] [PMC free article] [PubMed] [Google Scholar]
- 10.Bone R, Balk R, Cerra F, et al. Definitions for sepsis and organ failure and guidelines for the use of innovative therapies in sepsis. The ACCP/SCCM Consensus Conference Committee. American College of Chest Physicians/Society of Critical Care Medicine. Chest. 1992;101:1644–1655. doi: 10.1378/chest.101.6.1644. [DOI] [PubMed] [Google Scholar]
- 11.Haden DW, Suliman HG, Carraway MS, Welty-Wolf KE, Ali AS, Shitara H, Yonekawa H, Piantadosi CA. Mitochondrial Biogenesis Restores Oxidative Metabolism during Staphylococcus aureus Sepsis. Am J Respir Crit Care Med. 2007;176(8):768–77. doi: 10.1164/rccm.200701-161OC. [DOI] [PMC free article] [PubMed] [Google Scholar]