

Abstract
Copy number alterations are frequently found in colorectal cancer (CRC), and recurrent gains or losses are likely to correspond to regions harbouring genes that promote or impede carcinogenesis respectively. Gain of chromosome 13q is common in CRC but, because the region of gain is frequently large, identification of the driver gene(s) has hitherto proved difficult. We used array comparative genomic hybridization to analyse 124 primary CRCs, demonstrating that 13q34 is a region of gain in 35% of CRCs, with focal gains in 4% and amplification in a further 1.6% of cases. To reduce the number of potential driver genes to consider, it was necessary to refine the boundaries of the narrowest copy number changes seen in this series and hence define the minimal copy region (MCR). This was performed using molecular copy-number counting, identifying IRS2 as the only complete gene, and therefore the likely driver oncogene, within the refined MCR. Analysis of available colorectal neoplasia data sets confirmed IRS2 gene gain as a common event. Furthermore, IRS2 protein and mRNA expression in colorectal neoplasia was assessed and was positively correlated with progression from normal through adenoma to carcinoma. In functional in vitro experiments, we demonstrate that deregulated expression of IRS2 activates the oncogenic PI3 kinase pathway and increases cell adhesion, both characteristics of invasive CRC cells. Together, these data identify IRS2 as a likely driver oncogene in the prevalent 13q34 region of gain/amplification and suggest that IRS2 over-expression may provide an additional mechanism of PI3 kinase pathway activation in CRC.
Keywords: colorectal cancer, copy number alterations, insulin receptor substrates, minimal copy regions, molecular copy-number counting, oncogene
Genomic instability is a common feature of the cancer genome and facilitates tumour progression (Lengauer et al. 1998; Hanahan & Weinberg 2000). Colorectal cancers (CRC) display two types of genomic instability: microsatellite instability (MSI) and chromosomal instability (CIN). Microsatellite instability is characterized by the expansion or contraction of microsatellite repeats and CIN by loss of heterozygosity and by aneuploidy. Here, the genomic profiles of predominantly CIN tumours were analysed to identify genes involved in cancer development and progression.
Cancer progression can be viewed as the successive clonal expansion of advantageous genotypes (Nowell 1976). In a dividing population of tumour cells, genomic alterations – in this case copy number alterations (CNAs) – will be subject to a number of selective pressures. In this model, alterations that confer a selective advantage, by promoting cell growth and survival, will be maintained, whereas disadvantageous changes will not. The pattern of recurrent copy number changes within a given cancer type is therefore likely to reflect the balance between advantageous and disadvantageous alterations (Stratton et al. 2009). These recurrent changes will be superimposed upon selectively neutral events peculiar to each cancer genome (Chin et al. 2011).
A number of studies have shown that the more prevalent CNAs often involve genes that are critical to cancer progression: the so-called driver oncogenes (in regions of gain) or tumour suppressors (in regions of loss; Martin et al. 2007; Wood et al. 2007; Stratton et al. 2009). The analysis of CNAs should therefore be able to guide the search for these critical genes. This approach is challenging, though, because such CNAs are often large, encompassing tens or hundreds of genes, the majority of which are presumed to be selectively neutral ‘passengers’ (Tonon et al. 2005). A minority of cancers, however, show small, focal copy number changes which fall within the larger, more commonly affected region of interest (Martin et al. 2007; Leary et al. 2008). Analysis of amplicon structure in these rare samples can more precisely define the ‘minimal affected region' or ‘minimal copy region’ (MAR or MCR), reducing the number of candidate genes that must be considered (Kendall et al. 2007; McCaughan et al. 2010; Poulogiannis et al. 2010a,b).
Most approaches using the concept of MCRs have relied on a single stage of copy number analysis using array-based platforms (aCGH/SNP; Martin et al. 2007; Chin et al. 2011). However, such methods typically leave some uncertainty as to the precise boundaries of the MCR and therefore fail to fully exploit its potential to pinpoint candidate driver genes. We have previously shown that molecular copy-number counting (MCC) is ideally suited to pinpointing the boundaries of copy number changes, even using very limited DNA samples (Daser et al. 2006; McCaughan et al. 2008). In the current study, we focus on the MCR on chromosome 13q34 in CRC, identified by us and others using array CGH (Lips et al. 2007; Martin et al. 2007). We use MCC to demonstrate that the smallest MCR contains a single whole gene – IRS2. We go on to perform the first comprehensive analysis of IRS2 gene copy number and expression in the different stages of CRC progression: from normal colonic mucosa to adenoma to adenocarcinoma. We also assess some functional properties of deregulated IRS2 expression in vitro. These data strongly implicate IRS2 as a driver oncogene within the recurrent 13q34 gain/amplicon in colorectal adenocarcinoma.
Material and methods
Colorectal clinical samples
Two independent sample sets were collected from colectomy surgical specimens. The first set of samples (CRC1, n = 119) was obtained from 94 patients with invasive colorectal primary carcinoma with or without evidence of metastatic cancer deposits. The CRC1 sample set comprised normal colonic mucosa (n = 22), primary adenocarcinoma (n = 65) and liver metastatic deposits (n = 32). The second set (CRC2, n = 133) comprised samples from normal colonic mucosa (n = 62), hyperplastic polyps (n = 7), adenomatous polyps (n = 27) and primary adenocarcinoma samples (n = 37) from a set of 44 patients presenting with synchronous adenoma and invasive carcinoma.
Ethical approval
Ethical approval for all the work conducted was obtained from Cambridgeshire local research ethics committee (LREC ref. 04/Q0108/125 and 06/Q0108/307).
Array comparative genome hybridization
Details of the array platform and statistical analysis have been previously described (Poulogiannis et al. 2010a,35). The array platform has a mean resolution of 0.97 Mb. The reference DNA consisted of a pool of mixed female and male normal leucocyte DNA from 20 unrelated individuals.
Molecular copy-number counting
Molecular copy-number counting has been described previously in detail (Daser et al. 2006; McCaughan et al. 2008). Molecular copy-number counting is a digital PCR technique wherein the sample of interest is dispensed at limiting dilution into multiple aliquots, so that each aliquot contains less than one haploid genome's worth of DNA. A multistep, multiplexed, single-molecule PCR is then used to count the number of aliquots containing each sequence of interest. By using reference sequences, which are assumed to be at normal copy number, the degree of copy number change can be estimated. Details of primer design can be found in Data S1.
Bioinformatic meta-analysis of IRS2 gene copy number and mRNA expression
The significance of copy number alteration across 161 colon cancer samples, including 33 CRC cell lines, was determined using the GISTIC algorithm with methods described previously (Beroukhim et al. 2010), using the data deposited at http://www.broadinstitute.org/tumorscape. Microarray expression data from The Cancer Genome Atlas (TCGA) and three previously published data sets (Kaiser et al. 2007; Hong et al. 2010; Skrzypczak et al. 2010) were downloaded from TCGA portal (https://tcga-data.nci.nih.gov/tcga/) and the Oncomine repository (http://www.oncomine.org/). The distributions of log2 median-centred signal intensities were plotted using box plots.
Tissue microarray
The construction of the tissue microarray (TMA) has previously been described (Ibrahim et al. 2011). The TMA contains 419 tissue samples from 64 cases: 23% normal colonic mucosa, 7% hyperplastic polyps, 15% adenomas, 34% primary colorectal carcinomas and 21% metastatic CRC samples. The strength of immunohistochemical staining was semiquantitatively scored as negative (0), weakly positive in some cells (1), moderately positive in most cells (2) or strongly positive in most cells (3) by a consultant histopathologist (AI), who rescored a proportion of samples to confirm reproducibility of scoring. The data were analysed using the mode score for each patient/histological type using a chi-squared test with significance set at P < 0.05. Antibody specificity is demonstrated in Figure S2.
Functional analysis of IRS2 over-expression
Solutions and culture conditions are detailed in Data S1. Transfections were carried out with Lipofectamine 2000 (Life Technologies, Carlsbad, CA, USA) following the manufacturer's guidelines. Successful transfection was confirmed by Western blotting. The pcDNA3.1Irs2-HA construct was a kind gift from Douglas Yee (University of Minnesota, USA; Jackson et al. 2001), and an empty pcDNA3.1 construct was used as a control.
For cell cycle analysis, 1 × 10⁶ SW480 cells were fixed in 70% ice-cold ethanol and placed at −20 °C for at least 24 h. Cells were then washed and resuspended in staining solution (0.1% Triton, 0.2 mg/ml Rnase A and 0.02 mg/ml propidium iodide). Ten thousand events were collected on a FACSCalibur flow cytometer (BD Biosciences, Franklin Lakes, NJ, USA). The data were analysed in flowjo (Treestar, Ashland, OR, USA) using the cell cycle analysis protocol (Watson model). Ct values of <6 were required. The adhesion assay has previously been described (Zhang et al. 2005). For both the cell cycle and adhesion analyses, the cells were serum-starved for 18 h before the addition of IGF-1.
Results
Analysis of DNA gains/amplifications by aCGH identifies a relevant MCR on chromosome 13q34
Analysis of the array comparative genome hybridization (aCGH) data from the two tumour series, including a total of 124 CRC cases, identified potential MCRs – defined as focal changes <5 Mb in size. This analysis highlighted a region on chromosome 13q34, which was focally gained in five cases. Two of these cases were then chosen for further analysis: case 026 because it showed the narrowest identified amplicon and the case 031 due to the degree of copy number increase (031; Table 1, Figures 1a,b and S1). These focal gains fell within a larger region that showed DNA copy number gains in 35% (44/124) of tumours in these two series combined; a higher prevalence of 13q34 gains has been described in the literature (Lips et al.2007; Martin et al. 2007, and see Discussion).
The copy number of IRS2 in 124 sporadic colorectal cancers and 35 hyperplastic polyps
| Number of cases | Loss | Normal (2 copies) | 3 copies | 4–5 copies | Amplification (>5 copies) | Focal gains (<5 Mb) |
|---|---|---|---|---|---|---|
| Carcinoma | 2 | 78 | 36 | 6 | 2 | 5 |
| Hyperplastic polyp | 0 | 15 | 17 | 2 | 1 | 3 |
DNA copy number cut-offs: Loss – <1.75, Normal – 1.75–2.5, three copies – 2.5–3.5, 4–5 copies – 3.5–5.5, Amplification – >5.5. Focal gains were defined as DNA copy number increases (three copies or more) affecting <5 Mb of DNA and encompassing IRS2.
Figure 1.

(a, b) Array CGH data showing the DNA copy number (normal copy = 1; dotted line) as a function of position on chromosome 13 for (a) case 026 and (b) case 031. (c, d) Refinement of amplicon boundaries by molecular copy-number counting (MCC) for (c) case 026 and for (d) case 031. In each case, the aCGH data are indicated by open circles and a dashed line; the MCC data are indicated by small filled circles and a solid line. The black and open horizontal bars show the extent of the amplicon as defined by MCC and aCGH respectively. The positions of protein-coding genes are shown below the axis of (c). All positions are relative to the NCBI36 human genome assembly.
The smallest amplicon defined by aCGH (case 026; Figure 1a) in the 13q34 region spanned 2.5 Mb and contained 10 genes. A slightly larger (3.2 Mb) focal gain in this region was also seen in case 031, encompassing 13 genes; this case was also notable in that the region was present at eight copies, relative to normal (diploid) copy number (Figure 1b). The relatively low resolution of the array CGH data made it likely that one or both of these small amplicons were in fact smaller than indicated by aCGH, making it desirable to analyse these two cases at higher resolution.
MCC to refine the 13q34 MCR
Molecular copy-number counting analysis of the amplicons was used to define the boundaries of the gains at high resolution. In case 026, MCC refined the amplicon size from 2.5 Mb (containing 10 genes) to 1 Mb; IRS2 was the only complete protein-coding gene within the refined amplicon (Figure 1c). Two non-coding RNAs (miRNA AL161431.1 and ncRNA7SK; not shown) also lie within this 1-Mb amplicon, but their functions are unknown. Similar analysis of case 031 refined its amplicon size from 3.2 to 2.4 Mb (Figure 1d), spanning several genes but again including IRS2. As a result of this high-resolution analysis, IRS2 was considered to be a strong candidate for a driver oncogene.
IRS2 gene copy number in hyperplastic polyps
Array CGH analysis of a series of colorectal hyperplastic polyp samples (35 cases) was carried out to determine whether 13q34 gain occurred in these lesions of very low malignant potential (Iino et al. 1999; Jass 2003). A gain in 57% of these samples was demonstrated (Table 1).
IRS2 gene copy number and expression in CRC progression
Bioinformatic meta-analysis of IRS2 gene copy number and mRNA expression
It is difficult to predict the impact of the copy number changes, making it necessary to assess the correlation of IRS2 gene copy number with expression. To achieve this, a comprehensive meta-analysis of the gene copy number and mRNA expression levels in TCGA colon cancer data set was undertaken. This showed that IRS2 was frequently amplified in CRC and, importantly, that IRS2 gene copy number was significantly positively correlated with IRS2 mRNA expression (Figure 2a–c).
Figure 2.

Bioinformatic analysis of genomic and transcriptional aberrations of IRS2 in colorectal cancer (CRC). (a) Pie chart indicating the relative proportions of CRC tumours and cell lines with IRS2 DNA copy number alterations (n = 161) (low-level amplification corresponds to 2–4 copies, while high-level amplification corresponds to >4 copies). (b) Plot of the genomic landscape in the region of IRS2. Shaded bars in the main box show regions of gain (scale on far right) in individual cases in the same series as in (a); genes in this 2.4-Mb region are shown on the left; the boundaries of IRS2 are indicated by black lines across the box. An ideogram of Chr.13 is on the right. (c–e) Box plots of IRS2 mRNA expression plotted as log2 median-centred signal intensities. (c) IRS2 mRNA expression in 224 primary CRCs, obtained from the Cancer Genome Atlas (TCGA) project, indicating a positive correlation of IRS2 mRNA expression with higher DNA copy number status; circles are individual datapoints (one-way anova, P = 6.6e-09). (d) IRS2 mRNA expression in colorectal cancer (white boxes) and normal mucosa (grey boxes) based on two independent microarray experiments. Welch two-sample t-test: Hong et al. (2010) P = 6.6e-10 and Kaiser et al. (2007) P = 0.02. (e) Increasing IRS2 mRNA expression across the sequence from normal mucosa, through adenoma, to carcinoma in the colorectum. Welch two-sample t-test: normal to adenoma P = 0.001, adenoma to carcinoma P = 4.3e-07, normal to carcinoma P = 8.4e-07 (Skrzypczak et al. 2010).
IRS2 expression is not solely a function of gene copy number and is likely to be influenced by a number of feedback loops and other mutations. Therefore to further explore the transcriptional status of IRS2 in CRC, the distributions of IRS2 mRNA levels in two independent microarray data sets were plotted to show that IRS2 expression is significantly higher in colon carcinomas than in normal mucosa samples (Figure 2d,e; Hong et al. 2010).
The copy numbers and/or expression levels of driver oncogenes are likely to correlate with disease stage (Bertucci et al. 2004; Garnis et al. 2004). To assess this, bioinformatic analysis and TMA analysis of IRS2 expression during tumour progression from normal through adenoma to carcinoma were carried out. A single expression data set containing samples from all three stages of colorectal carcinoma formation was available (Skrzypczak et al. 2010). In this data set, IRS2 mRNA levels showed significant increases through the normal-to-adenoma-to-carcinoma sequence (Figure 2e).
Immunohistochemical analysis of IRS2 protein expression
The TMA-IHC analysis showed that all pathological groups differed significantly from normal colon mucosa with respect to IRS2 expression and demonstrated an increase in IRS2 expression with progression through the stages of colorectal carcinoma formation (Figure 3a,b). Tissue sections from cases 026 and 031 were also stained and showed an increase in IRS2 expression in the carcinoma in comparison with the adjacent normal tissue, consistent with the specific amplification of the IRS2 gene in these cases (Figure 3c).
Figure 3.
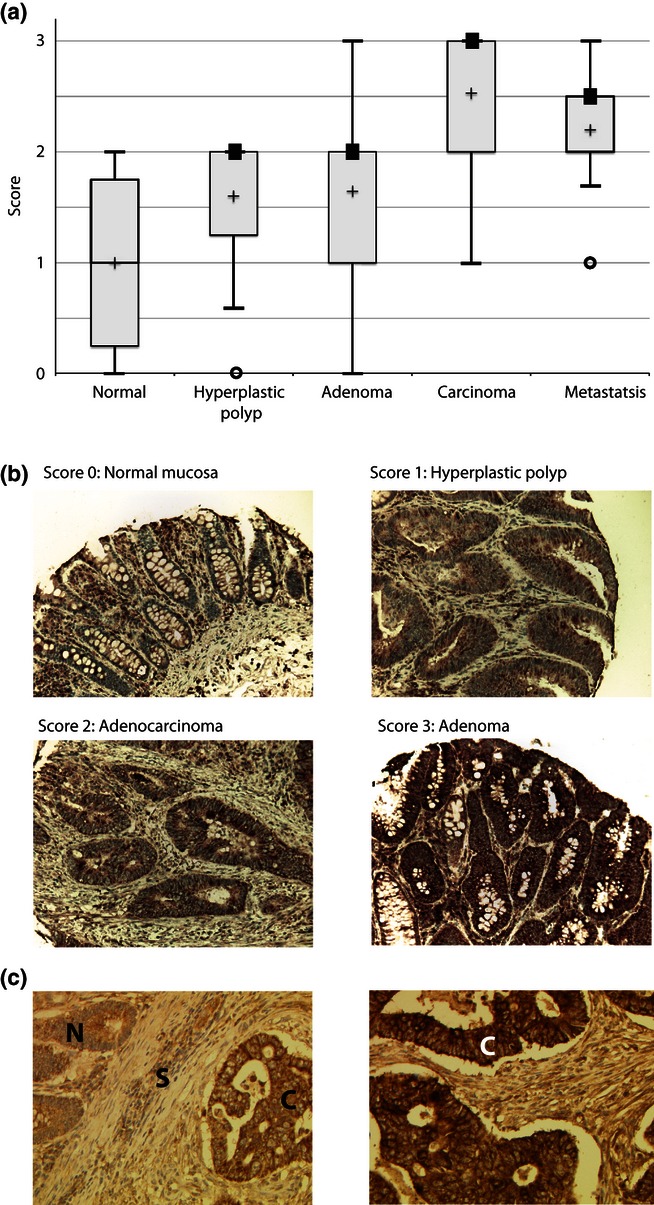
(a) Box plot of IRS2 protein levels assessed on a tissue microarray (TMA) of 64 cases. Solid black boxes indicate the median when this shares the same value as a percentile value. The mean is marked with a cross. All groups differed significantly (chi-squared test, P-value < 0.05). (b) Immunohistochemical analysis of IRS2 protein from representative samples on the TMA demonstrating the four levels of staining. (c) Immunohistochemical analysis of IRS2 protein in colorectal cancer (CRC) cases 026 (left) and 031 (right). N, normal mucosa; S, stroma; C, carcinoma.
Functional analysis of IRS2 over-expression in vitro
IRS proteins are adaptors in the insulin and IGF signalling cascades (Dearth et al. 2007). These cascades use the oncogenic PI3K and MAPK pathways and control many characteristics important to tumour progression including cell proliferation, adhesion and migration (Figure 4a; Yuan & Cantley 2008). Differential adaptor protein activation is likely to be one mechanism by which a single extracellular signal can have distinct phenotypic effects (Csiszar 2006). In breast cancer, IRS2 is implicated in metastasis, but not in growth and proliferation (Jackson et al. 2001; Zhang et al. 2004; Byron et al. 2006; Gibson et al. 2007).
Figure 4.
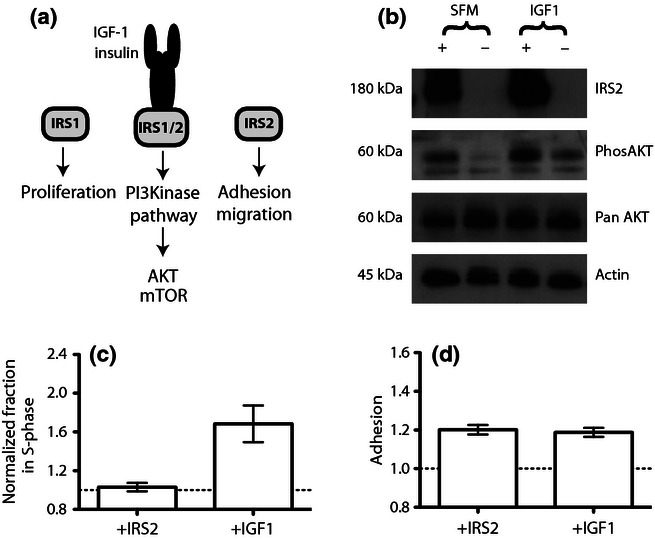
(a) IRS2 signalling. Canonically, IRS proteins signal through the PI3K pathway linking the upstream receptors (IGFR and IR) with the downstream initiators of the signalling cascades (PI3K/AKT/mTOR). The PI3K pathway can be activated by both IRS1 and IRS2, but the adaptors are suggested to mediate distinct phenotypic effects. (b) Western blot analysis of lysates from SW480 cells transiently transfected with IRS2 (+) or mock-transfected with an empty plasmid (−). The blot has been probed with antibodies specific to IRS2, phosphorylated AKT (phos-AKT) and, as loading controls, pan-AKT and beta actin (Table S1). Cells were serum-starved and either treated with IGF-1 (100 ng/ml) or kept in serum-free media (SFM) as a control. (c) FACS cell cycle analysis of SW480 cells transiently transfected with pcDNA.IRS2 (+IRS2), or stimulated with IGF-1 (100 ng/ml). The y-axis indicates the percentage of cells in S-phase normalized to the paired control for that group, either mock-transfected cells or serum-starved cells with no IGF-1 stimulation. The control groups have been assigned the value 1 (dotted line) in order to show the relative changes in S-phase percentages. (d) Analysis of relative adhesion of SW480 cells transiently transfected with pcDNA.IRS2 (+IRS2) or mock-transfected and stimulated with IGF-1 (100 ng/ml). The y-axis indicates the adhesion of cells, normalized by multiplying the absorbance by the value required to convert the average absorbance values for the control group (mock-transfected) to 1. The control group was the same for both experimental groups. For both (c) and (d), experiments were carried out in triplicate on different days, and the error bars represent ±1 SEM. Raw data are provided in a Supporting information.
To begin to assess some of the functional implications of IRS2 over-expression in CRC, three functional in vitro assays were used. The CRC cell line SW480, derived from a primary Dukes' stage B colon carcinoma, was chosen because endogenous levels of IRS2 expression were undetectable. Transient over-expression was achieved through transfection with pcDNA.IRS2-HA (Jackson et al. 2001) and expression of IRS2 confirmed by immunoblotting (Figure 4b).
PI3 kinase pathway activation
IRS2 over-expression led to PI3K pathway activation as evidenced by phosphorylation of AKT (pAKT) in the absence of upstream activation (e.g. by IGF-1; Figure 4b, Lane 1). It is challenging to remove all traces of upstream activators in cultured cells; however, the cells grown in serum-free media demonstrate low levels of pAKT (Figure 4b, Lane 2), thus suggesting minimal upstream activation and therefore ligand-independent activation of the PI3K pathway by IRS2 over-expression. Treatment of the mock-transfected cells with IGF-1 alone led to the phosphorylation of AKT. These cells have no detectable IRS2 expression, which therefore suggests signalling is taking place via another adaptor, possibly IRS1.
MAPK pathway activation was also assessed in a similar manner, and results suggested constitutive activation of this pathway in the cell line independent of IGF-1, epidermal growth factor and IRS2 expression (data not shown).
Cell cycle and adhesion assays
To assess whether IRS2 over-expression influenced cell cycle and adhesion, in vitro assays were set up using the transiently transfected SW480 cells. Cell proliferation was assessed by flow cytometry and cell cycle analysis. Adhesion was determined by the ability of the cells to adhere to a collagen-coated plate (Zhang et al. 2005). Migration studies were also carried out using SW480 cells but yielded inconclusive results (data not shown). Consistent with prior data in breast cancer, the assays demonstrated that IRS2 over-expression does not modify cell proliferation but does increase cell adhesion, whereas IGF-1 stimulation of mock-transfected cells increased both proliferation and adhesion (Figure 4c,d). Prior to these assays, the cells were serum-starved to remove potential upstream activators of the PI3K pathway, suggesting that increased adhesion in IRS2-over-expressing cells is ligand independent.
Discussion
Minimal copy region analysis pinpoints IRS2 as a candidate driver gene in CRC
Minimal copy regions are rare sites of focal DNA copy number changes seen within larger regions that more frequently show such changes. It is likely that MCRs contain the genes driving the larger, more prevalent copy number changes, and data presented here demonstrate how MCRs can be used to identify candidate driver genes. This analysis focused on an MCR identified on chromosome 13q34 in CRC.
The 13q34 region, within which IRS2 is found, frequently shows gains in CRC, with a prevalence of up to 85% reported in the literature (Lips et al. 2007; Martin et al. 2007). Our aCGH analysis shows a lower prevalence of this gain, with IRS2 copy number increased in 35% of CRCs analysed, with 4% of cases showing focal gains of <5 Mb. A further 1.6% of cases contained amplifications of this region, which is in keeping with other reports (Parsons et al. 2005; Table 1). Despite their lower prevalence, focal changes and amplifications are a strong indication of a functional copy number change (Poulogiannis et al. 2010a; Chin et al. 2011).
The smallest focal change in the region identified by aCGH still contained 10 genes, making it difficult to propose a candidate driver gene. It was therefore necessary to refine the boundaries of the amplicon. Molecular copy-number counting is ideally suited to this application, both because it can be applied iteratively to refine amplicon boundaries and because it requires very little sample DNA. Through this refinement, IRS2 was pinpointed as a potential driver oncogene in CRC.
Copy number and mRNA and protein expression analysis support IRS2 as a candidate oncogene
To assess IRS2 as a candidate driver gene, its copy number and expression were assessed across separate series of tumours. Our meta-analysis using TCGA demonstrates IRS2 gains in 52.2% of CRCs, with 11.8% showing high-level amplification in this region (Figure 2a). This supports previous studies, which have proposed IRS2 as a candidate based on copy number analysis (Lips et al. 2007; Martin et al. 2007; Beroukhim et al. 2010). However, none of these studies correlated these observations with an assessment of IRS2 expression in CRC. Previous studies characterizing IRS2 expression across human cancers, including CRC, have failed to show a clear correlation between expression and the progression from normal tissue to carcinoma (Mardilovich et al. 2009; Zha et al. 2009). In contrast, our analysis correlates IRS2 copy number with mRNA expression (Figure 2c) and demonstrates that expression at both the mRNA and protein level increases with progression (Figures 2e and 3a). This suggests that expression of IRS2 may influence the progression of CRC and supports data from Szabolcs et al. (2009) showing that IRS2 inactivation suppressed tumour progression in Pten+/− mice.
IRS2 gene copy number and expression in hyperplastic polyps do not correlate, suggesting feedback mechanisms may be important
The analysis of hyperplastic polyps in this study shows that 57% of cases demonstrate a gain in IRS2, compared to 35% of carcinomas. This is unexpected given that these lesions are not considered immediate precursors of malignancy, although a very small proportion may progress along the serrated/MSI pathway of colorectal neoplasia. However, the copy number does not correlate with IRS2 protein levels seen in this type of lesion – no hyperplastic polyps demonstrated significant over-expression (a score of 3 on the TMA-IHC analysis; Figure 3a, Table 1). It is therefore possible that feedback mechanisms, controlling IRS2 protein levels, are still functioning in these lesions, thus preventing an increase in IRS2 expression. IRS2 protein levels are controlled by negative feedback from downstream components of the PI3K pathway, specifically via mTOR/S6 kinase (Manning 2004). This is of particular importance in the context of cancer therapy, as feedback will be lost in mTOR-targeted chemotherapy (McCampbell et al. 2010). Therefore, in the light of data presented here and by others showing IGF-1-independent phosphorylation of AKT by IRS2 over-expression, mTOR inhibition has the potential to activate components of the oncogenic PI3 pathway (Dearth et al. 2006).
IRS2 over-expression in vitro results in AKT phosphorylation independent of IGF-1 stimulation and may confer an advantageous phenotype to CRC
The insulin receptor substrate (IRS) family of proteins are adaptors linking upstream activators, canonically insulin and IGF-1, to multiple downstream effectors with roles in normal growth, metabolism and differentiation (Figure 4a; Dearth et al. 2007). The role of IRS proteins in CRC is unclear, but a number of studies in breast cancer have suggested a role in proliferation and metastasis of cancer cells (Zhang et al. 2004; Byron et al. 2006; Gibson et al. 2007; Mardilovich et al. 2009).
We have shown that IRS2 over-expression in the absence of an upstream activator, in the CRC cell line SW480, leads to AKT phosphorylation (Figure 4b). This observation is supported by previous studies of IRS2 over-expression in both breast cancer and mouse fibroblasts showing AKT phosphorylation independent of IGF-1 (Hennige et al. 2000; Mardilovich & Shaw 2009). This is significant as inappropriate AKT activation is oncogenic and a potential therapeutic target (Hsieh et al. 2011). IRS2 over-expression also increases CRC cell adhesion to a similar extent to IGF-1 stimulation, but has no effect on cell cycle in this cell line; this is in agreement with observations in breast cancer and supports a role of IRS2 in adhesion, but not in proliferation (Jackson et al. 2001; Gibson et al. 2007). Changes to adhesion, both increases and decreases, are important properties of metastasizing cancer cells and are involved in invasion, migration, arrest within the circulation and distant ‘seeding’ of a tumour (Hewitt et al. 2000; Schluter et al. 2006). It is possible that proliferation stimulated by IGF-1 is mediated by IRS1 in the SW480 cell line. Although the physiological relevance of the levels of expression seen in these assays remains to be proven, the results indicate that IRS2 over-expression has the potential to confer an advantageous phenotype upon cancer cells.
IRS2 and PI3 kinase pathway in CRC
The PI3K pathway is frequently dysregulated in CRC, and this can be a consequence of alterations at any level of the pathway – from receptor mutations to the deletion of negative regulators such as PTEN and mutations and subsequent over-expression of effectors such as AKT (Parsons et al. 2005). Recently, TCGA Network demonstrated in CRC that high levels of IRS2 expression are mutually exclusive with IGF2 over-expression and with other mutations in the PI3K pathway (TCGA 2012). This suggests that IRS2 over-expression is one mechanism by which the PI3K pathway may be dysregulated in CRC, and our data support this conclusion.
In summary, we have used high-resolution analysis of the 13q34 amplicon in two CRC cases to pinpoint the gene IRS2 as a potential driver oncogene in this amplicon. We also show the first focused analysis of IRS2 protein and mRNA levels in colorectal neoplasms, demonstrating its strongly positive correlation with CRC progression. Preliminary functional in vitro analysis suggests that, as has been seen in other cancer types, IRS2 over-expression confers an advantageous phenotype on CRC cells. This highlights the need for further work to address the circumstances in which IRS2 contributes to CRC progression. Together, these data indicate IRS2 as a strong candidate oncogene and support recent suggestions that the IGF1R–IRS2–PI3K axis may be an important therapeutic target in a subset of CRC (TCGA 2012).
Funding source
This study was supported by the Medical Research Council and Cancer Research UK. AEKI is Cancer Research UK Clinician Scientist Fellow (WT097143MA). FM is a Wellcome Trust Intermediate Clinical Fellow. GP is a Pfizer fellow of the Life Sciences Research Foundation. The Human Research Tissue Bank is supported by the NIHR Cambridge Biomedical Research Centre.
Conflict of interest
The authors declare that they have no conflict of interest.
Supporting Information
Additional Supporting Information may be found in the online version of this article
Regions of DNA copy number alteration identified along chromosome 13 by the aCGH analysis of the second CRC series of 50 CRCs, showing the percentage of samples with gain of copy (copy number > 1.25, where normal copy = 1) against chromosomal position (NCBI36).
Confocal microscopy of IRS2-positive and negative cells.
For each marker, the sequences of the forward (Fex) and reverse (Rvs) primers are given (5′–3′).
Adhesion analysis.
Antibodies
Functional analysis.
References
- Beroukhim R, Mermel CH, Porter D, et al. The landscape of somatic copy-number alteration across human cancers. Nature. 2010;463:899–905. doi: 10.1038/nature08822. [DOI] [PMC free article] [PubMed] [Google Scholar]
- Bertucci F, Salas S, Eysteries S, et al. Gene expression profiling of colon cancer by DNA microarrays and correlation with histoclinical parameters. Oncogene. 2004;23:1377–1391. doi: 10.1038/sj.onc.1207262. [DOI] [PubMed] [Google Scholar]
- Byron SA, Horwitz KB, Richer JK, Lange CA, Zhang X, Yee D. Insulin receptor substrates mediate distinct biological responses to insulin-like growth factor receptor activation in breast cancer cells. Br. J. Cancer. 2006;95:1220–1228. doi: 10.1038/sj.bjc.6603354. [DOI] [PMC free article] [PubMed] [Google Scholar]
- Chin L, Hahn WC, Getz G, Meyerson M. Making sense of cancer genomic data. Genes Dev. 2011;25:534–555. doi: 10.1101/gad.2017311. [DOI] [PMC free article] [PubMed] [Google Scholar]
- Csiszar A. Structural and functional diversity of adaptor proteins involved in tyrosine kinase signalling. BioEssays. 2006;28:465–479. doi: 10.1002/bies.20411. [DOI] [PubMed] [Google Scholar]
- Daser A, Thangavelu M, Pannell R, et al. Interrogation of genomes by molecular copy-number counting (MCC) Nat. Meth. 2006;3:447–453. doi: 10.1038/nmeth880. [DOI] [PubMed] [Google Scholar]
- Dearth RK, Cui X, Kim H-J, et al. Mammary tumorigenesis and metastasis caused by overexpression of insulin receptor substrate 1 (IRS-1) or IRS-2. Mol. Cell. Biol. 2006;26:9302–9314. doi: 10.1128/MCB.00260-06. [DOI] [PMC free article] [PubMed] [Google Scholar]
- Dearth RK, Cui X, Kim HJ, Hadsell DL, Lee AV. Oncogenic transformation by the signaling adaptor proteins insulin receptor substrate (IRS)-1 and IRS-2. Cell Cycle. 2007;6:705–713. doi: 10.4161/cc.6.6.4035. [DOI] [PubMed] [Google Scholar]
- Garnis C, Buys TP, Lam WL. Genetic alteration and gene expression modulation during cancer progression. Mol. Cancer. 2004;3:9. doi: 10.1186/1476-4598-3-9. [DOI] [PMC free article] [PubMed] [Google Scholar]
- Gibson SL, Ma Z, Shaw LM. Divergent roles for IRS-1 and IRS-2 in breast cancer metastasis. Cell Cycle. 2007;6:631–637. doi: 10.4161/cc.6.6.3987. [DOI] [PubMed] [Google Scholar]
- Hanahan D, Weinberg RA. The hallmarks of cancer. Cell. 2000;100:57–70. doi: 10.1016/s0092-8674(00)81683-9. [DOI] [PubMed] [Google Scholar]
- Hennige AM, Lammers R, Arlt D, et al. Ret oncogene signal transduction via a IRS-2/PI 3-kinase/PKB and a SHC/Grb-2 dependent pathway: possible implication for transforming activity in NIH3T3 cells. Mol. Cell. Endocrinol. 2000;167:69–76. doi: 10.1016/s0303-7207(00)00283-5. [DOI] [PubMed] [Google Scholar]
- Hewitt RE, McMarlin A, Kleiner D, et al. Validation of a model of colon cancer progression. J. Pathol. 2000;192:446–454. doi: 10.1002/1096-9896(2000)9999:9999<::AID-PATH775>3.0.CO;2-K. [DOI] [PubMed] [Google Scholar]
- Hong Y, Downey T, Eu KW, Koh PK, Cheah PY. A ‘metastasis-prone’ signature for early-stage mismatch-repair proficient sporadic colorectal cancer patients and its implications for possible therapeutics. Clin. Exp. Metastasis. 2010;27:83–90. doi: 10.1007/s10585-010-9305-4. [DOI] [PubMed] [Google Scholar]
- Hsieh AC, Truitt ML, Ruggero D. Oncogenic AKTivation of translation as a therapeutic target. Br. J. Cancer. 2011;105:329–336. doi: 10.1038/bjc.2011.241. [DOI] [PMC free article] [PubMed] [Google Scholar]
- Ibrahim AE, Arends MJ, Silva AL, et al. Sequential DNA methylation changes are associated with DNMT3B overexpression in colorectal neoplastic progression. Gut. 2011;60:499–508. doi: 10.1136/gut.2010.223602. [DOI] [PubMed] [Google Scholar]
- Iino H, Jass JR, Simms LA, et al. DNA microsatellite instability in hyperplastic polyps, serrated adenomas, and mixed polyps: a mild mutator pathway for colorectal cancer? J. Clin. Pathol. 1999;52:5–9. doi: 10.1136/jcp.52.1.5. [DOI] [PMC free article] [PubMed] [Google Scholar]
- Jackson JG, Zhang X, Yoneda T, Yee D. Regulation of breast cancer cell motility by insulin receptor substrate-2 (IRS-2) in metastatic variants of human breast cancer cell lines. Oncogene. 2001;20:7318–7325. doi: 10.1038/sj.onc.1204920. [DOI] [PubMed] [Google Scholar]
- Jass JR. Hyperplastic-like polyps as precursors of microsatellite-unstable colorectal cancer. Am. J. Clin. Pathol. 2003;119:773–775. doi: 10.1309/UYN7-0N9W-2DVN-9ART. [DOI] [PubMed] [Google Scholar]
- Kaiser S, Park YK, Franklin JL, et al. Transcriptional recapitulation and subversion of embryonic colon development by mouse colon tumor models and human colon cancer. Genome Biol. 2007;8:R131. doi: 10.1186/gb-2007-8-7-r131. [DOI] [PMC free article] [PubMed] [Google Scholar]
- Kendall J, Liu Q, Bakleh A, et al. Oncogenic cooperation and coamplification of developmental transcription factor genes in lung cancer. Proc. Natl Acad. Sci. 2007;104:16663–16668. doi: 10.1073/pnas.0708286104. [DOI] [PMC free article] [PubMed] [Google Scholar]
- Leary RJ, Lin JC, Cummins J, et al. Integrated analysis of homozygous deletions, focal amplifications, and sequence alterations in breast and colorectal cancers. Proc. Natl Acad. Sci. USA. 2008;105:16224–16229. doi: 10.1073/pnas.0808041105. [DOI] [PMC free article] [PubMed] [Google Scholar]
- Lengauer C, Kinzler KW, Vogelstein B. Genetic instabilities in human cancers. Nature. 1998;396:643–649. doi: 10.1038/25292. [DOI] [PubMed] [Google Scholar]
- Lips EH, de Graaf EJ, Tollenaar RA, et al. Single nucleotide polymorphism array analysis of chromosomal instability patterns discriminates rectal adenomas from carcinomas. J. Pathol. 2007;212:269–277. doi: 10.1002/path.2180. [DOI] [PubMed] [Google Scholar]
- Manning BD. Balancing Akt with S6K: implications for both metabolic diseases and tumorigenesis. J. Cell Biol. 2004;167:399–403. doi: 10.1083/jcb.200408161. [DOI] [PMC free article] [PubMed] [Google Scholar]
- Mardilovich K, Shaw LM. Hypoxia regulates insulin receptor substrate-2 expression to promote breast carcinoma cell survival and invasion. Cancer Res. 2009;69:8894–8901. doi: 10.1158/0008-5472.CAN-09-1152. [DOI] [PMC free article] [PubMed] [Google Scholar]
- Mardilovich K, Pankratz SL, Shaw LM. Expression and function of the insulin receptor substrate proteins in cancer. Cell Commun. Signal. 2009;7:14. doi: 10.1186/1478-811X-7-14. [DOI] [PMC free article] [PubMed] [Google Scholar]
- Martin ES, Tonon G, Sinha R, et al. Common and distinct genomic events in sporadic colorectal cancer and diverse cancer types. Cancer Res. 2007;67:10736–10743. doi: 10.1158/0008-5472.CAN-07-2742. [DOI] [PubMed] [Google Scholar]
- McCampbell AS, Harris HA, Crabtree JS, Winneker RC, Walker CL, Broaddus RR. Loss of inhibitory insulin receptor substrate-1 phosphorylation is an early event in mammalian target of rapamycin, dependent endometrial hyperplasia and carcinoma. Cancer Prev. Res. 2010;3:290–300. doi: 10.1158/1940-6207.CAPR-09-0199. [DOI] [PMC free article] [PubMed] [Google Scholar]
- McCaughan F, Darai-Ramqvist E, Bankier AT, et al. Microdissection molecular copy-number counting (microMCC)–unlocking cancer archives with digital PCR. J. Pathol. 2008;216:307–316. doi: 10.1002/path.2413. [DOI] [PubMed] [Google Scholar]
- McCaughan F, Pole JCM, Bankier AT, et al. Progressive 3q amplification consistently targets SOX2 in preinvasive squamous lung cancer. Am. J. Respir. Crit. Care Med. 2010;182:83–91. doi: 10.1164/rccm.201001-0005OC. [DOI] [PMC free article] [PubMed] [Google Scholar]
- Nowell PC. The clonal evolution of tumor cell populations. Science. 1976;194:23–28. doi: 10.1126/science.959840. [DOI] [PubMed] [Google Scholar]
- Parsons DW, Wang T, Samuels Y, et al. Colorectal cancer: mutations in a signalling pathway. Nature. 2005;436:792. doi: 10.1038/436792a. [DOI] [PubMed] [Google Scholar]
- Poulogiannis G, Ichimura K, Hamoudi RA, et al. Prognostic relevance of DNA copy number changes in colorectal cancer. J. Pathol. 2010a;220:338–347. doi: 10.1002/path.2640. [DOI] [PubMed] [Google Scholar]
- Poulogiannis G, McIntyre RE, Dimitriadi M, et al. PARK2 deletions occur frequently in sporadic colorectal cancer and accelerate adenoma development in Apc mutant mice. Proc. Natl Acad. Sci. USA. 2010b;107:15145–15150. doi: 10.1073/pnas.1009941107. [DOI] [PMC free article] [PubMed] [Google Scholar]
- Schluter K, Gassmann P, Enns A, et al. Organ-specific metastatic tumor cell adhesion and extravasation of colon carcinoma cells with different metastatic potential. Am. J. Pathol. 2006;169:1064–1073. doi: 10.2353/ajpath.2006.050566. [DOI] [PMC free article] [PubMed] [Google Scholar]
- Skrzypczak M, Goryca K, Rubel T, et al. Modeling oncogenic signaling in colon tumors by multidirectional analyses of microarray data directed for maximization of analytical reliability. PLoS ONE. 2010;5:e13091. doi: 10.1371/journal.pone.0013091. [DOI] [PMC free article] [PubMed] [Google Scholar]
- Stratton MR, Campbell PJ, Futreal PA. The cancer genome. Nature. 2009;458:719–724. doi: 10.1038/nature07943. [DOI] [PMC free article] [PubMed] [Google Scholar]
- Szabolcs M, Keniry M, Simpson L, et al. Irs2 inactivation suppresses tumor progression in Pten+/− mice. Am. J. Pathol. 2009;174:276–286. doi: 10.2353/ajpath.2009.080086. [DOI] [PMC free article] [PubMed] [Google Scholar]
- TCGA. Comprehensive molecular characterization of human colon and rectal cancer. Nature. 2012;487:330–337. doi: 10.1038/nature11252. [DOI] [PMC free article] [PubMed] [Google Scholar]
- Tonon G, Wong K-K, Maulik G, et al. High-resolution genomic profiles of human lung cancer. Proc. Natl Acad. Sci. USA. 2005;102:9625–9630. doi: 10.1073/pnas.0504126102. [DOI] [PMC free article] [PubMed] [Google Scholar]
- Wood LD, Parsons DW, Jones S, et al. The genomic landscapes of human breast and colorectal cancers. Science. 2007;318:1108–1113. doi: 10.1126/science.1145720. [DOI] [PubMed] [Google Scholar]
- Yuan TL, Cantley LC. PI3K pathway alterations in cancer: variations on a theme. Oncogene. 2008;27:5497–5510. doi: 10.1038/onc.2008.245. [DOI] [PMC free article] [PubMed] [Google Scholar]
- Zha J, O'Brien C, Savage H, et al. Molecular predictors of response to a humanized anti-insulin-like growth factor-I receptor monoclonal antibody in breast and colorectal cancer. Mol. Cancer Ther. 2009;8:2110–2121. doi: 10.1158/1535-7163.MCT-09-0381. [DOI] [PubMed] [Google Scholar]
- Zhang X, Kamaraju S, Hakuno F, et al. Motility response to insulin-like growth factor-I (IGF-I) in MCF-7 cells is associated with IRS-2 activation and integrin expression. Breast Cancer Res. Treat. 2004;83:161–170. doi: 10.1023/b:brea.0000010709.31256.c6. [DOI] [PubMed] [Google Scholar]
- Zhang X, Lin M, van Golen KL, Yoshioka K, Itoh K, Yee D. Multiple signaling pathways are activated during insulin-like growth factor-I (IGF-I) stimulated breast cancer cell migration. Breast Cancer Res. Treat. 2005;93:159–168. doi: 10.1007/s10549-005-4626-8. [DOI] [PubMed] [Google Scholar]
Associated Data
This section collects any data citations, data availability statements, or supplementary materials included in this article.
Supplementary Materials
Regions of DNA copy number alteration identified along chromosome 13 by the aCGH analysis of the second CRC series of 50 CRCs, showing the percentage of samples with gain of copy (copy number > 1.25, where normal copy = 1) against chromosomal position (NCBI36).
Confocal microscopy of IRS2-positive and negative cells.
For each marker, the sequences of the forward (Fex) and reverse (Rvs) primers are given (5′–3′).
Adhesion analysis.
Antibodies
Functional analysis.