Abstract
Objective:
To assess rhabdomyolysis-associated skeletal muscle changes induced by complete ischaemia in rabbits using MRI.
Methods:
Acute ischaemia was induced in the right hind limb of 34 New Zealand white rabbits by arterial ligation. MRI of vastus lateralis was carried out pre-operatively and every hour post-operatively up to 7 h. T1 weighted images, T2 weighted images with fat suppression, T2 maps and diffusion tensor scans were obtained. The correlation of MRI findings with histopathological changes in biopsies of vastus lateralis was examined.
Results:
Histopathology demonstrated early cellular oedema 1 h post ischaemia and irreversible injuries by 7 h, including loss of striation and broken muscle fibres. T2 weighted images with fat suppression showed inhomogeneous high signal intensity of vastus lateralis, which progressively increased from 2 h following ischaemia. The T2 relaxation rate of ischaemic vastus lateralis was significantly greater than normal muscle (p<0.001) and demonstrated a linear increase with time following ischaemia. A similar linear increase was also found in the ischaemic vastus lateralis apparent diffusion coefficient (ADC) 1–5 h post ischaemia (p=0.006). Both the T2 ADC and fractional anisotropy (FA) were significantly higher on the ischaemic side 7 h post ischaemia (for T2, p=0.02; for ADC, p=0.004).
Conclusion:
Muscle oedema is detectable on MR images and is reflected well by T2, ADC and FA values. MRI may have value in clinical evaluation of rhabdomyolysis.
Advances in knowledge:
Ischaemic changes detected by MRI may have value in the diagnosis of rhabdomyolysis.
Rhabdomyolysis is a syndrome of skeletal muscle breakdown characterised by myonecrosis and subsequent leakage of intracellular contents into the circulation. The most common causes include muscle injury, excessive exercise, drug and alcohol abuse, muscle ischaemia, heat stroke, toxins and infections [1]. Definitive diagnosis of rhabdomyolysis is predominately based on laboratory findings, which include an elevated level of serum creatine kinase (CK) and myoglobin as well as the presence of urinary myoglobin. Immediate and aggressive interventions are critical in clinical management of rhabdomyolysis; by preventing complications, such as hyperkalaemia and acute renal failure, the prognosis can be significantly improved [2].
Clinical manifestations of rhabdomyolysis vary extensively from asymptomatic to life threatening. Also, the aetiology remains elusive particularly in the early phase, posing a challenge to identify the underlying causes. Although elevation of the serum CK level is the most sensitive indicator of muscle injury, levels peak rather early and decrease rapidly after injury. When a patient is not admitted immediately, recognition and evaluation of rhabdomyolysis may become difficult. Reports suggest that over one-quarter of patients with rhabdomyolysis are not clinically diagnosed [3,4].
MRI plays an important role in the detection of skeletal muscle lesions that change muscle size, shape or signal intensity [5,6]. Review of medical records has shown that MR images can be used to effectively localise muscle lesions in rhabdomyolysis and assess extent [4,7–12]. MRI has been shown to be more sensitive for detection of rhabdomyolysis skeletal muscle lesions than ultrasonography and CT [8]. It has also been reported that MR findings in rhabdomyolysis patients correlate well with clinical symptoms and can help distinguish aetiologies [9]. Nevertheless, prospective studies of MRI for rhabdomyolysis and histopathological correlation of imaging findings remain scarce.
In this study, we describe MRI of skeletal muscle changes in a modified rabbit hind limb model of complete ischaemia and correlate findings with histopathological features of the affected muscle.
MATERIALS AND METHODS
All animal procedures were approved by the Animal Care and Use Committee of Jinan University, Guangzhou, China, and complied with the Guide for the Care and Use of Laboratory Animals from the Institute of Laboratory Animal Resources, Commission on Life Sciences, National Research Council [13].
Rabbit hind limb model of acute ischaemia
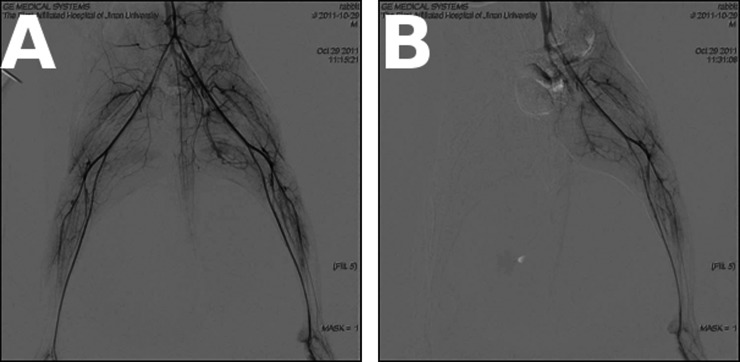
A total of 34 adult New Zealand white rabbits (15 males and 19 females, mean body weight 2769 g) were used in this study. Acute complete ischaemia was induced in the right hind limb of adult New Zealand white rabbits by arterial ligation. Briefly, the rabbit was anaesthetised by intravenous injection of 1.5% pentobarbital sodium at a dosage of 1 ml kg−1 through the ear vein. The abdomen was cut open after sterilisation to expose the lower segment of the abdominal aorta and branches just above the level of the right inguinal ligament. Arterial ligation with 3-0 sutures (CT) was performed on the right common iliac and external iliac artery, bilateral internal iliac and iliolumbar artery and right iliac artery at the level of the inguinal ligament. The tail was then ligated using 7-0 sutures (CT) to occlude the tail artery before the abdomen was closed. Occlusion of blood vessels and the absence of blood flow in the right hind limb were confirmed by digital subtraction angiography (DSA) in two rabbits (Figure 1).
Figure 1.
Digital subtraction angiography (DSA) image of the hind limb. (a) DSA showed the hind limb artery before ligation. (b) DSA showed no blood flow in right hind limb artery following ligation.
In order to avoid the influence of biopsy on the subsequent MRI, 10 rabbits were used for biopsy and 17 rabbits were used for MRI in our study.
Histopathology
To examine histopathological changes of skeletal muscle in response to acute ischaemia, a biopsy of vastus lateralis was taken from the right hind limb before and every hour after arterial ligation for up to 7 h (N=10). Sections were observed after haematoxylin and eosin staining under a light microscope (Nikon Eclipse 80i; Nikon Corporation, Tokyo, Japan). Histological characteristics of ischaemic skeletal muscle and evidence for myonecrosis were evaluated, including cellular and intercellular oedema, disruption of the cell membrane, nucleus shrinkage or fragmentation, alterations in striation bands and inflammatory infiltration.
MRI
The right hind limb of anesthetised rabbits was scanned by MRI (GE Signa 1.5 T MRI; GE Healthcare, Pollards Wood, UK) using a specialised small animal coil (7.5 cm; GE Healthcare, Pollards Wood, UK). Each animal was scanned before surgery and every hour after up to 7 h (N=17). MR sequences, including fast spin echo (FSE) T1 weighted imaging (T1WI), T2 weighted imaging with fat suppression (T2WI-fs), diffusion-weighted imaging with multiple b-values and diffusion tensor imaging (DTI) at 10 axial planes covering both hind limbs, were performed using a single-shot spin-echo planar imaging sequence. T2 maps were derived from T2WI acquired using a six-echo spin-echo sequence. Full scanning parameters are given in Table 1.
Table 1.
MRI scanning parameters
| Parameter | T1WI | T2WI-fs | T2 map | DTI | DWI |
| TR (ms) | 300 | 2000 | 1500 | 2000 | 2000 |
| TE (ms) | 12.2 | 80 | 40/80/120/160 | 100.4 | 63.5 |
| Field of view (cm) | 12×12 | 12×12 | 12×12 | 24×24 | 24×24 |
| Matrix | 256×224 | 320×224 | 256×160 | 130×128 | 130×128 |
| NEX | 4 | 4 | 4 | 4 | 8 |
| b value (s mm−2) | 0/600 | 0/600 | |||
| Encoding direction | R/L (15 tensors) | R/L | |||
| Slice thickness/gap (mm) | 4/3 | 4/3 | 4/3 | 4/3 | 4/3 |
| Time (s) | 208 | 188 | 966 | 528 | 64 |
DTI, diffusion tensor imaging; DWI, diffusion-weighted imaging; NEX, number of excitations; R/L, right/left; TE, echo time; TR, repetition time; T1WI, T1 weighted imaging; T2WI, T2 weighted imaging; T2WI-fs, T2 weighted imaging with fat suppression.
Region of interest (ROI) analysis was used for the assessment of signal changes. Three ROIs were located on images with the largest cross-sectional area of the vastus lateralis. The ROI area ranged from 15 to 19 mm2. T2, apparent diffusion coefficient (ADC) and DTI-derived maps were matched with corresponding images obtained by means of T2WI-fs to ensure adequate ROI placement and exclusion of femur or intermuscular space. Mean T2, ADC and fractional anisotropy (FA) values were recorded for three individual ROIs in ischaemic and contralateral control vastus lateralis. Mean parameter values were derived from the three ischaemic and three non-ischaemic ROIs for each time point.
Statistical analysis
Data were analysed using SPSS® v.13.0 (IBM, Chicago, IL) and all values presented as the mean±standard deviation. Comparisons between different time points were performed by repeated measures ANOVA. Comparison between the ischaemic and contralateral sides 7 h post ischaemia was analysed by paired t-test. p<0.05 was considered to be statistically significant.
RESULTS
Digital subtraction angiography
Before arterial ligation, DSA showed clear images of the lower abdominal aorta and its branches (Figure 1) in both groups of rabbits. Following ligation and establishment of ischaemia, there was no contrast visualised within the right common and external iliac, bilateral internal iliac or iliolumbar arteries. In the control left limb, all iliac and iliolumbar arteries were clearly visible before and after the surgery.
Histopathological changes of ischaemic vastus lateralis
Figure 2 shows typical histopathological findings in the ischaemic right vastus lateralis at longitudinal time points after complete ischaemia. Enlargement and swelling of muscle fibres was observed as early as 1 h post ischaemia and swelling progressed continually afterwards. Only a minimal amount of inflammatory infiltrate was present throughout the study period, and granular degeneration was found at 6 h post ischaemia. By 7 h, signs of irreversible cell damage were observed, including loss of the striation structures, torn muscle fibres, wrinkled cell membranes, cytoplasmic degeneration and central cell nuclei (Figure 2).
Figure 2.
(left) At 0 h, cells were arranged in an orderly manner and striated muscle was clear. The muscle nucleus is located around the muscle fibres (thick arrow) and interstitial fibrosis was thin (thin arrow). (right) At 7 h after ligation, the muscle fibre atrophied, the volume got smaller, and the size of the nucleus increased and the nucleus was displaced (thick arrow). Furthermore, the striated muscle was difficult to see and the interstitial fibrous tissue proliferated (thin arrow).
MRI of ischaemic vastus lateralis
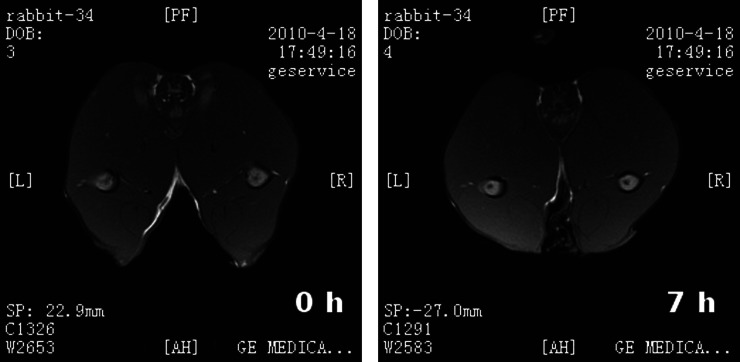
Because of missing data, five rabbits were excluded from data analysis. In the other 17 rabbits, T1WI of the ischaemic right vastus lateralis demonstrated a normal signal both before and 7 h after artery ligation (Figure 3). In contrast, an inhomogeneous increase in signal intensity on T2WI-fs was observed as early as 2 h post ischaemia, associated with expansion of the size of the right vastus lateralis. The signal intensity on T2WI-fs progressively increased with time. By 7 h post ischaemia, T2WI-fs demonstrated a high signal intensity and a slight reduction in the size of the ischaemic right vastus lateralis. Widening of the intermuscular space was also appreciated at this time point (Figure 4).
Figure 3.
T1 weighted imaging showed a normal signal both (left) before and (right) 7 h after artery ligation.
Figure 4.
T2 weighted imaging showed progressively increasing signal intensity in the right vastus lateralis muscle following ischaemia, suggesting muscle oedema.
T2 maps
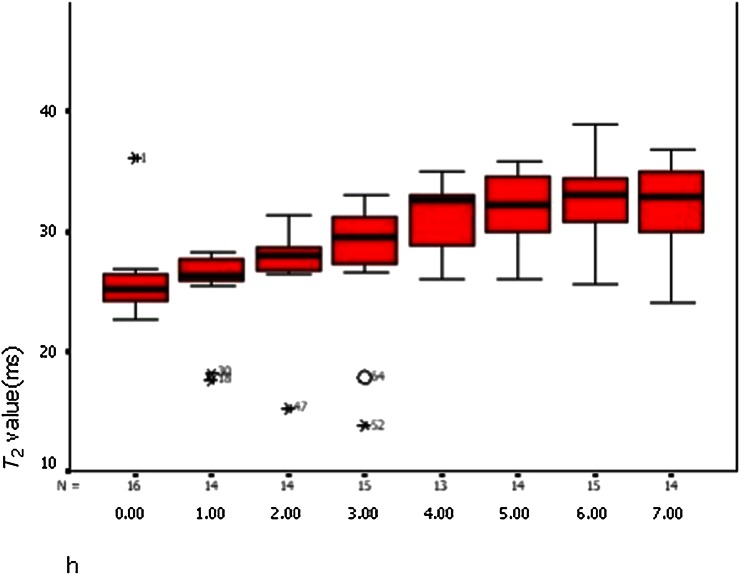
T2 relaxation rates for ischaemic and non-ischaemic vastus lateralis are summarised in Table 2. There was no significant change in T2 values on the non-ischaemic left side but a significant increase over time on the right side (p<0.001, repeated measure ANOVA). The mean T2 relaxation time of the ischaemic right vastus lateralis was significantly greater than the left side at 7 h post ischaemia (right, 31.37±4.58 ms; left, 26.39±3.74 ms; p=0.02, paired t-test). There was a linear increase in the T2 value of the ischaemic vastus lateralis with time post ischaemia (r=0.575, p<0.001, r2=0.331; Figure 5).
Table 2.
T2 values of each vastus lateralis
| Time (h) | T2 value (ischaemic, ms) | T2 value (non-ischaemic, ms) |
| 0 | 25.96±3.64 | 26.42±3.61 |
| 1 | 26.08±2.98 | 25.23±1.40 |
| 2 | 28.05±1.47 | 25.88±3.37 |
| 3 | 28.19±5.19 | 24.70±3.24 |
| 4 | 30.91±2.88 | 26.39±3.49 |
| 5 | 31.73±3.32 | 26.65±3.71 |
| 6 | 32.17±3.87 | 26.36±3.35 |
| 7 | 31.37±4.58 | 26.39±3.74 |
p<0.001; repeated measure ANOVA. The T2 value was the most significantly different at 6 h after ischaemia.
Figure 5.
The T2 value of the right vastus lateralis showed a linear increase (linear regression analysis, p=0.001).
Diffusion tensor imaging
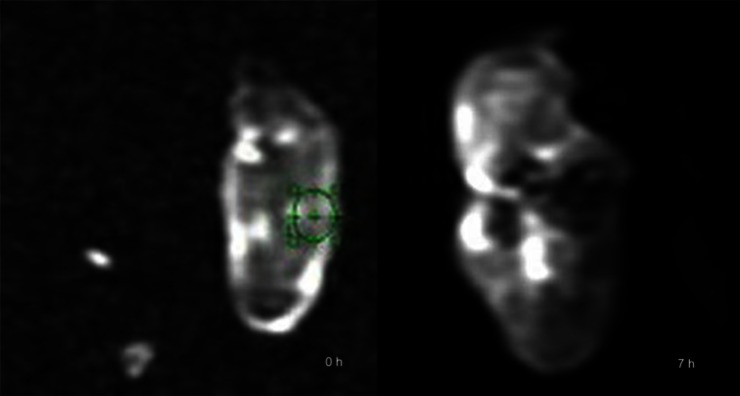
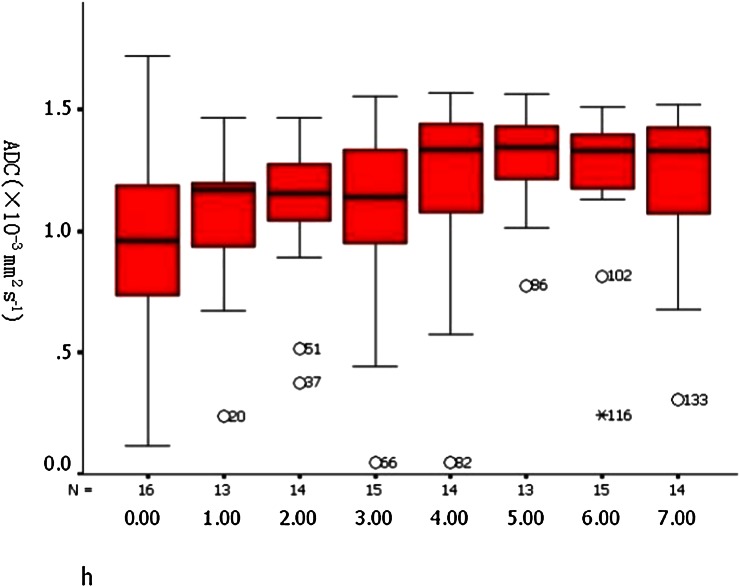
ADC and FA data for ischaemic and non-ischaemic vastus lateralis are summarised in Table 3. The mean ADC was significantly higher in the ischaemic muscle at 7 h post ischaemia (Figure 6) (right, 1.25±0.27×10⁻⁹ mm2 s−1; left, 0.98±0.38×10⁻⁹ mm2 s−1; p=0.004, paired t-test). The mean ADC value of ischaemic vastus lateralis increased linearly with time post ischaema (r=0.258, p=0.006, r²=0.067; Figure 7). Compared with the non-ischaemic side, the FA value of the ischaemic side was significantly lower at 3 h after the ischaemia (right, 0.17±0.03; left, 0.28±0.05; p<0.001, paired t-test) and decreased linearly with time (r=0.889, p<0.001, r²=0.785; Figure 8).
Table 3.
Apparent diffusion coefficient (ADC) and fractional anisotropy (FA) values of each vastus lateralis
| Time (h) | ADC value (×10−3 mm2 s−1) |
FA value (×10−3 mm2 s−1) |
||
| Ischaemic | Non-ischaemic | Ischaemic | Non-ischaemic | |
| 0 | 1.02±0.43 | 0.97±0.41 | 0.28±0.03 | 0.28±0.03 |
| 1 | 1.06±0.33 | 1.00±0.35 | 0.26±0.02 | 0.27±0.03 |
| 2 | 1.11±0.29 | 0.96±0.37 | 0.24±0.02 | 0.28±0.02 |
| 3 | 1.13±0.30 | 0.96±0.39 | 0.22±0.02 | 0.29±0.04 |
| 4 | 1.24±0.28 | 1.03±0.38 | 0.20±0.01 | 0.27±0.01 |
| 5 | 1.27±0.22 | 1.00±0.37 | 0.19±0.01 | 0.28±0.03 |
| 6 | 1.28±0.20 | 1.01±0.35 | 0.18±0.01 | 0.28±0.02 |
| 7 | 1.25±0.27 | 0.98±0.38 | 0.17±0.03 | 0.28±0.03 |
Figure 6.
Diffusion-weighted imaging (b=600) showed the process of signal changes after artery ligation, suggesting that water diffusion in skeletal muscle was changed. (left) 0h; (right) 7h.
Figure 7.
Apparent diffusion coefficient values of the right vastus lateralis showed a linear increase (linear regression analysis, p=0.006).
Figure 8.
Fractional anisotropy (FA) values decreased linearly over time after ischaemia (linear regression analysis, p<0.001).
Diffusion-weighted imaging
Mean ADC values derived from b/800 for each time point are summarised in Table 4. There was a statistical difference in the ADC values between both sides of the hind limb (right, 1.49±0.13×10⁻³ mm2 s−1; left, 1.35±0.05×10⁻³ mm2 s−1; p<0.01).
Table 4.
Apparent diffusion coefficient (ADC) values of each vastus lateralis
| b value | ADC value (ischaemic, ×10−3 mm2 s−1) | ADC value (non-ischaemic, ×10−3 mm2 s−1) |
| 800 | 1.49±0.13 | 1.35±0.05 |
p<0.01.
DISCUSSION
Persistent muscle ischaemia may lead to necrosis of muscle cells by depriving the oxygen supply and adenosine triphosphate production [14]. Rhabdomyolysis can be caused by ischaemia of skeletal muscle resulting from local or systemic conditions including thrombosis, compartment syndrome, clamping of vessels during surgery and hypotension [15–18]. In our experiment, we modified the pre-clinical hind limb ischaemia model described by Pu et al [19] to induce complete ischaemia and myonecrosis in the right hind limb of rabbits. Instead of distal ligation of the external iliac artery and its branches below the level of the inguinal ligament and excision of the femoral artery, we performed more proximal arterial ligation including the right common iliac and right external iliac artery, the bilateral internal iliac and iliolumbar artery and the right iliac artery at the level of the inguinal ligament. The tail artery was also occluded. One major concern regarding the ligation methodology is collateral circulation and the compensatory mechanism of endogenous angiogenesis [20]. However, our study focused on acute limb ischaemia only and DSA images confirmed devascularisation of the right hind limb and found no evidence of any collateral circulation within the experimental period.
The extent of skeletal muscle necrosis in complete ischaemia increases with the length of ischaemic period [21]. Using an isolated muscle model, Kuzon et al [22] concluded that 7 h of ischaemia caused irreversible muscle damage. Harris et al [14], using a gracilis model, reported that muscle necrosis occurred after 4 h and became extensive by 7 h. Consistently, in our model, oedema of ischaemic muscle fibres occurred almost immediately after complete ischaemia and progressed over time. Irreversible injury, including loss of striated structures and disrupted integrity of the cell membrane, was observed at approximately 7 h post ischemia. These histopathological features correspond to those of rhabdomyolysis which typically involves muscle oedema in the earliest stages and then myonecrosis.
Our main MRI findings were inhomogeneous hyperintensity of T2WI-fs signal and increased T2 values in the ischaemic muscle. T2 images reflect mobile water content and the hyperintensity of the T2WI-fs signal in ischaemic muscle is most likely to represent muscle oedema. Indeed, histopathology of muscle biopsies confirmed swollen muscle fibres with the minimal presence of inflammatory cells. These results are consistent with previous studies in which hyperintensity of T2WI has been reported in rhabdomyolysis patients [7,9] and experimental myonecrosis models [23]. In our experiment, ischaemic muscle T2 values peaked 6 h post ischaemia but reduced in the following hour. Considering that irreversible tissue damage occurred by 7 h in histopathology, the decrease in T2 value may be an indicator of muscle fibre breakdown and subsequent release of intracellular content.
The ADC represents diffusivity of water molecules in a tissue and can be affected by factors such as the viscosity of extracellular water and cell membrane permeability. Also, changes in ADC value have been shown to be associated with altered cell size [24,25]. In skeletal muscle, the diffusion of water mostly reflects the intracellular space. Therefore, an increased ADC value usually indicates swelling of muscle cells [26]. This seems to be the case in our study as the results showed a linear increase in ADC values in the affected muscle of the acute ischaemia model. This increase correlated well with the progressive oedema revealed by histopathology. ADC values plateaued after 5 h, matching the time points when granular degeneration and cell necrosis started to occur and possibly representing the peak muscle oedema shortly before myonecrosis and muscle cell breakdown.
The MRI findings in our study are not truly specific in nature and similar to those observed in many other skeletal muscle lesions. Lu et al [27] have reported distinct MRI features in rhabdomyolysis patients and identified heterogeneously high T2 signals, which they have attributed to the distribution pattern of myonecrosis. We did not observe the same in our study, possibly because irreversible injuries and cell necrosis were rather limited in the acute phase.
In the study by Loerakker et al [27] using MRI in rat models of hind limb ischaemia, MRI features of muscle differed within an individual animal at the same scanning level, possibly indicating different tolerances to ischaemia of different muscles. We observed a similar phenomenon and hence both the ROI analysis and the biopsy were obtained in the vastus lateralis muscle [28].
In summary, we have characterised MRI findings and histopathological changes in a rabbit hind limb model of complete ischaemia and demonstrated that MR images are sensitive to early tissue oedema and myonecrosis.
References
- 1.Visweswaran P, Guntupalli J. Rhabdomyolysis. Crit Care Clin 1999;15:415–28 [DOI] [PubMed] [Google Scholar]
- 2.Khan FY. Rhabdomyolysis: a review of the literature. Neth J Med 2009;67:272–83 [PubMed] [Google Scholar]
- 3.Thomas MA, Ibels LS. Rhabdomyolysis and acute renal failure. Aust N Z J Med 1985;15:623–8 [PubMed] [Google Scholar]
- 4.Nakahara K, Tanaka H, Masutani K, Yanagida T, Kashiwagi M, Mizumasa T, et al. The value of computed tomography and magnetic resonance imaging to diagnose rhabdomyolysis in acute renal failure. Nephrol Dial Transplant 1999;14:1564–7 [DOI] [PubMed] [Google Scholar]
- 5.Révelon G, Rahmouni A, Jazaerli N, Godeau B, Chosidow O, Authier J, et al. Acute swelling of the limbs: magnetic resonance pictorial review of fascial and muscle signal changes. Eur J Radiol 1999;30:11–21 [DOI] [PubMed] [Google Scholar]
- 6.May DA, Disler DG, Jones EA, Balkissoon AA, Manaster BJ. Abnormal signal intensity in skeletal muscle at MR imaging: patterns, pearls, and pitfalls. Radiographics 2000;20:295–315 [DOI] [PubMed] [Google Scholar]
- 7.Zagoria RJ, Karstaedt N, Koubek TD. MR imaging of rhabdomyolysis. J Comput Assist Tomogr 1986;10:268–70 [DOI] [PubMed] [Google Scholar]
- 8.Lamminen AE, Hekali PE, Tiula E, Suramo I, Korhola OA. Acute rhabdomyolysis: evaluation with magnetic resonance imaging compared with computed tomography and ultrasonography. Br J Radiol 1989;62:326–30 [DOI] [PubMed] [Google Scholar]
- 9.Shintani S, Shiigai T. Repeat MRI in acute rhabdomyolysis: correlation with clinicopathological findings. J Comput Assist Tomogr 1993;17:786–91 [DOI] [PubMed] [Google Scholar]
- 10.Stock KW, Helwig A. MRI of acute exertional rhabdomyolysis in the paraspinal compartment. J Comput Assist Tomogr 1996;20:834–6 [DOI] [PubMed] [Google Scholar]
- 11.Kakuda W, Naritomi H, Miyashita K, Kinugawa H. Rhabdomyolysis lesions showing magnetic resonance contrast enhancement. J Neuroimaging 1999;9:182–4 [DOI] [PubMed] [Google Scholar]
- 12.Moratalla MB, Braun P, Fornas GM. Importance of MRI in the diagnosis and treatment of rhabdomyolysis. Eur J Radiol 2008;65:311–15 doi: 10.1016/j.ejrad.2007.03.033 [DOI] [PubMed] [Google Scholar]
- 13.National Committee on Science Education Standards and Assessment, National Research Council. Guide for the care and use of Derrell Clark. Laboratory animals from the Institute of Laboratory Animal Resources. National science education standards Washington, DC: National Academy Press; 1996 [Google Scholar]
- 14.Harris K, Walker PM, Mickle DA, Harding R, Gatley R, Wilson GJ, et al. Metabolic response of skeletal muscle to ischemia. Am J Physiol 1986;250:H213–20 [DOI] [PubMed] [Google Scholar]
- 15.Taylor DC, Salvian AJ, Shackleton CR. Crush syndrome complicating pneumatic antishock garment (PASG) use. Injury 1988;19:43–4 [DOI] [PubMed] [Google Scholar]
- 16.Williams JE, Jr, Tucker DB, Read JM., 3rd Rhabdomyolysis-myoglobinurea: consequences of prolonged tourniquet. J Foot Surg 1983;22:52–6 [PubMed] [Google Scholar]
- 17.Adiseshiah M, Round JM, Jones DA. Reperfusion injury in skeletal muscle: a prospective study in patients with acute limb ischaemia and claudicants treated by revascularization. Br J Surg 1992;79:1026–9 [DOI] [PubMed] [Google Scholar]
- 18.Slater MS, Mullins RJ. Rhabdomyolysis and myoglobinuric renal failure in trauma and surgical patients: a review. J Am Coll Surg 1998;186:693–716 [DOI] [PubMed] [Google Scholar]
- 19.Pu LQ, Jackson S, Lachapelle KJ, Arekat Z, Graham AM, Lisbona R, et al. A persistent hindlimb ischemia model in the rabbit. J Invest Surg 1994;7:49–60 [DOI] [PubMed] [Google Scholar]
- 20.Waters RE, Terjung RL, Peters KG, Annex BH. Preclinical models of human peripheral arterial occlusive disease: implications for investigation of therapeutic agents. J Appl Physiol 2004;97:773–80 doi: 10.1152/japplphysiol.00107.2004 [DOI] [PubMed] [Google Scholar]
- 21.Labbe R, Lindsay T, Walker PM. The extent and distribution of skeletal muscle necrosis after graded periods of complete ischemia. J Vasc Surg 1987;6:152–7 doi: 10.1067/mva.1987.avs0060152 [DOI] [PubMed] [Google Scholar]
- 22.Kuzon WM, Jr, Walker PM, Mickle DA, Harris KA, Pynn BR, McKee NH. An isolated skeletal muscle model suitable for acute ischemia studies. J Surg Res 1986;41:24–32 [DOI] [PubMed] [Google Scholar]
- 23.Mattila KT, Lukka R, Hurme T, Komu M, Alanen A, Kalimo H. Magnetic resonance imaging and magnetization transfer in experimental myonecrosis in the rat. Magn Reson Med 1995;33:185–92 [DOI] [PubMed] [Google Scholar]
- 24.Anderson AW, Xie J, Pizzonia J, Bronen RA, Spencer DD, Gore JC. Effects of cell volume fraction changes on apparent diffusion in human cells. Magn Reson Imaging 2000;18:689–95 [DOI] [PubMed] [Google Scholar]
- 25.Beaulieu C. The basis of anisotropic water diffusion in the nervous system: a technical review. NMR Biomed 2002;15:435–55 doi: 10.1002/nbm.782 [DOI] [PubMed] [Google Scholar]
- 26.Damon BM, Ding Z, Anderson AW, Freyer AS, Gore JC. Validation of diffusion tensor MRI based muscle fiber tracking. Magn Reson Med 2002;48:97–104 doi: 10.1002/mrm.10198 [DOI] [PubMed] [Google Scholar]
- 27.Lu CH, Tsang YM, Yu CW, Wu MZ, Hsu CY, Shih TT. Rhabdomyolysis: magnetic resonance imaging and computed tomography findings. J Comput Assist Tomogr 2007;31:368–74 doi: 10.1097/01.rct.0000250115.10457.e9 [DOI] [PubMed] [Google Scholar]
- 28.Loerakker S, Oomens CWJ, Manders E, Schakel T, Bader DL, Baaijens T, et al. Ischemia-reperfusion injury in rat skeletal muscle assessed with T2-weighted and dynamic contrast-enhanced MRI. Magn Reson Med 2011;66:528–37 doi: 10.1002/mrm.22801 [DOI] [PubMed] [Google Scholar]


