

Abstract
Small molecule modulators of protein activity have proven invaluable in the study of protein function and regulation. While inhibitors of protein activity are relatively common, small molecules that can increase protein abundance are rare. Small molecule protein upregulators with targeted activities would be of value in the study of the mechanisms underlying loss-of-function diseases. We developed a high-throughput screening approach to identify small molecule upregulators of the Survival of Motor Neuron protein (SMN), whose decreased levels cause the neurodegenerative disease Spinal Muscular Atrophy (SMA). We screened 69,189 compounds for SMN upregulators and performed mechanistic studies on the most active compound, a bromobenzophenone analog designated cuspin-1. Mechanistic studies of cuspin-1 revealed that increasing Ras signaling upregulates SMN protein abundance via an increase in translation rate. These findings suggest that controlled modulation of the Ras signaling pathway may benefit patients with SMA.
INTRODUCTION
Bioactive small molecules have enabled major advances in biological research and drug development. Although many efforts have focused on the identification of small molecule inhibitors of protein function, the ability to upregulate protein abundance or otherwise increase protein activity can provide complementary insights that cannot be obtained through loss of function studies alone (1). Although the number of compounds known to function as protein upregulators is small, they have important research and therapeutic applications. Examples include histone deacetylase inhibitors, used in the treatment of psychiatric conditions, neurologic disorders and cutaneous T cell lymphoma (2–4), and proteasome inhibitors, used in the treatment of multiple myeloma (5) and for the study of the ubiquitin-proteasome system and its targets (6).
Unfortunately, existing upregulating compounds lack specificity, altering the levels of hundreds to thousands of gene products (7). Such broad spectrum effects, in addition to potentially being therapeutically undesirable, make these compounds unsuitable for investigations of mechanisms regulating the abundance of an individual or limited number of proteins. Small molecules that can upregulate specific protein targets are needed, and would be especially advantageous for the study of loss of function diseases. However, we lack systematic methods for identifying such compounds.
In order to address this need, we developed a high-throughput screening approach to identify small molecule upregulators of a specific protein. This assay detects increases in the abundance of a target protein after treatment with small molecules. We selected the Survival Motor Neuron (SMN) protein as a target for modulation. Decreased SMN protein levels result in the loss of function neurodegenerative disease Spinal Muscular Atrophy (SMA). In SMA patients, SMN protein levels are decreased to ~10% of normal levels, due to homozygous deletion of the survival of motor neuron 1 (smn1) gene, but retention of the smn2 gene. The smn2 gene is nearly identical to smn1, but contains a translationally silent C to T transition which causes the smn2 pre-mRNA to be aberrantly spliced, generating only ~10% of the full-length, functional protein produced by the smn1 gene (8). This small amount of SMN protein prevents the embryonic lethality seen in an SMN null background (9), but cannot prevent the motor neuron degeneration observed in SMA. Small molecule upregulators of SMN could provide novel insights into the regulation of SMN protein levels, leading the way to new the rapeutic targets. A relevant example is the screen for SMN upregulating compounds performed by Makhortova, et. al, which identified the RTK-PI3K-AKT-GSK-3 signaling cascade as an important modulator of SMN protein stability (10).
We developed an assay for detecting increased SMN protein abundance and screened 69,189 small molecules. We discovered three SMN-upregulating compounds. Mechanistic investigations of the most effective compound, Chemical Upregulator of SMN Protein-1 (cuspin-1), revealed that increasing Ras signaling upregulates SMN protein levels by enhancing the rate of SMN translation.
RESULTS AND DISCUSSION
Development of a high-throughput screen that detects endogenous SMN protein abundance
In order to identify compounds upregulating SMN protein levels, we developed a high-throughput screen for monitoring the levels of endogenous SMN protein in SMA patient fibroblast cells. Previous screens searching for SMN-upregulating compounds focused on altering either the transcription or splicing of smn2 (11, 12). Our screen focuses on the desired final product, SMN protein abundance, in order to be inclusive of all aspects of SMN protein regulation, from transcription through degradation. This method permits identification of small molecule upregulators of SMN protein without bias towards their mechanism of action.
To quantify SMN protein levels in a 384-well format, the cytoblot assay (13), a modified enzyme-linked immunosorbent assay (ELISA), was optimized for microtiter-based screening using SMA patient fibroblasts. A schematic of the primary screening workflow is shown in Figure 1A. The optimized assay protocol involved the seeding of cells and subsequent treatment with small molecules for 48 hours. This incubation period was selected to allow sufficient time for the compounds to increase SMN protein levels, while limiting the depletion of nutrients and accumulation of toxins in the microtiter format during prolonged incubation (14). After incubation, cells were fixed, permeabilized and incubated with primary and secondary antibodies in-plate. Horseradish-peroxidase-derived chemiluminescence was detected using an automated platereader. The optimized SMN cytoblot is a suitably robust format for detecting SMN levels in cells, as indicated by a Z’ factor (15) of 0.35-0.5 in the optimized assay, using the #3814 SMA carrier cell line as a positive control.
Figure 1.

High-throughput screen (HTS) and hit compound cuspin-1. a) Schematic of HTS assay for SMN protein upregulators. b) Structure of cuspin-1, the optimal SMN-upregulating small molecule discovered in our screen. c) Cytoblot dose-response curve for cuspin-1 in #9677 SMA patient fibroblast cells treated for 48 hours. The data represent the average of triplicates ± SEM. RLU: relative luminescence units. P-values were calculated using two-tailed t-test. (* = p<0.01, ** = p<0.001) d) Western blot analysis of SMN and actin in #9677 cells treated with indicated concentrations of cuspin-1 for 48 hours. Fold increase of SMN to actin ratio normalized to non-treated control (NT) is graphed below. Data represent average of duplicates ± standard deviation.
Small molecule libraries and in silico filtering for blood-brain barrier penetrating small molecule libraries
We screened compounds from two libraries that we assembled in our laboratory. The first was our previously reported small molecule library (16), described in Materials and Methods. The second library was composed of compounds specifically chosen for their predicted ability to cross the blood-brain barrier (BBB), as the development of CNS-active compounds is impeded by the inability of a large portion of compounds to penetrate the BBB. We addressed both BBB-penetration and toxicity issues during the selection of small molecules for our library by in silico filtering for compounds likely to be BBB-penetrant and filtering out known toxic and reactive species, thus increasing the ultimate therapeutic potential of this “BBB library”.
To predict the BBB penetration potential of each compound, we utilized the logarithm of brain to blood partitioning ratio (logBB). We used a training set of 109 compounds with experimentally determined logBB values (17) in creating a logBB predictor based on simple physicochemical descriptors, such as logP (the octanol to water partitioning coefficient of a compound). The compound set was split into two sets, one with 73 compounds for creating a predictor, and one with 36 compounds for validation. Partial least-squares regression was used to correlate experimental logBB values of the training set with physicochemical descriptors. Our choice of descriptors was influenced by the planned use of the logBB predictor, as we needed it to be able to evaluate millions of candidate compounds with relatively little computational expense. For this reason, we avoided the use of semi-empirical energy terms and instead chose to use descriptors that were calculated using the atomic contribution model. This approach, pioneered by Wildman and Crippen (18), uses a statistical dataset of known atoms and functional groups to predict the groups’ contribution to molecular descriptors. The descriptors in the model were made up of the number of rotatable bonds, Van der Waals surface area, molar refractivity, number of nitrogen atoms and logarithm of the octanol-water partition coefficient (logP). To enable better sampling of these descriptors, we calculated logP and Van der Waals descriptors multiple times with different weights (Supplementary Table S1). The obtained model gave R2=0.82 for the training set and R2= 0.70 for the validation set. The predictions gave no false negatives (Supplementary Figure 1).
Screening and hit validation
A total of 69,189 small molecules were screened in the SMN cytoblot assay. Primary screening was performed in triplicate in #9677 SMA patient fibroblast cells in 384-well format. To remain inclusive of compounds with moderate efficacy, a ‘hit’ was defined as having a median signal greater than two standard deviation from the median of the untreated wells. The 1,106 compounds passing hit criteria in the primary screen were retested in dose-response series in three SMA patient fibroblast lines (#232, #3813 and #9677). The 105 candidates showing dose-response activity in at least two cell lines were tested by Western blot. Three structurally distinct compounds were found to significantly increase endogenous SMN protein levels (Figure 1B,C and Supplementary Figure 2). The EC50 values for the three scaffolds were in the range of 10-20 μM, typical for hits from high-throughput, cell-based screens. A summary of the screen can be found in Supplementary Table S2.
We focused on the most robust of these three hits, a bromobenzophenone analog we designated cuspin-1 (Chemical Upregulator of SMN Protein-1, Figure 1B), whose identity was confirmed by proton NMR (Supplementary Figure 3). Cuspin-1 showed strong activity in the plate-based dose response assay (Figure 1C) and increased SMN levels by 50% compared to DMSO-treated controls at 5 μg/mL (18 μM) in SMA patient fibroblast cells (Figure 1D). As the 9677 SMA patient cell line expresses approximately one-fourth of the SMN protein expressed by the 3814 carrier cell line (19), a 50% increase in SMN protein levels is modest but of interest. Toxicity was observed at concentrations at or above 80 μg/mL (720 μM), providing a robust effective concentration (EC) to lethal concentration (LC) ratio for cell culture studies. It has proven challenging to find small molecules that significantly upregulate endogenous SMN protein levels (20). Thus, cuspin-1, despite its modest overall effect, was selected as a suitable probe for further characterization as it showed moderate activity and low cellular toxicity.
The ability of cuspin-1 to upregulate SMN protein levels in diverse genetic backgrounds was tested in a panel of cell lines, including wild-type and SMA human and rodent cells (Supplementary Table S3). Although cuspin-1 was active in the majority of human cell lines, it was inactive in the rodent lines tested, suggesting that its target or mechanism may not be conserved across species.
Structure-activity relationship of cuspin-1
To evaluate the features necessary for the activity of cuspin-1, a structure-activity relationship (SAR) analysis was undertaken through analog synthesis and testing. Although few structural analogs were commercially available (Figure 2A), one highly similar analog (5-bromo-3-pyridinyl)(4-ethylphenyl)-methanone, designated cuspin-2, increased SMN protein abundance to comparable levels as cuspin-1. Although cuspin-2 was active, it did not improve upon the potency or efficacy of cuspin-1. All other cuspin-1 analogs that we synthesized, including analogs lacking the either the bromine, nitrogen or methyl group, were inactive (Figure 2B,C). Additionally, while cuspin-2 demonstrated that extension of the methyl to an ethyl group retained activity, extension to a propyl group rendered the compound inactive, indicating a possible steric clash with cuspin-1’s target. As modifications to the cuspin-1 scaffold generally resulted in loss of activity, further work is required to identify modifications that would improve the potency and efficacy of the compound, prior to testing in SMA mouse models. However, the current cuspin-1 scaffold represents a valuable tool for the study of SMN regulation.
Figure 2.

Structure-activity relationship of cuspin-1. a) Structures and activities of the highest similarity commercially-sourced cuspin-1 analogs. b) Friedel-Crafts acylation scheme for synthesis of cuspin-1. The same synthetic scheme was utilized for synthesis of cuspin-1 analogs. c) Structures and activities of analogs synthesized.
Cuspin-1 reveals link between Ras signaling and SMN protein levels
During our efforts to identify the mechanism of action of cuspin-1 we utilized phospho-specific antibodies to determine whether any common signaling pathways were activated by cuspin-1 treatment. We observed that treatment with cuspin-1 increased phosphorylation of extracellular signal-related kinase (Erk), while proteins involved in other signaling pathways, such as Akt, were not activated (Figure 3A). As the canonical pathway resulting in phosphorylation of Erk (p-Erk) is the Ras-Raf-MEK signaling cascade (21), we endeavored to determine whether increased Ras signaling could be the downstream event responsible for the cuspin-1 mediated upregulation of SMN protein levels. We increased Ras signaling in #3813 SMA patient fibroblast cells by expression of a constitutively active form of Ras (NRasG12D). NRasG12D expression resulted in a 2.7-fold increase in SMN protein level compared to vector alone (Figure 3B), demonstrating that direct activation of the Ras signaling pathway was able to strongly increase SMN protein levels. The 5-fold increase in p-Erk in the NRasG12D expressing cells confirmed that Ras signaling was elevated in these cells. Similar increases in SMN and p-Erk levels were observed in #9677 and #232 SMA patient fibroblasts, indicating this effect of NRasG12D is not unique to one SMA patient cell line (data not shown).
Figure 3.

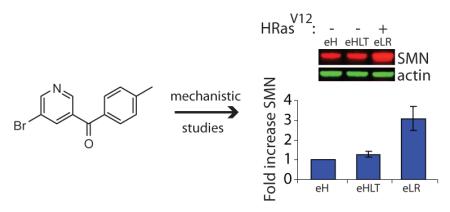
Increased Ras signaling upregulates SMN protein abundance. a) Western blot analysis of #9677 cells treated with 10μg/ml cuspin-1, harvested at indicated time points and blotted for p-Erk, total Erk, p-Akt, total Akt and tubulin. Graph shows quantification of phospho-protein to respective total protein ratios, normalized to tubulin as loading control. Data represents the average of duplicates ± standard deviation. b) Western blot analysis for NRas, p-Erk, SMN and tubulin in #3813 SMA patient fibroblast cells transduced with either empty vector or constitutively active NRasG12D viral plasmid. Graph shows fold increase of SMN compared to vector-only control, normalized to tubulin as loading control. c) Comparison of the engineered tumor cell line BJeLR (eLR), expressing HRasV12, versus the parental line (eH) and the isogenic line BJeHLT (eHLT) which contains all genes ectopically expressed in BJeLR with the exception of HRasV12. Samples were blotted for SMN and several control proteins. Graph shows the fold increase of SMN in BJeHLT and BJeLR compared to BJeH, normalized to actin as loading control. Data represent average of duplicates ± standard deviation.
At this stage, cuspin-1’s utility as a probe was overshadowed by the more powerful effect of direct Ras activation on SMN protein levels. Therefore, we chose to continue characterizing the effect using constitutively active Ras rather than cuspin-1. However, further experiments investigating the effect of activated Ras on SMN protein levels could not be performed in the SMA patient cell lines, as non-transformed cells senesce shortly after introduction of oncogenic Ras (21). Therefore, we utilized the tumorigenic HRasV12 expressing BJeLR cell line for subsequent experiments. The G12V mutation in the HRasV12 protein is functionally equivalent to the G12D mutation used previously, as they both inactivate GTPase activity, rendering the proteins constitutively active. BJeLR cells are an engineered cell line created by sequential introduction of viral and mammalian genetic elements into parental BJeH human foreskin fibroblasts (22). The BJeHLT cell line contains all genetic elements found in the BJeLR cell line, with the exception of HRasV12. Comparison of SMN protein levels in the BJ cell lines demonstrated a 3-fold increase in SMN protein in the BJeLR cell line compared to the parental cell line, BJeH (Figure 3C). The lack of increase in SMN in the BJeHLT cell line indicates that activated Ras is the sole genetic element responsible for upregulation of SMN protein abundance in this cell line (Figure 3C). This upregulation in SMN protein could be the result of either global upregulation of protein levels or via a more specific mechanism. To exclude the possibility that the observed effect on SMN protein levels was due to a non-specific mechanism, the levels of several control proteins were examined by Western blot. These proteins are involved in diverse cellular processes, including glucose metabolism (GAPDH), the cytoskeleton (actin), translation (eIF4E), and cell death (Smac). The abundance of these proteins remained unaltered by oncogenic Ras expression (Figure 3C), indicating a level of specificity to Ras-mediated SMN upregulation. In hindsight, it is perhaps not so surprising that a pro-growth factor such as Ras would upregulate SMN, a protein vital for the splicing of mRNAs, as cellular growth would require this process. Although activating Ras signaling likely increases the levels of other pro-growth proteins in addition to SMN in these cell lines, at this stage we are more interested in the mechanism by which Ras increases SMN protein levels, rather than identifying the other proteins affected. As increasing Ras signaling would be therapeutically undesirable, due to the likelihood of tumorigenesis, the specificity of its effect is not clinically relevant.
Mechanistic studies
To investigate the mechanism underlying SMN protein upregulation by activated Ras, we utilized the BJ cell lines to determine the cellular process through which Ras exerts its effect on SMN protein levels. First, we tested whether alterations in transcription or splicing of smn mRNA were responsible for the increase in SMN protein abundance. The BJeLR (+HRasV12) cell line did not show increased levels of either full-length or Δ7 smn mRNA, nor did it have an altered ratio of the spliced isoforms, as compared to the parental line BJeH (−HRasV12) (Figure 4A). This lack of increase in smn mRNA levels suggests that the upregulation of SMN protein levels was not due to activation of p38 mitogen-activated kinase, a Ras effector protein, which was recently shown to upregulate SMN protein levels via stabilization of smn mRNA (23). Unexpectedly, the BJeLR line showed consistently lower levels of smn mRNAs than the BJeH parental line. This could be due to a feedback mechanism downregulating smn transcripts in response to strongly elevated SMN protein levels.
Figure 4.

Increased Ras signaling enhances SMN translation rate. a) Quantification of RT-qPCR of full-length (smnFL) and exon 7-deleted (smnΔ7) smn mRNA levels from total RNA harvested from BJeH (−HRasV12) and BJeLR (+HRasV12) cells. Transcript cycle times were normalized to hprt to control for total mRNA. Data represent average of triplicates ± standard deviation. b) Western blot analysis of SMN and actin in BJeH (−HRasV12) and BJeLR (+HRasV12) cells treated with the protein synthesis inhibitor cycloheximide (CHX [10μM]) for indicated times. Quantification of average of duplicates of SMN to actin ratio normalized to respective untreated control (0h) is shown below each lane. c) Phosphorimager bands and quantification of translation rate analysis of SMN, quantified as SMN to actin ratio normalized to BJeH (−HRasV12) cells. Data represent mean ± standard deviation. P-values were calculated using two-tailed t-test. (* = p<0.01) d) Phosphorimager lanes showing total 35S protein labeling in treated and untreated samples.
Next, we examined the effect of increased Ras signaling on SMN turnover. Cycloheximide (CHX), a protein synthesis inhibitor, was used to inhibit the translation of nascent SMN peptides in order to quantify the half-life of SMN. The half-life of SMN in the BJ cell lines was ~3 hours, similar to previous reports (24, 25). The degradation rate of SMN protein remained unchanged in the HRasV12-expressing cells, indicating that increased Ras signaling does not affect the rate of SMN degradation (Figure 4B).
Having ruled out alterations in transcription, splicing and turnover, we tested whether HRasV12 affected the translation rate of SMN. A translation rate assay, using radioactive 35S-methionine and cysteine to label newly synthesized protein with subsequent immunoprecipitation of proteins of interest, was performed to quantify the translation rate of SMN. HRasV12-expressing cells showed a significant 2.5-fold increase (p<0.01) in the rate of SMN translation compared to parental cells (Figure 4C). No differences were observed in the total amount of label incorporated in each cell line (Figure 4D), indicating the increased translation rate of SMN protein is not due to a global increase in translation. As we do not consider utilization of CA-Ras as a therapeutic option, we are not concerned with the specificity of the effect of Ras activation. Rather, we are excited to discover such a robust effect on SMN protein levels via an unexpected pathway. Future work determining the cellular components downstream of Ras directly responsible for affecting the translation rate of SMN may identify therapeutic targets of interest for SMA, at which stage the specificity of the effect will be of paramount importance.
In this work, we describe the development of a high-throughput screen for identification of small molecule upregulators of the SMN protein and identify three novel SMN-upregulating compounds. Mechanistic studies of cuspin-1 led to the discovery that Ras signaling regulates SMN protein abundance at the level of translational regulation. In addition to the novel SMN regulatory pathway identified, this study provides a proof of principle that mechanistically unbiased screens can uncover unexpected connections between cellular pathways and provide novel small molecule tools for the study of biological processes.
Small molecule upregulators of protein abundance are an under-utilized class of bioactive compounds, with the potential to elucidate protein regulation and function. The work presented here defines a straightforward method for identifying small molecule upregulators of a target protein’s abundance. These compounds have two important uses. First, based on the premise that upregulating the abundance of a target protein will increase its level of cellular activity, such compounds could act as protein function activators, allowing dose-dependent and reversible studies on the effects of increasing protein function. Discovery of small molecule activators has mainly focused on identifying compounds that increase the intrinsic activity of the steady-state levels of proteins. Small molecule activators have been identified for a handful of targets, such as caspases (26), the proteasome (27) and several cell surface receptors (28–30). However, the number and classes of protein targets for these direct activators are likely as limited as those for inhibitors of protein functions. In comparison to inhibitors, upregulators are not restricted to specific protein families, as they do not rely on the protein of interest being directly “druggable”, generally defined as the presence of a catalytic region that interacts with small molecules or an endogenous ligand binding site (31). Upregulators have the advantage of targeting members of the regulatory pathways of the protein of interest, greatly increasing the range of protein families that can be modulated in this manner.
The second advantage of small molecule upregulators is their utililty as probes to investigate the pathways involved in regulating the levels of a target protein. As many currently intractable conditions fall into the category of loss of function diseases, such as Spinal Muscular Atrophy, cystic fibrosis and Duchenne muscular dystrophy (32), elucidation of the pathways governing the abundance of the disease gene products may identify new therapeutic candidates. Additionally, small molecule upregulators of sufficient potency and efficacy have the potential to be developed into lead therapeutics.
Using a high-throughput screening approach for identification of small molecule upregulators of protein abundance, we discovered three small molecule upregulators of the Survival of Motor Neuron (SMN) protein. SMN has been shown to be involved in many cellular processes, such as pre-mRNA splicing (33) and β-actin mRNA localization to neuronal growth cones (34) SMN protein levels are decreased in the loss of function neurodegenerative disease Spinal Muscular Atrophy (35), making it a target of interest for both research and biomedical applications. The most active scaffold identified in our screen, a bromobenzophenone analog designated cuspin-1 (Chemical Upregulator of SMN Protein -1), was utilized as a probe to reveal a novel regulatory pathway governing SMN protein abundance. Treatment of Type I SMA fibroblast cells with cuspin-1 resulted in a 50-100% increase in endogenous SMN protein levels, as well as a concomitant increase in the phosphorylation of Erk. Since the major pathway responsible for phosphorylation of Erk is the Ras-Raf-MEK cascade (21), we expressed constitutively active isoforms of Ras, and determined that increasing Ras signaling resulted in a robust ~270-300% increase in SMN protein abundance. Mechanistic studies revealed that this upregulation was due to Ras-mediated enhancement of SMN translation rate.
Increasing the translation rate of a target protein is an unusual mechanism of action for a small molecule, however it may be a versatile one, as recent studies suggest that translation regulation may have a role in diverse cellular process such as cancer, aging and mitochondrial function (36). Future studies defining the mechanism by which increased Ras signaling affects translation of SMN protein could identify pathways of interest for SMA and perhaps other loss of function diseases. Although Ras is best known for its oncogenic properties, its ability to upregulate non-oncogenic proteins, such as SMN, demonstrate potential therapeutically beneficial downstream consequences of Ras activation. There is also significant evidence for a pro-survival effect of Ras activation, especially in neurons, where Ras has been shown to be activated by pro-survival neurotrophic factors (37). Expression of constitutively active isoforms of Ras (CA-Ras) has shown beneficial effects on the survival and outgrowth of cultured chick embryonic neurons (38). Additionally, in a mouse model of motor neuron degeneration, neuron-selective expression of CA-Ras resulted in complete rescue from lesion-induced degeneration (39). The identification of the mechanisms downstream of Ras activation resulting in cell survival could lead to novel therapeutic targets for diseases resulting from pathological cell death.
METHODS
Cell Culture
Type I spinal muscular atrophy (SMA)-affected human primary fibroblasts were obtained live with low passage number (Coriell Cell Repositories/#GM03813, #GM09677, #GM00232). The cells were cultured in Minimum Essential Medium (MEM) with Earle’s salts and non-essential amino acids (Invitrogen/#10370-021) supplemented with 15% (v/v) fetal bovine serum (FBS) (Invitrogen/#26140-079), 2 mM l-glutamine (Invitrogen/#25030-081), and antibiotics (100,000 units penicillin L−1 MEM, 100 mg streptomycin L−1 MEM) (Invitrogen/#15140-122). Cells were allowed to grow in 50 mL of the aforementioned medium at 37°C with 5% carbon dioxide in 175 cm2 tissue culture treated flasks (Corning/#431080). The foreskin fibroblast-derived BJ cell lines were cultured in DMEM (Invitrogen/#11995-040) supplemented with 10% (v/v) FBS, 2mM l-glutamine and antibiotics. Cells were grown under the same conditions as SMA cell lines.
Small Molecule Libraries Selected for Screening
The commercially available small molecule libraries selected for screening consisted of the National Institute of Neurological Disorders and Stroke (NINDS) Custom Collection of Known Bioactives (1,040 compounds), the Annotated Compound Library (ACL) (2,337 compounds), the TIC library (a select composite from TimTech, InterBioScreen and Chembridge totaling 23,685 compounds) (15), and the Comgenex library (20,000 compounds).
A second unique set of small molecules, designated the Blood-Brain Barrier (BBB) libraries, were selected from five commercially available compound libraries. These libraries contain a total of 1,322,183 unique structures which were subjected to in silico filtering using MOE 2004.03. All compounds were pre-processed by assigning polar hydrogen atoms and charges according to the MMFFx forcefield. Salts were converted to free-base or free-acid form. These pre-processed libraries were first screened for reactive functional groups and unsuitable scaffolds, as defined by Hann et al. (40) using a SMILES-string-based search method. We then proceeded to assess the BBB-penetrating potential of the compounds that passed the first two filtering steps by constructing a set of filters to predict logBB (logarithm of brain to blood partitioning ratio). The molecules’ logBB values were predicted using a model trained on 73 compounds with experimentally determined logBB values and validated on a set of 36 CNS positive and negative drugs. The obtained model gave an R2 = 0.8225 for the training and R2 = 0.6989 for the validating set. Of note, the predictions gave no false negatives in this data set.
From this screen, 126,877 compounds with predicted logBB values greater than zero (on a log scale from −3 to +6) were selected. A value of zero indicates equal partitioning between the blood and brain, while a positive value indicates that the compound would partition preferentially into CNS tissues compared to plasma. Of these compounds, we discarded those with molecular weights less than 250 or containing three or more aromatic rings. These filters were designed to eliminate very simple compounds or planar compounds that might intercalate into DNA.
The final 79,691 compounds passing these filters were submitted to clustering to assess their diversity and to remove close structural analogs, which are frequently created during syntheses used by commercial vendors. This clustering was achieved by annotating the compounds with MACCS (Molecular Design Limited) structural keys; the clustering itself was performed using the Jarvis-Patrick method. Molecular similarity was determined by the Tanimoto coefficient, the threshold for which was set at 0.7. The procedure yielded 27,577 structurally distinct clusters from four vendors. Three vendors (Asinex, Chembridge and Life Chemicals) were chosen based on pricing, and one compound from each cluster was purchased, yielding a library of 22,795 compounds likely to cross the blood-brain barrier and to be drug-like.
Small Molecule Screening
See supporting information for details on the screening protocols.
Analog Synthesis
Solvents and starting materials were purchased from Sigma-Aldrich and used without further purification. Analogs were synthesized using chlorination and Friedel-Crafts acylation. Briefly, 50-100 mg of 5-bromonicotinic acid, or desired nicotinic acid, was dissolved in ~10mL of anhydrous dichloromethane. Thionyl chloride (1.2 Eq) was added to solution. Reaction progress was monitored using pH paper. Once complete, solvent was removed under high vacuum. Acyl chlorides were coupled to desired benzene derivative in anhydrous dichloromethane with aluminum trichloride (1.3 Eq), overnight. Unreacted starting materials were removed by aqueous extraction and products were purified by chromatography in hexanes/ethyl acetate. Identity and purity was confirmed by mass spectrometry. Yields ranged between 20-75%, providing sufficient material for testing. Synthetically prepared cuspin-1 and cuspin-2 showed similar activity to that of the commercially sourced compounds, verifying the identity of the compounds. Cuspin-1 1H NMR (CDCl3, 400MHz) 8.89 (t, J = 2.2 Hz, 2H), 8.25 (t, J = 2.0 Hz, 1H), 7.74 (d, J = 8.2 Hz, 2H), 7.35 (d, J = 8.0 Hz, 2H), 2.49 (s, 3H).
Western blot analysis
SMA patient fibroblast lines were plated at 30,000 cells per well in a 6-well plate ~24 hours prior to compound treatment. Cells were treated with desired concentration of compound for 48 hours. Cells were harvested at <75% confluence, confluence may be lower due to compound toxicity. Cells were washed twice in ice-cold PBS and lysed by scraping in 100 μL ice-cold lysis buffer (50 mM HEPES, 4 0 mM NaCl, 2 mM EDTA, 0.5% Triton-X, 1.5 mM Na3VO4, 50 mM NaF, 10 mM Na-pyrophosphate, 10 mM Naβ-glycerophosphate, Roche protease inhibitor tablet). Insoluble materials were spun out by centrifugation at 10,621g for 10 minutes at 4°C. Supernatants were boiled with SDS-PAGE sample buffer prior to being separated on a 4-12% Bis-Tris NuPage gel in 1X NuPage MES running buffer. Proteins were transferred to a PVDF membrane using Invitrogen iBlot blotting system, setting P3 for 6 minutes and 40 seconds. Membranes were blocked in Odyssey blocking buffer (LI-COR/#927-40010) for 20 minutes at room temperature, then incubated overnight at 4°C with primary antibodies (see below for dilutions). Membranes were washed three times in TBS with 0.1% Tween-20, then incubated for 45-60 minutes with 680 nm-conjugated anti-mouse IgG secondary antibody at 1:3,000 (Invitrogen/#A21058) and 800 nm-conjugated anti-rabbit IgG secondary antibody at 1:3,000 (LI-COR/#926-322110). Signals were detected and quantified using the LiCor Odyssey system and software (LI-COR Biosciences).
Antibodies
mouse anti-SMN (BD Biosciences/#610647) (1:1,000), rabbit anti-actin (Santa Cruz Biotechnologies/#sc-1616-R) (1:3,000), mouse anti-alpha tubulin (Santa Cruz Biotechnologies/#sc-32293) (1:5,000), rabbit anti-phospho-Erk1/2 (Cell Signaling/#9101S) (1:1,000), rabbit anti-Erk1/2 (Cell Signaling/#9102)(1:3,000), rabbit anti-phospho-Akt (Cell Signaling/#9271)(1:2,000), rabbit anti-Akt (Cell Signaling/#9272)(1:2,000), mouse anti-NRas (EMD Biosciences/#OP25) (1:2,000), mouse anti-eIF4E (BD Biosciences/#610269)(1:2,000), mouse anti*Smac/DIABLO (BD Biosciences/#612244)(1:1,000) and mouse anti-GAPDH (Santa Cruz Biotechnologies/#sc-47724)(1:5,000).
Retroviral preparation and transduction
To prepare the retroviral supernatants, 2×10⁶ Plat-GP cells (Cell biolabs/#RV-103) were seeded per 10 cm culture dish in DMEM supplemented with 10% (v/v) fetal bovine serum (FBS), 2 mM l-glutamine, and antibiotics (100,000 units penicillin L−1 MEM, 100 mg streptomycin L−1 MEM) and 5μg ml−1 G418 (Invitrogen/#11811-031). Cells were allowed to attach overnight. The following morning pVSV-G helper plasmids with the MigR1 vector either empty or containing NRasG12D were co-transfected into the Plat-GP cells using FuGENE 6 Transfection Reagent (Roche/#11-814-443-001). Thirty hours post-transfection, culture media was replaced by Viral Collection Media (VCM, normal culture media with 30% (v/v) FBS). VCM was collected and replaced twice at 12 hour intervals to collect viral particles released into the supernatant. Viral supernatant was filtered through 0.45 micron filters prior to use or storage at −80°C. For transduction, #3813 SMA patient fibroblast cells were plated at 2×10⁵ cells per well into a 6-well plate and allowed to attach overnight. The following day, the infection cocktail was prepared by mixing 0.75mL viral supernatant, 1.25 mL growth media, and 2 μL of 8mg mL−1 polybrene (Sigma/#H9268). The culture media in each well was replaced with the infection cocktail, and then plates were spun at 1,089 g (2,250 rpm with 19.2cm rotor radius) for 90 minutes before incubation. Cells were cultured for two days prior to harvesting.
RT-qPCR of smn transcripts
RNA was harvested from 5×10⁶ cells using the Qiagen RNeasy Kit as per manufacturer’s protocol. RNA from each sample (2μg) was reverse transcribed using Applied Biosystems Taqman® kit (N808-0234) as per manufacturer’s protocol. Quantitative PCR was performed on 7300 Real-Time PCR System (Applied Biosystems) using 1X Power SYBR Green PCR Master Mix (Applied Biosystems/#4367659), 77ng cDNA and 0.15μM primers per well in a MicroAmp Optical 96-well plate (Applied Biosystems/#N801-0560). The cycle times of the smn transcripts were normalized to cycle times for hypoxanthine guanine phosphoribosyltransferase (hprt) as loading control. Amplification conditions: 50°C for 2 min, 95°C for 10 min, 40 cycles of 95°C for 15 sec and 60°C for 1 min. ΔΔCT was calculated after normalization to hprt expression. Primer sequences: smnFL-forward: 5′-CAAAAAGAAGGAAGGTGCTCA-3′, smnFL-reverse: 5′-TGGTGTCATTTAGTGCTGCTC-3′, smnΔ7-forward: 5′-ATTCTCTTGATGATGCTGATGCT-3′, smnΔ7-reverse: 5′-TATGCCAGCCATTTCCATATAATAG-3′, hprt-forward: 5′-TGACACTGGCAAAACAATGCA-3′, hprt-reverse: 5′-GGTCCTTTTCACCAGCAAGCT-3′
35S-methionine/cysteine translation rate assay
Cells were seeded at 5×10⁶ cells per 10cm dish and allowed to attach overnight. For methionine/cysteine starvation, cells were rinsed twice in PBS and incubated for 30 minutes in starvation media: Met/Cys-free DMEM (Invitrogen/#21013-024), 10% dialyzed FBS (v/v) and 2mM L-glutamine. After the starvation period, cells were pulsed with 100μCi TRAN35S-Label Metabolic Labeling Reagent (MP/#015100907) for one hour. Cells were lysed in 1 mL IP Buffer (50mM Tris [pH 7.75], 250mM NaCl, 200mM EDTA, 150mM MgCl2, 0.3% NP-40, 1% Empigen BB and Roche protease inhibitor tablet), scraped and insoluble materials were spun out at 10,621g for 10min at 4°C. Lysates were pre-cleared with 20μL Protein A/G-agarose bead slurry (Pierce/#20421) for 30 minutes, supernatants were transferred to tubes containing 30μL Protein A/G-agarose pre-coupled to 2.5Mg mouse anti-SMN antibody (BD Biosciences/#610647) and immunoprecipitated overnight at 4°C. After SMN IP, lysates were transferred to tubes containing 30μL Protein A/G-agarose pre-coupled to 2μg rabbit anti-actin antibody (Santa Cruz Biotechnologies/#sc-1616-R) and immunoprecipitated for 4 hours at 4°C. Beads were washed three times in IP buffer, and bound proteins were eluted by boiling in SDS-PAGE buffer. Samples were run on NuPAGE 4-12% Bis-Tris gels (Invitrogen/ #WG1402BOX) in 1X NuPAGE MES running buffer, fixed in 50% methanol + 10% acetic acid, and dried before exposing overnight to phosphorimager screen. Bands were imaged using a Storm phosphorimager (Molecular Dynamics) and quantification was performed using ImageQuant software (Molecular Dynamics). Values were reported as SMN to actin ratio normalized to BJeH (−HRasV12).
Supplementary Material
ACKNOWLEDGEMENTS
We are grateful to G. Morris (Centre for Inherited Neuromuscular Disease, RJAH Orthopaedic Hospital; Oswestry, UK) for his gift of mouse monoclonal SMN antibodies. We kindly thank C. Henderson (Center for Neurobiology and Behavior, Columbia University, NY) for the experiments involving mouse embryonic stem cell-derived motor neurons. We thank B. Burnett (Neurogenetics Branch, NINDS, NIH, Bethesda, MD) for confirmatory testing of cuspin-1.
FUNDING Brent R. Stockwell is an Early Career Scientist of the Howard Hughes Medical Institute. This work was supported by The SMA Foundation and the National Institutes of Health [R01GM085081, R01CA161061, and R01 CA097061)]
Footnotes
SUPPORTING INFORMATION The supporting information contains supplemental figures illustrating the validation of in silico screening filters, the SMN-upregulating activity of hit compounds c72 and c81, and the 1H NMR of cuspin-1. Additionally, there are three tables listing the summary of the screening data, a list of descriptors used for in silico calculations as well as results of genotype-specificity testing of cuspin-1. Finally, the supplemental methods describe the methods used for the cytoblot screening procedure. This material is available free of charge via the Internet at http://pubs.acs.org.
REFERENCES
- 1.Sopko R, Huang D, Preston N, Chua G, Papp B, Kafadar K, Snyder M, Oliver SG, Cyert M, Hughes TR, Boone C, Andrews B. Mapping pathways and phenotypes by systematic gene overexpression. Mol Cell. 2006;21:319–330. doi: 10.1016/j.molcel.2005.12.011. [DOI] [PubMed] [Google Scholar]
- 2.Atmaca M. Valproate and neuroprotective effects for bipolar disorder. Int Rev Psychiatry. 2009;21:410–413. doi: 10.1080/09540260902962206. [DOI] [PubMed] [Google Scholar]
- 3.Trinka E. The use of valproate and new antiepileptic drugs in status epilepticus. Epilepsia. 2007;48(Suppl 8):49–51. doi: 10.1111/j.1528-1167.2007.01349.x. [DOI] [PubMed] [Google Scholar]
- 4.Marks PA. Discovery and development of SAHA as an anticancer agent. Oncogene. 2007;26:1351–1356. doi: 10.1038/sj.onc.1210204. [DOI] [PubMed] [Google Scholar]
- 5.Richardson PG, Hideshima T, Anderson KC. Bortezomib (PS-341): a novel, first-in-class proteasome inhibitor for the treatment of multiple myeloma and other cancers. Cancer Control. 2003;10:361–369. doi: 10.1177/107327480301000502. [DOI] [PubMed] [Google Scholar]
- 6.Sun L, Trausch-Azar JS, Ciechanover A, Schwartz AL. E2A protein degradation by the ubiquitin-proteasome system is stage-dependent during muscle differentiation. Oncogene. 2007;26:441–448. doi: 10.1038/sj.onc.1209793. [DOI] [PubMed] [Google Scholar]
- 7.Chateauvieux S, Morceau F, Dicato M, Diederich M. Molecular and therapeutic potential and toxicity of valproic acid. J Biomed Biotechnol. 2010;2010 doi: 10.1155/2010/479364. [DOI] [PMC free article] [PubMed] [Google Scholar]
- 8.Monani UR, Lorson CL, Parsons DW, Prior TW, Androphy EJ, Burghes AH, McPherson JD. A single nucleotide difference that alters splicing patterns distinguishes the SMA gene SMN1 from the copy gene SMN2. Hum Mol Genet. 1999;8:1177–1183. doi: 10.1093/hmg/8.7.1177. [DOI] [PubMed] [Google Scholar]
- 9.Burghes AH, Beattie CE. Spinal muscular atrophy: why do low levels of survival motor neuron protein make motor neurons sick? Nat Rev Neurosci. 2009;10:597–609. doi: 10.1038/nrn2670. [DOI] [PMC free article] [PubMed] [Google Scholar]
- 10.Makhortova NR, Havhurst M, Cerquiera A, Sinor-Anderson AD, Zhao WN, Heiser PW, Arvanites AC, Davidow LS, Waldon ZO, Steen JA, Lam K, Ngo HD, Rubin LL. A screen for regulators of survival of motor neuron protein levels. Nat Chem Bio. 2011;7:544–552. doi: 10.1038/nchembio.595. [DOI] [PMC free article] [PubMed] [Google Scholar]
- 11.Jarecki J, Chen X, Bernardino A, Coovert DD, Whitney M, Burghes A, Stack J, Pollok BA. Diverse small-molecule modulators of SMN expression found by high-throughput compound screening: early leads towards a therapeutic for spinal muscular atrophy. Hum Mol Genet. 2005;14:2003–2018. doi: 10.1093/hmg/ddi205. [DOI] [PubMed] [Google Scholar]
- 12.Andreassi C, Jarecki J, Zhou J, Coovert DD, Monani UR, Chen X, Whitney M, Pollok B, Zhang M, Androphy E, Burghes AH. Aclarubicin treatment restores SMN levels to cells derived from type I spinal muscular atrophy patients. Hum Mol Genet. 2001;10:2841–2849. doi: 10.1093/hmg/10.24.2841. [DOI] [PubMed] [Google Scholar]
- 13.Stockwell BR, Haggarty SJ, Schreiber SL. High-throughput screening of small molecules in miniaturized mammalian cell-based assays involving post-translational modifications. Chem Biol. 1999;6:71–83. doi: 10.1016/S1074-5521(99)80004-0. [DOI] [PubMed] [Google Scholar]
- 14.Root DE, Flaherty SP, Kelley BP, Stockwell BR. Biological mechanism profiling using an annotated compound library. Chem Biol. 2003;10:881–892. doi: 10.1016/j.chembiol.2003.08.009. [DOI] [PubMed] [Google Scholar]
- 15.Zhang JH, Chung TD, Oldenburg KR. A Simple Statistical Parameter for Use in Evaluation and Validation of High Throughput Screening Assays. J Biomol Screen. 1999;4:67–73. doi: 10.1177/108705719900400206. [DOI] [PubMed] [Google Scholar]
- 16.Kelley BP, Lunn MR, Root DE, Flaherty SP, Martino AM, Stockwell BR. A flexible data analysis tool for chemical genetic screens. Chem Biol. 2004;11:1495–1503. doi: 10.1016/j.chembiol.2004.08.026. [DOI] [PubMed] [Google Scholar]
- 17.Rose K, Hall LH, Kier LB. Modeling blood-brain barrier partitioning using the electrotopological state. J Chem Inf Comput Sci. 2002;42:651–666. doi: 10.1021/ci010127n. [DOI] [PubMed] [Google Scholar]
- 18.Wildman SA, Crippen GM. Prediction of Physiochemical Parameters by Atomic Contributions. J. Chem. Inf. Comput. Sci. 1999;39:868–873. [Google Scholar]
- 19.Coovert DD, Le TT, McAndrew PE, Strasswimmer J, Crawford TO, Mendell JR, Coulson SE, Androphy EJ, Prior TW, Burghes AH. The survival motor neuron protein in spinal muscular atrophy. Hum Mol Genet. 1997;6:1205–1214. doi: 10.1093/hmg/6.8.1205. [DOI] [PubMed] [Google Scholar]
- 20.Lunn MR, Wang CH. Spinal muscular atrophy. Lancet. 2008;371:2120–2133. doi: 10.1016/S0140-6736(08)60921-6. [DOI] [PubMed] [Google Scholar]
- 21.Vojtek AB, Der CJ. Increasing complexity of the Ras signaling pathway. J Biol Chem. 1998;273:19925–19928. doi: 10.1074/jbc.273.32.19925. [DOI] [PubMed] [Google Scholar]
- 22.Hahn WC, Counter CM, Lundberg AS, Beijersbergen RL, Brooks MW, Weinberg RA. Creation of human tumour cells with defined genetic elements. Nature. 1999;400:464–468. doi: 10.1038/22780. [DOI] [PubMed] [Google Scholar]
- 23.Farooq F, Balabanian S, Liu X, Holcik M, MacKenzie A. p38 Mitogen-activated protein kinase stabilizes SMN mRNA through RNA binding protein HuR. Hum Mol Genet. 2009;18:4035–4045. doi: 10.1093/hmg/ddp352. [DOI] [PubMed] [Google Scholar]
- 24.Burnett BG, Munoz E, Tandon A, Kwon DY, Sumner CJ, Fischbeck KH. Regulation of SMN protein stability. Mol Cell Biol. 2009;29:1107–1115. doi: 10.1128/MCB.01262-08. [DOI] [PMC free article] [PubMed] [Google Scholar]
- 25.Cho S, Dreyfuss G. A degron created by SMN2 exon 7 skipping is a principal contributor to spinal muscular atrophy severity. Genes Dev. 2010;24:438–442. doi: 10.1101/gad.1884910. [DOI] [PMC free article] [PubMed] [Google Scholar]
- 26.Wolan DW, Zorn JA, Gray DC, Wells JA. Small-molecule activators of a proenzyme. Science. 2009;326:853–858. doi: 10.1126/science.1177585. [DOI] [PMC free article] [PubMed] [Google Scholar]
- 27.Huang L, Ho P, Chen CH. Activation and inhibition of the proteasome by betulinic acid and its derivatives. FEBS Lett. 2007;581:4955–4959. doi: 10.1016/j.febslet.2007.09.031. [DOI] [PMC free article] [PubMed] [Google Scholar]
- 28.Grimm C, Jors S, Saldanha SA, Obukhov AG, Pan B, Oshima K, Cuajungco MP, Chase P, Hodder P, Heller S. Small molecule activators of TRPML3. Chem Biol. 2010;17:135–148. doi: 10.1016/j.chembiol.2009.12.016. [DOI] [PMC free article] [PubMed] [Google Scholar]
- 29.Mruk K, Kobertz WR. Discovery of a novel activator of KCNQ1-KCNE1 K channel complexes. PLoS One. 2009;4:e4236. doi: 10.1371/journal.pone.0004236. [DOI] [PMC free article] [PubMed] [Google Scholar]
- 30.Small KM, McGraw DW, Liggett SB. Pharmacology and physiology of human adrenergic receptor polymorphisms. Annu Rev Pharmacol Toxicol. 2003;43:381–411. doi: 10.1146/annurev.pharmtox.43.100901.135823. [DOI] [PubMed] [Google Scholar]
- 31.Hopkins AL, Groom CR. The druggable genome. Nat Rev Drug Discov. 2002;1:727–730. doi: 10.1038/nrd892. [DOI] [PubMed] [Google Scholar]
- 32.Segalat L. Loss-of-function genetic diseases and the concept of pharmaceutical targets. Orphanet J Rare Dis. 2007;2:30. doi: 10.1186/1750-1172-2-30. [DOI] [PMC free article] [PubMed] [Google Scholar]
- 33.Pellizzoni L, Kataoka N, Charroux B, Dreyfuss G. A novel function for SMN, the spinal muscular atrophy disease gene product, in pre-mRNA splicing. Cell. 1998;95:615–624. doi: 10.1016/s0092-8674(00)81632-3. [DOI] [PubMed] [Google Scholar]
- 34.Rossoll W, Jablonka S, Andreassi C, Kroning AK, Karle K, Monani UR, Sendtner M. Smn, the spinal muscular atrophy-determining gene product, modulates axon growth and localization of beta-actin mRNA in growth cones of motoneurons. J Cell Biol. 2003;163:801–812. doi: 10.1083/jcb.200304128. [DOI] [PMC free article] [PubMed] [Google Scholar]
- 35.Lefebvre S, Burlet P, Liu Q, Bertrandy S, Clermont O, Munnich A, Dreyfuss G, Melki J. Correlation between severity and SMN protein level in spinal muscular atrophy. Nat Genet. 1997;16:265–269. doi: 10.1038/ng0797-265. [DOI] [PubMed] [Google Scholar]
- 36.Sonenberg N, Hinnebusch AG. Regulation of translation initiation in eukaryotes: mechanisms and biological targets. Cell. 2009;136:731–745. doi: 10.1016/j.cell.2009.01.042. [DOI] [PMC free article] [PubMed] [Google Scholar]
- 37.Segal RA, Greenberg ME. Intracellular signaling pathways activated by neurotrophic factors. Annu Rev Neurosci. 1996;19:463–489. doi: 10.1146/annurev.ne.19.030196.002335. [DOI] [PubMed] [Google Scholar]
- 38.Borasio GD, John J, Wittinghofer A, Barde YA, Sendtner M, Heumann R. ras p21 protein promotes survival and fiber outgrowth of cultured embryonic neurons. Neuron. 1989;2:1087–1096. doi: 10.1016/0896-6273(89)90233-x. [DOI] [PubMed] [Google Scholar]
- 39.Heumann R, Goemans C, Bartsch D, Lingenhohl K, Waldmeier PC, Hengerer B, Allegrini PR, Schellander K, Wagner EF, Arendt T, Kamdem RH, Obst-Pernberg K, Narz F, Wahle P, Berns H. Transgenic activation of Ras in neurons promotes hypertrophy and protects from lesion-induced degeneration. J Cell Biol. 2000;151:1537–1548. doi: 10.1083/jcb.151.7.1537. [DOI] [PMC free article] [PubMed] [Google Scholar]
- 40.Hann M, Hudson B, Lewell X, Lifely R, Miller L, Ramsden N. Strategic pooling of compounds for high-throughput screening. J Chem Inf Comput Sci. 1999;39:897–902. doi: 10.1021/ci990423o. [DOI] [PubMed] [Google Scholar]
Associated Data
This section collects any data citations, data availability statements, or supplementary materials included in this article.