Abstract
Exposure to 4-aminobiphenyl (4-ABP), an environmental and tobacco smoke carcinogen that targets the bladder urothelium, leads to DNA adduct formation and cancer development [1]. Two major analytical challenges in DNA adduct analysis of human samples have been limited sample availability and the need to reach detection limits approaching the part-per-billion threshold. By operating at nano-flow rates and incorporating a capillary analytical column in addition to an online sample enrichment step, we have developed a sensitive and quantitative HPLC–MS/MS method appropriate for the analysis of such samples. This assay for the deoxyguanosine adduct of 4-ABP (dG-C8-4-ABP) gave mass detection limits of 20 amol in 1.25 μg of DNA (5 adducts in 109 nucleosides) with a linear range of 70 amol to 70 fmol. 4-ABP-exposed human bladder cells and rat bladder tissue were analyzed in triplicate, and higher dose concentrations led to increased numbers of detected adducts. It was subsequently established that sample requirements could be further reduced to 1 μg digestions and the equivalent of 250 ng DNA per injection for the detection of low levels of dG-C8-4-ABP in a matrix of exfoliated human urothelial cell DNA. This method is appropriate for the characterization and quantification of DNA adducts in human samples and can lead to a greater understanding of their role in carcinogenesis and also facilitate evaluation of chemopreventive agents.
Keywords: DNA adduct, 4-Aminobiphenyl (4-ABP), N-(Deoxyguanosin-8-yl)-4-aminobiphenyl, (dG-C8-4-ABP), HPLC–MS/MS, Urinary bladder cancer, Aromatic amine
1. Introduction
All living organisms are constantly exposed to toxic agents, endogenous and exogenous. In humans, such exposures may originate from a variety of sources including automobile and industrial exhausts, dietary sources and cigarette smoke [2,3]. These agents or their electrophilic metabolites can bind covalently to deoxyribonucleic acid (DNA) to form addition products commonly referred to as DNA adducts whose formation has long been associated with carcinogenesis [4–7]. It has been postulated that when DNA adducts are not efficiently repaired, alterations in the DNA sequence may occur during replication that can lead to mutation and ultimately cancer [8]. Many arylamines and nitrosamines are potent mutagens and have been implicated in chemical carcinogenesis. Prominent among them is 4-aminobiphenyl (4-ABP), an environmental carcinogen found in cigarette smoke, paints, food colors, hair dyes and fumes from heated oils and fuels [9–13]. 4-ABP targets the bladder urothelium and has been linked to human bladder cancer, a major world health problem [1,14–16]. While an indirect measurement of 4-ABP exposure only serves as an estimate of potential DNA damage, a direct measurement of 4-ABP DNA adducts accounts for inconsistencies in adsorption, metabolism, detoxification, and DNA repair and is consequently more relevant to assessing the effect of exposure on bladder cancer [17]. Several studies have also shown that after cases were adjusted for exposures, higher levels of DNA adducts were observed in cancer patients than non-cancer patients [18–22]. Accordingly, DNA adducts serve as both biomarkers of exposure and susceptibility to cancer and for that reason their measurement has significant implications for disease risk assessment [23].
A major challenge in the analysis of DNA adducts has been the low levels at which they typically occur in vivo. They are found in a complex matrix of protein, ribonucleic acid (RNA), and salt as well as excess unmodified bases, which in the case of 4-ABP is a million to a billion-fold [17,24]. These adduct quantities have been observed in a number of studies employing a wide array of distinct analytical methodologies that include 32P-postlabeling [25–28], tissue immunohistochemical staining [29–33], gas chromatography–mass spectrometry (GC–MS) [15,34], and high-performance liquid chromatography–mass spectrometry (HPLC–MS) [35,36]. In addition to the complex matrix, often only a small quantity of DNA may be obtainable for analysis from in vivo samples, necessitating minimal analyte loss during sample handling. A method suitable for the analysis of 4-ABP DNA adducts at levels compatible with human exposure must simultaneously tolerate the constraints of limited sample availability and detection limits approaching the part-per-billion threshold.
Mass spectrometry-based approaches, most notably HPLC–MS, which combine the features of high sensitivity with structural information have assumed a leading role in this area. A detailed and comprehensive review of the recent literature on the status of HPLC–MS for the analysis of DNA adducts can be found in an article by Singh and Farmer [37]. Additional and somewhat more focused reviews on this subject are also available [38–45].
In analyses conducted on conventional bore 2 mm internal diameter (i.d.) HPLC–MS, N-(deoxyguanosin-8-yl)-4-aminobiphenyl (dG-C8-4-ABP) was reported as the principal isomeric adduct formed in the reaction of calf-thymus DNA with N-hydroxy-4-ABP and was also isolated in hepatic DNA of mice treated with 4-ABP. The reported levels of dG-C8-4-ABP were between 1.8 and 430 adducts in 107 nucleotides in calf-thymus DNA modified in vitro through reaction with N-hydroxy-4-ABP and 4.9 and 30 in 107 nucleotides in hepatic DNA isolated from mice treated with 4-ABP [24]. Since these analyses were carried out with relatively large bore columns (≥2 mm i.d.) they required processing 0.1–1.0 mg or more DNA. This has been reduced as impressive improvements in overall sensitivity for the trace level detection of bulky DNA adducts have been achieved by coupling capillary separation methods to nanoelectrospray ionization (ESI) MS [46]. In their capillary LC–microESI-MS/MS technique developed for the analysis of dG-C8-4-ABP adducts in human pancreas DNA from a small set of smokers and non-smokers, Ricicki et al. achieved a limit of quantification (LOQ) approaching 1 adduct in 108 nucleotides using 100 μg of DNA per sample and only 13.3 μg of DNA per analysis [36]. This was further decreased to 2.50 μg of DNA per analysis in a subsequent study using a smaller i.d. capillary column (75 μm i.d. compared to 320 μm i.d. in the previous study) and a reduced flow rate of 200 nL/min compared to the previous 20 μL/min [47]. A major limitation in both of the latter two studies was the off-line solid-phase extraction (SPE) enrichment step requiring relatively large (100 μg) quantities of DNA in order to compensate for the inevitable analyte losses during sample processing. The method we present here integrates a 75 μm i.d. analytical column with online sample enrichment on a trap column prior to analysis, reducing both the quantity of DNA required and detection levels. This improved DNA adduct quantification methodology has a detection level of 5 adducts per 109 nucleosides using a total of 5 μg of DNA and the equivalent of only 1.25 μg of DNA per analysis.
2. Experimental
2.1. Chemicals and standards
Caution: 4-Aminobiphenyl and its derivatives are carcinogenic and should be handled carefully.
McCoy’s 5A medium supplemented with 10% (v/v) fetal bovine serum from Life Technologies (Grand Island, NY), rat liver S9 from Moltox (Boone, NC), Nicotinamide adenine dinucleotide phosphate (NADP) from Amresco, Inc. (Solon, OH) and Harlan 7012 Nature Ingredient diet from Harlan Laboratories (Bartonsville, IL) were required during cell and animal dosing periods. The following chemicals were obtained from Sigma–Aldrich Chemical Co. (St. Louis, MO): d-glucose-6-phospate disodium hydrate, calf-thymus DNA, nuclease p1 from penicillium citrinium, deoxyribonuclease 1 (DNase I) type 2 from bovine pancreas, alkaline phosphatase from Escherichia coli (type IIIs), ethanol, magnesium chloride, dimethyl sulfoxide (DMSO), and 4-Aminobiphenyl (4-ABP). Hydrochloric acid was purchased from Fisher Scientific (Pittsburgh, PA, USA). Phosphodiesterase 1 (crotalus adamanteous venom) was purchased from USB Corporation (Cleveland, OH). For HPLC–MS/MS analysis, acetic acid (glacial, 99.99+%) was acquired from Aldrich Chemical Co. (Milwaukee, WI), and Burdick and Jackson solvents (methanol, acetonitrile, and water) were obtained from Thermo Fischer Scientific (Pittsburgh, MA) and were HPLC grade. N-(2-Deoxyguanosine-8-yl)-4-ABP (dG-C8-4-ABP) was acquired from Toronto Research Chemicals (North York, ON) and the deuterium labeled internal standard dG-C8-4-ABP-d9 was previously synthesized and characterized in our laboratory [36].
2.2. Cell study
RT-4 human bladder carcinoma cells were grown in McCoy’s 5A medium supplemented with 10% (v/v) fetal bovine serum and maintained in a humidified incubator at 37 °C with 5% CO2. Cells were plated at a concentration of 2.0 million cells per 10-cm dish with 10 mL growth medium overnight and then treated with 0, 0.5, 5.0, or 50 μM 4-ABP dissolved in DMSO for 3 h in the presence of 6% rat liver S9, 10 mM d-glucose-6-phospate disodium hydrate, and 5 mM NADP. Triplicate cultures were completed at each condition. Following treatment, cells were harvested by trypsinization, washed once with ice-cold PBS and stored at −80 °C until analysis. DNA was extracted using Qiagen Blood and Cell Culture DNA Midi Kits according to the manufacturer’s instructions. Cell cultures of roughly 5 million cells yielded 20–40 μg of nuclear DNA.
2.3. Animal study
Twelve 2-month-old male F/344/NHsd rats (approximately 180 g of body weight) were purchased from Harlan Sprague Dawley (Indianapolis, IN). The protocol was reviewed and approved by the Animal Care and Use Committee at Roswell Park Cancer Institute. Animals were acclimated for 1 week and were fed the Nature Ingredient diet (Harlan 7012) and water ad libitum. 4-ABP was prepared in DMSO and administered by IP injection at doses of 0, 25, 100, or 250 mg/kg of body weight in a final volume of 0.1 mL per rat. Animals were sacrificed 24 h after the dosing, and the urinary bladders were obtained immediately and stored at −80 °C. DNA was extracted with an Invitrogen Easy-DNA kit according to the manufacturer’s instructions. Approximately 10–30 μg of DNA was isolated from rat bladder specimens of about 30 mg each.
2.4. Exfoliated human urothelial cell study
Four 150–250 mL urine samples from a lifetime non-smoker were collected and stored at −80 °C. Samples were thawed and urothelial cells were pelleted by centrifugation at 8000×g for 10 min at 4 °C (Thermo Scientific, Sorvall RT-1). DNA was isolated using a Qiagen Blood and Cell Culture DNA Midi Kit with the following yields: 0, 1.3, 2.2 and 2.8 μg. One μg of DNA was removed from each sample, digested according to the procedure described below and reconstituted in 20 μL 10% methanol for three 5 μL injections per sample. DNA from two of the samples was pooled for a 1 μg digest to be spiked with IS and 2.24 fmol dG-C8-4-ABP before protein precipitation. The remainder of DNA from the third sample was reserved for testing digestion efficiency. Specifically, 1 μg urothelial cell DNA was pooled with 10 ng DNA isolated from 4-ABP dosed RT-4 cells. For comparison, 1 μg calf-thymus DNA was also pooled with 10 ng of the same adducted RT-4 cell DNA. These two samples were digested according to the protocol described below and reconstituted in 20 μL 10% methanol for three 5 μL injections each.
2.5. DNA quantification, enzymatic digestion and protein precipitation
DNA isolated from cells and tissues was dissolved in 10 mM MgCl2/5 mM Tris buffer (pH 7.2) to about 1 mg/mL. An Invitrogen Corporation (Carlsbad, CA) Quant-ITTM double strand (ds) DNA BR Assay kit with a Qubit fluorometer was used for DNA quantification. One or 5 μg aliquots were removed for digestion and analysis, and the remainder was stored at −80 °C. DNA was hydrolyzed according to a previously described procedure [48] with some modifications. Specifically, samples were incubated at 98 °C for 3–5 min and chilled on ice during the addition of 0.3 units of nuclease P1 (0.3 units μL−1 solution of 5 mM Tris–Cl, pH 7.4) and 3.1 Kunits of DNase I (1 μg μL−1 solution in 5 mM TRIS/10 mM MgCl2, pH 7.4) per μg of DNA. Following a 5-h incubation at 37 °C, 0.003 units of phosphodiesterase (100 ng μL−1 in 5 mM TRIS/10 mM MgCl2, pH 7.4), and 0.002 units of alkaline phosphatase per μg of DNA were added and the reaction mixture was held at 37 °C for 18 h. At the end of the incubation period, 6 fmol of internal standard, dG-C8-4-ABP was added per μg DNA. The digestion was terminated with the addition of five volumes of ice-cold ethanol (−20 °C). Proteins were pelleted by centrifugation at 7500×g (Thermo Scientific, Sorvall RT-1) for 15 min at 4 °C. Following lyophilization, samples were reconstituted in 20 μL of 10% methanol. Samples at replicate doses were pooled and analyzed in triplicate.
2.6. Preparation of dG-C8-4-ABP standard curves
Calf-thymus DNA was weighed out and dissolved in 10 mM MgCl2/5 mM Tris buffer (pH 7.2) to an approximate concentration of 1 mg/mL. DNA concentration was verified using the Invitrogen Corporation (Carlsbad, CA) Quant-ITTM double strand (ds) DNA BR Assay kit with the Qubit fluorometer. Following DNA digestion but before protein precipitation, dG-C8-4-ABP was spiked into 5 μg aliquots of calf-thymus DNA in the following amounts: 0, 0.27, 0.54, 1.1, 2.2, 4.3, 8.6, 17, 35, 70, 140, and 280 fmol. Each aliquot was also spiked with 6 fmol dG-C8-4-ABP-d9 per μg DNA. For accurate quantification, the calibration curve was prepared in triplicate.
2.7. Preparation of standards for heat treatment stability assessment
To determine the stability of 4-ABP adducts during heat treatment at 98 °C for 3 min, four sets of mixtures were prepared in which 8.4 fmol of dG-C8-4-ABP and 30 fmol dG-C8-4-ABP-d9 were added prior to or post-heat treatment to a final volume of 20 μL in 10% methanol. Triplicate mixtures were completed for each set and samples within each set were pooled before analysis.
2.8. Capillary liquid chromatography and nESI-MS/MS
Liquid chromatography was performed using ChemStation for LC 3D Systems operating an Agilent 1100 Series system (Agilent Technologies, Wilmington, DE) equipped with a capillary pump, a nano pump, a 1200 series micro well-plate autosampler, and a chip cube interface. Chromatographic separations were performed on an Agilent Technologies small molecule microfluidic chip containing a 40 nL trap and 75 μm i.d. × 43 μm analytical column of reverse phase Zorbax SB-C18 and 5 μm particles. Each injection loaded 5 μL of sample onto the trap column at a flow rate of 4.00 μL min−1 to be washed for 4 min with 93% mobile phase A (3% acetonitrile, 0.1% acetic acid in water) and 7% mobile phase B (0.1% acetic acid in methanol). Chromatographic separations were conducted at a flow rate of 300 nL min−1 with mobile phase A (water with 0.1% acetic acid) and mobile phase B (methanol with 0.1% acetic acid). Mobile phase B was held at 10% for 4.21 min, then linearly increased to 90% over 2 min, held for 2 min, then stepped down to 10% for a 5 min re-equilibration period.
To reduce carryover and prevent plugging of the narrow i.d. capillaries used for connections between the autosampler and chip cube, several cleaning procedures were implemented. An inline prefilter (0.5 μm) was placed between the autosampler and the loading capillary to prevent particulates in the sample from plugging the loading capillary and enrichment column inlet screen. During analysis mode, a needle wash program cleaned the needle seat, the needle seat capillary, and rotor seal with acetonitrile, methanol, and water while the loading capillary was washed with 90% B. One methanol blank and two 10% methanol blanks were injected between samples. In addition, nano pump and capillary pump pressures, system suitability standards and internal standards were used to monitor system performance.
Mass spectrometric data were acquired on an Agilent 6330 Ion Trap mass spectrometer (Santa Clara, CA) operated with 6300 Series Ion Trap HPLC–MS Software Ver. 6.1 and 6300 Series Trap Control Software Ver. 6.1 from Bruker Daltonik GmbH (Bremen, Germany). The mass spectrometer was calibrated by infusing tuning solution and 10 ng/mL dG-C8-4-ABP. For all analyses, the N2 drying gas was set to 3.0 L min− at 325 °C and the capillary voltage was held at −1900 V with an end-plate offset of −500 V. Ion optics and trap parameters were as follows: skimmer 1: 40.5 V, capillary exit: 163.5 V, trap drive: 54.2 V, ultra scan mode (24,000 m/z per scan), and positive ion mode. Ion charge control parameters were set to a maximum accumulation of 50 ms or 500,000 ions and 3 spectral averages per scan. CID pressure was 3 mT He and voltage ramped from 0.45 to 3 V. MS/MS spectra were collected within a scan window of 290–475 m/z and precursor ions 435.4 ± 1.0 and 444.0 ± 1.5 Da were isolated and fragmented with a cutoff fragmentation of 27% of the precursor ion mass.
Quant Analysis (Ver. 1.8) and Data Analysis (Ver 3.4) for 6300 Ion Trap LC/MS (Bruker Daltonik GmbH) were used for data processing. Extracted ion chromatograms selected to monitor for the characteristic loss of deoxyribose were 435→319 for the analyte, dG-C8-4-ABP and 444→328 for the internal standard, dG-C8-4-ABP-d9. Gaussian smoothing was set to a width of 0.65 m/z.
2.9. Quantification of dG-C8-4-ABP in biospecimens
The standard curve of dG-C8-4-ABP plots the mass of dG-C8-4-ABP versus the mean analyte to internal standard peak area ratio and was generated in triplicate over an 8-month period. Triplicate analyses were also conducted for every point in each calibration plot. Linear regression data derived from the average of all three plots enabled the quantification of dG-C8-4-ABP in 4-ABP-exposed human bladder cells and rat bladder tissues.
3. Results and discussion
3.1. Mass spectrometric analysis of dG-C8-4-ABP synthetic standard
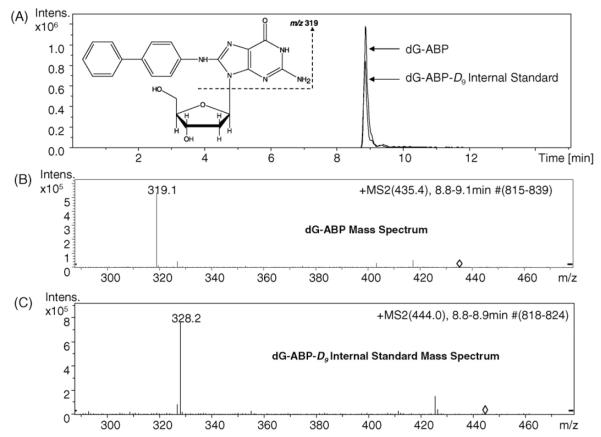
Prior to sample analysis, a 10 ng mL−1 solution of dG-C8-4-ABP in 70:30:0.1 (v%) methanol:water:acetic acid was infused at 300 nL/min to optimize the trap parameters and ion optics for the dG-C8-4-ABP 435→319 transition. This fragmentation is due to the characteristic loss of deoxyribose, [M+H]+→[M+H–116]+. Following infusion, both the dG-C8-4-ABP standard and dG-C8-4-ABP-d9 internal standard were injected on column and the retention time was determined to be 8.9 min. The chemical structures, extracted ion chromatograms and MS/MS spectra of 1.89 fmol standard and 1.74 fmol internal standard are displayed in Fig. 1.
Fig. 1.
HPLC–MS of dG-C8-4-ABP standards. (A) The chemical structure of the dG-C8-4-ABP adduct is shown. The dG-C8-4-ABP-d9 internal standard is isotopically labeled with deuterium around the biphenyl moiety. The extracted ion chromatograms (435→319 and 444→328 for the analyte and IS respectively) of 1.89 fmol dG-C8-4-ABP and 1.74 fmol IS are shown above. Retention time for the standard and the internal standard is 8.9 min. (B) MS/MS spectrum of dG-C8-4-ABP. (C) MS/MS spectrum of internal standard.
3.2. Online adduct enrichment
Sample preparation can have a substantial impact on sensitivity in the quantification of DNA adducts by mass spectrometry [17]. The online sample clean-up method presented here eliminates the need for solid-phase extraction (SPE), reducing sample preparation time, sample handling, and analyte loss as well as eliminating the introduction of SPE related artifacts which can cause ion suppression. The microfluidic chip (Fig. 2) used in this method incorporates both a trap and analytical column, enabling the online adduct enrichment step. The sample was loaded onto the 40 nL trap column and salts and unmodified nucleosides were washed off for 4 min before placing the trap column inline with the analytical column during analysis mode. The analyte was then washed from the trap column to the analytical column for separation.
Fig. 2.
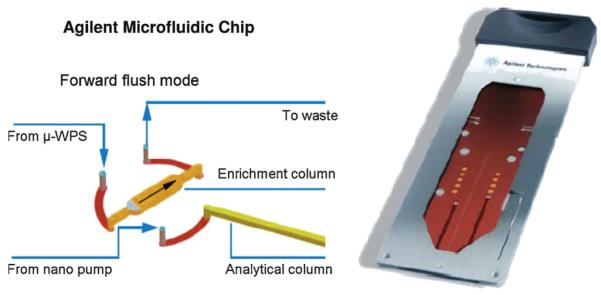
A detailed view of the Agilent microfluidic chip used in our online sample enrichment method (courtesy of Agilent Technologies, Inc.). The chip integrates a 40 nL trap column, a 75 μm i.d. × 43 μm analytical column of reverse phase Zorbax SB-C18 and 5 μm particle size, and a nanospray emitter. The chip is shown in enrichment mode during which the sample was washed with 7% methanol, removing unwanted salts and excess unmodified nucleosides. In analysis mode, the analyte was moved from the trap column to the analytical column for separation.
3.3. dG-C8-4-ABP stability assessment during heat treatment
Samples are subject to heat treatment during the digestion procedure to denature the DNA for efficient hydrolysis by Nuclease P1. Therefore, to determine the stability of 4-ABP adducts towards heat treatment at 98 °C for 3 min, we compared standards that were exposed to heat treatment with standards that were not. Four sets of triplicate mixtures were evaluated in which 8.4 fmol of dG-C8-4-ABP and 30 fmol dG-C8-4-ABP-d9 were added prior to or post-heat treatment. The precision within each set was below 20% RSD. As shown in Fig. 3, the standard error bars of all sets overlap, indicating that their difference is not statistically significant.
Fig. 3.
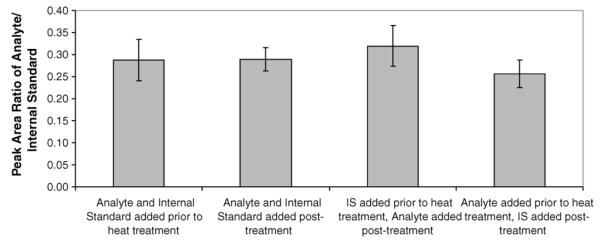
Heat treatment stability assessment. Four sets of mixtures were compared in which 8.4 fmol of dG-C8-4-ABP and 30 fmol dG-C8-4-ABP-d9 were added prior to or post-heat treatment at 98 °C for 3 min. Each set was taken through the protocol in triplicate and the precision of all sets was below 20% RSD. The standard error bars of all sets overlap, indicating that their difference is not statistically significant.
3.4. Calibration curve and linearity
The standard curve of the number of fmol dG-C8-4-ABP versus the mean analyte to internal standard peak area ratios was prepared in triplicate in a matrix of 5 μg calf-thymus DNA to simulate the conditions of the real samples. The isotopically labeled internal standard was added to correct for variations in sample preparation and instrument operation. A linear regression analysis of the data was generated in Microsoft Excel using the least squares fit to the line y = mx + b. Each point was equally weighted and the line was not forced through the origin. Values derived from the standard curves (Fig. 4) were as follows: slope = 0.100±0.001, y-intercept = 0.05±0.03, and correlation coefficient R2 = 0.99±0.08. The LOD was determined to be 20 amol on column or approximately 5 adducts in 109 nucleosides and the LOQ, the lowest point on the calibration curve, was 70 amol on column or 2 adducts in 108 nucleosides. Representative chromatograms of dG-C8-4-ABP analysis at the LOD and LOQ levels are shown in Fig. 5.
Fig. 4.
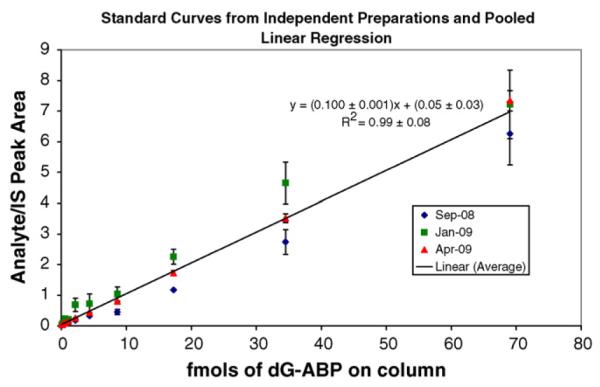
Standard curve. dG-C8-4-ABP calibration curves of fmol analyte on column versus the ratio of analyte to internal standard peak areas were generated in triplicate over an 8-month period. Every point from each calibration curve was also analyzed in triplicate. The linear regression line incorporates all three curves and has a slope of 0.100±0.001, a y-intercept of 0.05±0.03, and a correlation coefficient R2 of 0.99±0.08.
Fig. 5.
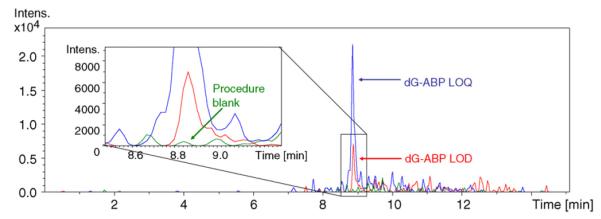
LOD and LOQ. Extracted ion chromatograms (435→319) of the LOD, 20 amol on column in 1.25 μg of DNA or approximately 5 adducts in 109 nucleosides and the LOQ, 70 amol on column in 1.25 μg of DNA or 2 adducts in 108 nucleosides. The extracted ion chromatogram (435→319) of 1.25 μg calf-thymus DNA on column is also shown as the procedure blank.
3.5. Accuracy and precision
Three quality control points from three standard curves were evaluated to demonstrate the precision and accuracy of the method. Accuracy was determined by back-calculating the mass of dG-C8-4-ABP based on the observed ratio of analyte to internal standard and percent relative standard deviation (%RSD) provided a measure of precision. Table 1 lists the average precision and average accuracy values of the quality control points. Together, these values have a %RSD of 16% and an average accuracy of 93%.
Table 1.
Precision and accuracy. Three quality control points from three standard curves were used to determine precision and accuracy. Based on these values, the method was determined to have an average precision (%RSD) of 16% and average accuracy of 93%
| fmol dG-ABP on column | Average analyte/IS peak area | Average precision %RSD | Average % accuracy |
|---|---|---|---|
| 1.0 | 0.2 | 21 | 97 |
| 10. | 0.8 | 14 | 83 |
| 70. | 6.9 | 12 | 100 |
3.6. Reproducibility
Reproducibility was determined with replicate doses of RT-4 cell and rat bladder DNA digests. RT-4 cells were treated in triplicate with 4-ABP plus an S9 activation system, taken through the sample preparation procedure that was previously described, and each sample was analyzed twice. Subsequently, 6 μL aliquots from each sample were pooled and injected three times (Fig. 6). To test reproducibility in the rat specimens, 5 μg aliquots of rat bladder DNA from three rats dosed at 25 mg/kg 4-ABP were taken through the sample preparation procedure and the equivalent of 1.25 μg of DNA from each digest was injected three times. The average number of adducts was determined to be 6±2 adducts in 107 nucleosides when the samples were run individually and 8±3 adducts in 107 nucleosides when pooled. The precision of the pooled and individually run methods was determined to be statistically the same by the F test (the calculated F-value 1.83 was less than the tabulated value of 4.45 at the 95% confidence level). Applying the T test, there was no statistical difference between running the samples individually or pooled (the calculated value of T, 1.43 was less than the tabulated value of 2.23 at the 95% confidence level). Because replicate dose concentrations resulted in similar adduct quantities in both cells and rats, samples were pooled.
Fig. 6.
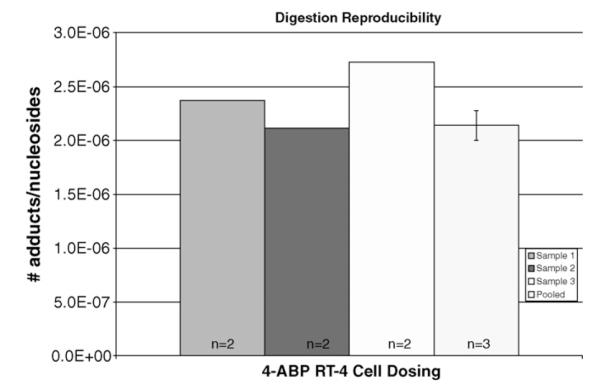
Reproducibility of 4-ABP-dosed RT-4 cell results. Three individual dosings and digestions were compared to the pooled analysis. Cells were treated with 4-ABP plus an S9 activation system in triplicate, taken through the sample preparation procedure, and injected twice per sample. 6 μL aliquots from each sample were then pooled and analyzed three times.
3.7. Quantification of dG-C8-4-ABP adducts in human bladder RT-4 cells and rat bladder tissue
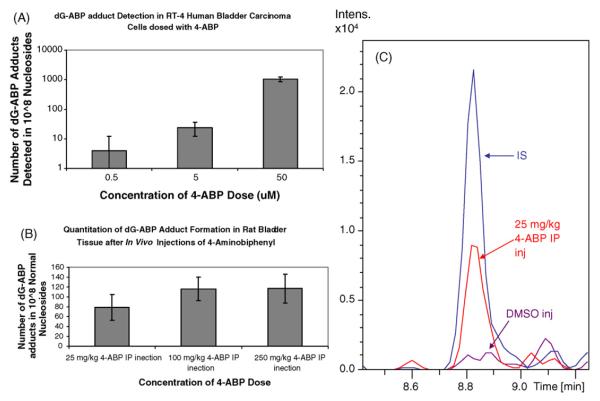
The quantity of dG-C8-4-ABP adducts detected in dosed cells and tissues was calculated from the peak area ratio of dG-C8-4-ABP to IS and the standard curve linear regression values. These findings are summarized in Table 2. Plots of 4-ABP dose versus observed adduct content and extracted ion chromatograms of the lowest dose rat sample and the control sample are displayed in Fig. 7. As indicated, no adduct was detected in control samples. Because the ratio of analyte to IS by peak area of the highest dosed cell sample was greater than that of the last point on the calibration curve, the regression values were linearly extrapolated to calculate the adduct quantity in this sample. The observation that adduct content increased with increasing 4-ABP dose in the RT-4 cell study reinforces the implication of this carcinogen in DNA adduct formation [1,49]. This trend may have been more apparent in the rat study had the 4-ABP dose extended over a wider range, for example two orders of magnitude as in the cell experiment, rather than only one. The ambiguity of this trend may also be due to the complicated processes involved in DNA adduction; the quantification of DNA adducts is not simply a measurement of exposure, but also the metabolism of the carcinogen, including activation and deactivation, enzymatic esterification processes, and detoxification and repair pathways, which may differ among species, tissues, and even phenotypes [17,23]. In comparison to an experimental cell line, the steps leading to adduction are even more complex in an organism, where certain processes are specific to distinct tissues. For example, following exposure to 4-ABP, and certainly with many competing reactions along the way, it is generally accepted that the carcinogen is converted to N-hydroxy-4-ABP in the liver and then to a reactive electrophile in the target tissue [50].
Table 2.
Doseresponse data in human cells and rat tissue. (A) dG-ABP adduct content and absolute standard deviation from RT-4 human bladder carcinoma cells that were treated with 4-ABP dissolved in DMSO. Cells were cultured in triplicate, pooled, and analyzed in triplicate. (B) Adduct quantity and absolute standard deviation from bladder tissue DNA extracted from twelve 2-month old F/344/NHsd rats that were administered 4-ABP prepared in DMSO. DNA from replicate doses was pooled before analysis and injections were completed in triplicate
| Concentration of 4-ABP in DMSO (μM) | Analyte/internal standard by peak area | fmol dG-ABP on column | Number of adducts detected in 108 nucleosides |
|---|---|---|---|
| (A) 4-ABP dosed human bladder RT-4 cells | |||
| 0 | Not detected | Not detected | Not detected |
| 0.5 | 0.065±0.005 | 0.2±0.3 | 4±8 |
| 5.0 | 0.14±0.03 | 0.9±0.5 | 20±10 |
| 50 | 4.0±0.8 | 40±8 | 1100±200 |
| Concentration of 4-ABP in DMSO IP injection (mg 4-ABP/kg body weight) |
Analyte/internal standard by peak area | fmol dG-ABP on column | Number of adducts detected in 108 nucleosides |
|
| |||
| (B) 4-ABP dosed F/344/NHsd rats | |||
| 0 | Not detected | Not detected | Not detected |
| 25 | 0.34±0.09 | 3±1 | 80±30 |
| 100 | 0.49±0.08 | 4.4±0.9 | 120±20 |
| 250 | 0.5±0.1 | 4±1 | 120±30 |
Fig. 7.
Plots of 4-ABP dose versus detected dG-C8-4-ABP adduct quantity. Cell and animal dosings were completed in triplicate at each concentration. 5 μg of DNA was digested from each sample and samples from the same dose concentration were pooled before triplicate analysis. Only 1.25 μg of DNA was utilized per injection. (A) Logarithmic scale plot of dG-C8-4-ABP levels observed in dosed RT-4 human bladder carcinoma cells. (B) Dose–response plot of animal data. (C) Extracted ion chromatograms (435→319 for the analyte and 444→328 for the IS) of lowest dose rat and control samples.
3.8. dG-C8-4-ABP in exfoliated urothelial cells
Given the well established propensity of 4-ABP to target the bladder urothelium and the implications associated with bladder cancer, an ultimate objective would be the application of the methodology described here to the analysis of urothelial cell DNA. A particular challenge presented here is the low quantity of exfoliated urothelial cell DNA typically isolated from urine samples. This quantity may vary widely, with often only 1 μg or less extracted from about 200 mL of urine [27,28,51,52]. In view of this, we scaled down the method to be more suitable for the analysis of these samples by digesting only 1 μg of DNA from these samples rather than 5. This approach would then consume the equivalent of 250 ng rather than 1.25 μg DNA per analysis. Assuming the mass LOD remains at 20 amol, this method would correspond to a detection limit of 2.5 adducts in 108 nucleotides and would still be well suited for the analysis of human samples.
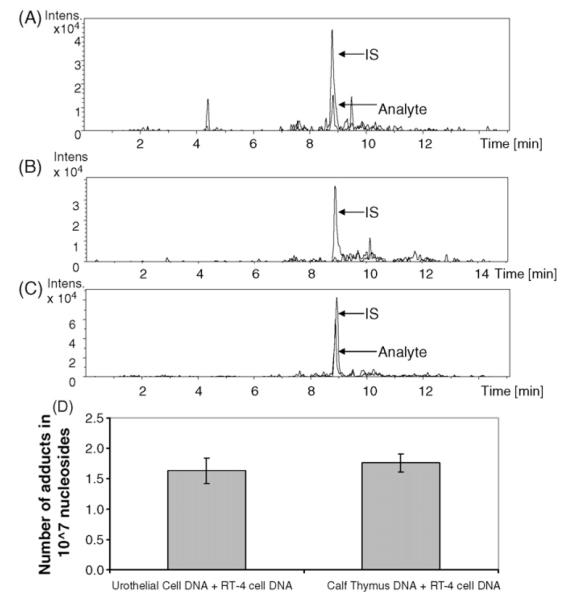
Initially, the 1 μg digestion process was tested by analyzing a bladder DNA sample from a rat exposed to the lowest level of 4-ABP (25 mg/kg 4-ABP). The amount of adduct in the 1 μg digest was found to be 7±2 adducts in 107 nucleotides (Fig. 8A), which was not significantly different from that determined previously using a 5 μg digest (the calculated value of T, 0.7 was less than the tabulated value of 2.5 at the 95% confidence level).
Fig. 8.
Analysis of dG-C8-4-ABP adducts by digesting 1 μg of DNA. (A) Chromatogram of dG-C8-4-ABP from the processing of 1 μg of DNA (equivalent of 250 ng injected on-column) in bladder sample of rat dosed with 25 mg/kg 4-ABP. Signal corresponds to 7±2 adducts in 107 nucleotides, which is the same as that obtained from the analysis of a 5 μg digest. (B) Representative chromatogram from the analysis of a 1 μg urothelial cell DNA digest of a lifetime non-smoker. The dG-C8-4-ABP adduct was not detected but the response of the internal standard has not been compromised by the urothelial cell matrix. (C) Analysis of dG-C8-4-ABP from two pooled urothelial cell samples; 1 μg DNA was digested and spiked with IS and 2.24 fmol dG-C8-4-ABP. On-column injection of 250 ng corresponds to injection of 14±3 adducts in 107 nucleosides. (D) Determination of digestion efficiency of urothelial cell DNA. Comparison of dG-C8-4-ABP adduct levels in 1 μg exfoliated urothelial cell DNA and 1 μg calf-thymus DNA, each spiked with 10 ng 4-ABP-modified DNA prior to digestion. No statistical differences are observed.
Following confirmation of capability of our method to handle reduced amounts of DNA, three 1 μg aliquots of urothelial cell DNA from the lifetime non-smoker were digested and the equivalent of 250 ng DNA was analyzed three times per sample. As shown in the representative chromatogram of Fig. 8B, no dG-C8-4-ABP adduct was detected in these samples and this should not be surprising since they were obtained from a never-smoker; several studies have linked smoking to 4-ABP adducts in bladder biopsy specimens or exfoliated urothelial cells [15,26,27]. Significantly, however, the response of the internal standard did not appear to be compromised by the urothelial cell matrix. Therefore, the remainder of the DNA isolated from two of the exfoliated urothelial cell samples was pooled for a 1 μg digest and spiked with IS and 2.24 fmol dG-C8-4-ABP. A chromatogram of the analysis showing the detection of 14±3 adducts in 107 nucleotides is shown in Fig. 8C. Based on back-calculating the mass of dG-C8-4-ABP from the ratio of analyte to internal standard peak areas, this value corresponds to an accuracy of 113%.
Furthermore, to test the digestion efficiency in exfoliated urothelial cell DNA, ABP-modified DNA was mixed with exfoliated urothelial cell DNA prior to digestion. Accordingly, digests of 10 ng 4-ABP dosed RT-4 cell DNA mixed with 1 μg of urothelial cell DNA and 10 ng of 4-ABP dosed RT-4 cell DNA mixed with 1 μg of calf-thymus DNA were compared. In each case, approximately 1.5 adducts in 106 nucleotides were detected indicating similar digestion efficiencies. These results are summarized in a bar graph form in Fig. 8D. These experiments demonstrate that this LC–MS method is capable of measuring dG-C8-4-ABP from exfoliated urothelial cells.
4. Conclusions
The HPLC–MS/MS method presented in this paper is suitable for the quantification of 4-ABP DNA adducts in human samples. High sensitivity was accomplished with nano-flow rates, capillary columns and online sample enrichment prior to HPLC–MS/MS analysis. Only 1.25 μg of DNA is needed per analysis to reach the detection limit of 20 amol (5 adducts in 109 nucleosides) and the linear range spanned from 70 amol to 70 fmol. Although high reproducibility, accuracy, and precision have been demonstrated on an ion trap mass spectrometer, we expect the use of a triple quadrupole mass analyzer would even further improve the method’s robustness.
Once the methodology was established, the assay was applied to the quantification of dG-C8-4-ABP adducts in human bladder cells and rat bladder tissue. Human bladder carcinoma cells were treated with 0.5–50 μM 4-ABP and rats were administered 25–250 mg/kg 4-ABP, with analytical replicates at each dose. Replicate doses were shown to be precise and reproducible, and the direct relationship between dose and DNA adduct quantity confirmed that 4-ABP exposure led to adduct formation. The sample requirements were further reduced to the equivalent of 250 ng DNA per injection in the analysis of exfoliated human urothelial cells and it was demonstrated that low levels of dG-C8-4-ABP could be detected in this matrix.
The described method can be applied to explore the relevance of 4-ABP DNA adducts to bladder cancer and its relationship to smoking or other exposures. In combination with related research projects such as those analyzing carcinogen metabolites [53], determining the impact of sequence context on the formation of DNA adducts [54–56], profiling gene expression [47,57], elucidating complex 3D nucleic acid structures [58] or evaluating chemopreventive agents [59–61], this method can have considerable implications on the current understanding of carcinogenesis induced by 4-ABP or other structurally related carcinogens.
Supplementary Material
Acknowledgments
This work was supported by grants 1RO1CA69390, 1RO1CA112231 and R01CA120533 from the National Cancer Institute. Special thanks to Jim Glick for expert technical assistance and to Josh Klaene for critical reading of the manuscript. This is contribution No. 956 from the Barnett Institute.
Footnotes
Appendix A. Supplementary data Supplementary data associated with this article can be found, in the online version, at doi:10.1016/j.chroma.2009.11.006.
References
- [1].Feng Z, Hu W, Rom WN, Beland FA, Tang MS. Carcinogenesis. 2002;23:1721. doi: 10.1093/carcin/23.10.1721. [DOI] [PubMed] [Google Scholar]
- [2].Luch A. Nat. Rev. Cancer. 2005;5:113. doi: 10.1038/nrc1546. [DOI] [PubMed] [Google Scholar]
- [3].Wogan GN, Hecht SS, Felton JS, Conney AH, Loeb LA. Semin. Cancer Biol. 2004;14:473. doi: 10.1016/j.semcancer.2004.06.010. [DOI] [PubMed] [Google Scholar]
- [4].Phillips DH. Environ. Health Perspect. 1996;104(Suppl. 3):453. doi: 10.1289/ehp.96104s3453. [DOI] [PMC free article] [PubMed] [Google Scholar]
- [5].Miller EC, Miller JA. Cancer. 1981;47:1055. doi: 10.1002/1097-0142(19810301)47:5+<1055::aid-cncr2820471302>3.0.co;2-3. [DOI] [PubMed] [Google Scholar]
- [6].Hemminki K. Carcinogenesis. 1993;14:2007. doi: 10.1093/carcin/14.10.2007. [DOI] [PubMed] [Google Scholar]
- [7].Nesnow S, Ross JA, Stoner GD, Mass MJ. Toxicology. 1995;105:403. doi: 10.1016/0300-483x(95)03238-b. [DOI] [PubMed] [Google Scholar]
- [8].Bartsch H. Mutat. Res. 2000;462:255. doi: 10.1016/s1383-5742(00)00008-9. [DOI] [PubMed] [Google Scholar]
- [9].Oh SWKMN, Cho CW, Lee MW. Dyes Pigments. 1997;33:119. [Google Scholar]
- [10].Garrigos MC, Reche F, Pernias K, Sanchez A, Jimenez A. J. Chromatogr. A. 1998;819:259. doi: 10.1016/s0021-9673(98)00432-4. [DOI] [PubMed] [Google Scholar]
- [11].Tokiwa H, Nakagawa R, Horikawa K. Mutat. Res. 1985;157:39. doi: 10.1016/0165-1218(85)90047-3. [DOI] [PubMed] [Google Scholar]
- [12].Turesky RJ, Freeman JP, Holland RD, Nestorick DM, Miller DW, Ratnasinghe DL, Kadlubar FF. Chem. Res. Toxicol. 2003;16:1162. doi: 10.1021/tx030029r. [DOI] [PubMed] [Google Scholar]
- [13].IARC Monogr Eval. Carcinog. Risk Chem. Hum. 1986;38:35. [PubMed] [Google Scholar]
- [14].Vineis P. Environ. Health Perspect. 1994;102(Suppl. 6):7. doi: 10.1289/ehp.94102s67. [DOI] [PMC free article] [PubMed] [Google Scholar]
- [15].Airoldi L, Orsi F, Magagnotti C, Coda R, Randone D, Casetta G, Peluso M, Hautefeuille A, Malaveille C, Vineis P. Carcinogenesis. 2002;23:861. doi: 10.1093/carcin/23.5.861. [DOI] [PubMed] [Google Scholar]
- [16].Miller EC. Cancer Res. 1978;38:1479. [PubMed] [Google Scholar]
- [17].Koc H, Swenberg JA. J. Chromatogr. B Anal. Technol. Biomed. Life Sci. 2002;778:323. doi: 10.1016/s1570-0232(02)00135-6. [DOI] [PubMed] [Google Scholar]
- [18].Tang D, Phillips DH, Stampfer M, Mooney LA, Hsu Y, Cho S, Tsai WY, Ma J, Cole KJ, She MN, Perera FP. Cancer Res. 2001;61:6708. [PubMed] [Google Scholar]
- [19].Tang D, Santella RM, Blackwood AM, Young TL, Mayer J, Jaretzki A, Grantham S, Tsai WY, Perera FP. Cancer Epidemiol. Biomarkers Prev. 1995;4:341. [PubMed] [Google Scholar]
- [20].Peluso M, Airoldi L, Magagnotti C, Fiorini L, Munnia A, Hautefeuille A, Malaveille C, Vineis P. Carcinogenesis. 2000;21:183. doi: 10.1093/carcin/21.2.183. [DOI] [PubMed] [Google Scholar]
- [21].Vulimiri SV, Wu X, Dubowska W. Baer, Andrade M, Detry M, Spitz MR. J. DiGiovanni, Mol. Carcinog. 2000;27:330. doi: 10.1002/(sici)1098-2744(200004)27:4<330::aid-mc11>3.0.co;2-e. [DOI] [PubMed] [Google Scholar]
- [22].Li D, Wang M, Cheng L, Spitz MR, Hittelman WN, Wei Q. Cancer Res. 1996;56:3638. [PubMed] [Google Scholar]
- [23].Vineis P, Perera F. Int. J. Cancer. 2000;88:325. [PubMed] [Google Scholar]
- [24].Doerge DR, Churchwell MI, Marques MM, Beland FA. Carcinogenesis. 1999;20:1055. doi: 10.1093/carcin/20.6.1055. [DOI] [PubMed] [Google Scholar]
- [25].Kadlubar FF, Talaska G, Lang NP, Benson RW, Roberts DW. IARC Sci. Publ. 1988;166 [PubMed] [Google Scholar]
- [26].Talaska G, al-Juburi AZ, Kadlubar FF. Proc. Natl. Acad. Sci. U.S.A. 1991;88:5350. doi: 10.1073/pnas.88.12.5350. [DOI] [PMC free article] [PubMed] [Google Scholar]
- [27].Talaska G, Schamer M, Skipper P, Tannenbaum S, Caporaso N, Unruh L, Kadlubar FF, Bartsch H, Malaveille C, Vineis P. Cancer Epidemiol. Biomarkers Prev. 1991;1:61. [PubMed] [Google Scholar]
- [28].Vineis P, Talaska G, Malaveille C, Bartsch H, Martone T, Sithisarankul P, Strickland P. Int. J. Cancer. 1996;65:314. doi: 10.1002/(SICI)1097-0215(19960126)65:3<314::AID-IJC6>3.0.CO;2-2. [DOI] [PubMed] [Google Scholar]
- [29].Romano G, Mancini R, Fedele P, Curigliano G, Flamini G, Giovagnoli MR, Malara N, Boninsegna A, Vecchione A, Santella RM, Cittadini A. Anticancer Res. 1997;17:2827. [PubMed] [Google Scholar]
- [30].Zhang YJ, Hsu TM, Santella RM. Cancer Epidemiol. Biomarkers Prev. 1995;4:133. [PubMed] [Google Scholar]
- [31].Curigliano G, Zhang YJ, Wang LY, Flamini G, Alcini A, Ratto C, Giustacchini M, Alcini E, Cittadini A, Santella RM. Carcinogenesis. 1996;17:911. doi: 10.1093/carcin/17.5.911. [DOI] [PubMed] [Google Scholar]
- [32].Wang LY, Chen CJ, Zhang YJ, Tsai WY, Lee PH, Feitelson MA, Lee CS, Santella RM. Am. J. Epidemiol. 1998;147:315. doi: 10.1093/oxfordjournals.aje.a009452. [DOI] [PubMed] [Google Scholar]
- [33].Besaratinia A, Van Straaten HW, Kleinjans JC, Van Schooten FJ. Mutat Res. 2000;468:125. doi: 10.1016/s1383-5718(00)00049-8. [DOI] [PubMed] [Google Scholar]
- [34].Lin D, Lay JO, Jr., Bryant MS, Malaveille C, Friesen M, Bartsch H, Lang NP, Kadlubar FF. Environ. Health Perspect. Suppl. 1994;102:11. doi: 10.1289/ehp.94102s611. [DOI] [PMC free article] [PubMed] [Google Scholar]
- [35].Zayas B, Stillwell SW, Wishnok JS, Trudel LJ, Skipper P, Yu MC, Tannenbaum SR, Wogan GN. Carcinogenesis. 2007;28:342. doi: 10.1093/carcin/bgl142. [DOI] [PubMed] [Google Scholar]
- [36].Ricicki EM, Soglia JR, Teitel C, Kane R, Kadlubar F, Vouros P. Chem. Res. Toxicol. 2005;18:692. doi: 10.1021/tx049692l. [DOI] [PubMed] [Google Scholar]
- [37].Singh R, Farmer PB. Carcinogenesis. 2006;27:178. doi: 10.1093/carcin/bgi260. [DOI] [PubMed] [Google Scholar]
- [38].Deforce DL, Lemiere F, Hoes I, Millecamps RE, Esmans EL, De Leenheer A, Vanden Eeckhout EG. Carcinogenesis. 1998;19:1077. doi: 10.1093/carcin/19.6.1077. [DOI] [PubMed] [Google Scholar]
- [39].Andrews CL, Vouros P, Harsch A. J. Chromatogr. A. 1999;856:515. doi: 10.1016/s0021-9673(99)00779-7. [DOI] [PubMed] [Google Scholar]
- [40].Apruzzese WA, Vouros P. J. Chromatogr. A. 1998;794:97. doi: 10.1016/s0021-9673(97)00820-0. [DOI] [PubMed] [Google Scholar]
- [41].Turesky RJ, Vouros P. J. Chromatogr. B Anal. Technol. Biomed. Life Sci. 2004;802:155. doi: 10.1016/j.jchromb.2003.10.053. [DOI] [PubMed] [Google Scholar]
- [42].Farmer PB, Sweetman GMA. J. Mass Spectrom. 1995;30:1369. [Google Scholar]
- [43].Farmer PB, Singh R. Mutat. Res. 2008;659:68. doi: 10.1016/j.mrrev.2008.03.006. [DOI] [PubMed] [Google Scholar]
- [44].Wang Y. Chem. Res. Toxicol. 2008;21:276. doi: 10.1021/tx700411g. [DOI] [PubMed] [Google Scholar]
- [45].Taghizadeh K, McFaline JL, Pang B, Sullivan M, Dong M, Plummer E, Dedon PC. Nat. Protoc. 2008;3:1287. doi: 10.1038/nprot.2008.119. [DOI] [PMC free article] [PubMed] [Google Scholar]
- [46].Xue Q, Foret F, Dunayevskiy YM, Zavracky PM, McGruer NE, Karger BL. Anal. Chem. 1997;69:426. doi: 10.1021/ac9607119. [DOI] [PubMed] [Google Scholar]
- [47].Ricicki EM, Luo W, Fan W, Zhao LP, Zarbl H, Vouros P. Anal. Chem. 2006;78:6422. doi: 10.1021/ac0607360. [DOI] [PubMed] [Google Scholar]
- [48].Gangl ET, Turesky RJ, Vouros P. Chem. Res. Toxicol. 1999;12:1019. doi: 10.1021/tx990060m. [DOI] [PubMed] [Google Scholar]
- [49].Fletcher K, Tinwell H, Ashby J. Mutat. Res. 1998;400:245. doi: 10.1016/s0027-5107(98)00070-0. [DOI] [PubMed] [Google Scholar]
- [50].Cohen SM, Boobis AR, Meek ME, Preston RJ, McGregor DB. Crit. Rev. Toxicol. 2006;36:803. doi: 10.1080/10408440600977651. [DOI] [PubMed] [Google Scholar]
- [51].Talaska G, Dooley KL, Kadlubar FF. Carcinogenesis. 1990;11:639. doi: 10.1093/carcin/11.4.639. [DOI] [PubMed] [Google Scholar]
- [52].Peters S, Talaska G, Jonsson BA, Kromhout H, Vermeulen R. Cancer Epidemiol. Biomarkers Prev. 2008;17:1452. doi: 10.1158/1055-9965.EPI-07-2777. [DOI] [PubMed] [Google Scholar]
- [53].Fede JM, Thakur AP, Gooderham NJ, Turesky RJ. Chem. Res. Toxicol. 2009;22:1096. doi: 10.1021/tx900052c. [DOI] [PMC free article] [PubMed] [Google Scholar]
- [54].Liao Q, Shen C, Vouros P. J. Mass Spectrom. 2009;44:549. doi: 10.1002/jms.1532. [DOI] [PMC free article] [PubMed] [Google Scholar]
- [55].Xiong W, Glick J, Lin Y, Vouros P. Anal. Chem. 2007;79:5312. doi: 10.1021/ac0701435. [DOI] [PubMed] [Google Scholar]
- [56].Glick J, Xiong W, Lin Y, Noronha AM, Wilds CJ, Vouros P. J. Mass Spectrom. 2009:1241. doi: 10.1002/jms.1605. [DOI] [PMC free article] [PubMed] [Google Scholar]
- [57].Luo W, Fan W, Xie H, Jing L, Ricicki E, Vouros P, Zhao LP, Zarbl H. Chem. Res. Toxicol. 2005;18:619. doi: 10.1021/tx049828f. [DOI] [PubMed] [Google Scholar]
- [58].Zhang Q, Yu ET, Kellersberger KA, Crosland E, Fabris D. J. Am. Soc. Mass Spectrom. 2006;17:1570. doi: 10.1016/j.jasms.2006.06.002. [DOI] [PubMed] [Google Scholar]
- [59].Paonessa JD, Munday CM, Fauceglia P. Mhawech, Munday R, Zhang Y. Chem. Biol. Interact. 2009;180:119. doi: 10.1016/j.cbi.2008.12.001. [DOI] [PMC free article] [PubMed] [Google Scholar]
- [60].Munday R, Fauceglia P. Mhawech, Munday CM, Paonessa JD, Tang L, Munday JS, Lister C, Wilson P, Fahey JW, Davis W, Zhang Y. Cancer Res. 2008;68:1593. doi: 10.1158/0008-5472.CAN-07-5009. [DOI] [PubMed] [Google Scholar]
- [61].Bacon JR, Williamson G, Garner RC, Lappin G, Langouet S, Bao Y. Carcinogenesis. 2003;24:1903. doi: 10.1093/carcin/bgg157. [DOI] [PubMed] [Google Scholar]
Associated Data
This section collects any data citations, data availability statements, or supplementary materials included in this article.


