

Abstract
We have previously reported genome-wide significant linkage of bipolar disorder to a region on 22q12.3 near the marker D22S278. Towards identifying the susceptibility gene, we have conducted a fine-mapping association study of the region in two independent family samples, an independent case–control sample and a genome-wide association dataset. Two hundred SNPs were first examined in a 5 Mb region surrounding the D22S278 marker in a sample of 169 families and analyzed using PLINK. The peak of association was a haplotype near the genes stargazin (CACNG2), intraflagellar transport protein homolog 27 (IFT27) and parvalbumin (PVALB; P = 4.69 × 10⁻⁴). This peak overlapped a significant haplotype in a family based association study of a second independent sample of294 families (P = 1.42 × 10⁻⁵). Analysis of the combined family sample yielded statistically significant evidence of association to a rare three SNP haplotype in the gene IFT27 (P = 8.89 × 10⁻⁶). Twelve SNPs comprising these haplotypes were genotyped in an independent sample of 574 bipolar I cases and 550 controls. Statistically significant association was found for a haplotype window that overlapped the region from the first two family samples (P = 3.43 × 10⁻⁴). However, analyses of the two family samples using the program LAMP, found no evidence for association in this region, but did yield significant evidence for association to a haplotype 3′ of CACNG2 (P = 1.76 × 10⁻⁶). Furthermore, no evidence for association was found in a large genome-wide association dataset. The replication of association to overlapping haplotypes in three independent datasets suggests the presence of a bipolar disorder susceptibility gene in this region.
Background
Bipolar disorder (BD) is a major psychiatric disorder that affects between 1% and 5% of the world’s population [Goodwin and Jamison, 2007]. Individuals with bipolar disorder experience episodes of mania alternating with depression and suffer a 17% rate of suicide. While current disease etiology is unknown, data argues for a strong genetic component to BD [Tsuang and Faraone, 1990]. First degree family members of individuals with BD have a 7% risk for BD versus 1% in the general population. Twin studies have reported heritability estimates ranging from 0.62 to 0.93 [Smoller and Finn, 2003; Kieseppa et al., 2004; Wray and Gottesman, 2012]. Previously, we reported a linkage genome scan performed on 20 extended North American families with bipolar disorder that yielded strong evidence for a susceptibility locus on 22q with a genome-wide maximum LOD score of 3.8 at microsatellite marker D22S278 [Kelsoe et al., 2001]. Other independent studies yielded significant results at or near this marker in schizophrenia [Moises et al., 1995; Vallada et al., 1995] and bipolar disorder [Mujaheed et al., 2000]. One study of psychotic bipolar disorder also found evidence of linkage in the same region at D22S277 [Potash et al., 2003].
Some, but not all, meta-analyses and combined analyses of linkage studies have supported linkage in this region for bipolar disorder and schizophrenia[Badner and Gershon, 2002; McQueen et al., 2005]. Badner and Gershon performed a meta-analysis of 11 genome scans for bipolar disorder and 18 genome scans for schizophrenia. For bipolar disorder, 13q and 22q were the two regions statistically significant (P = 6 × 10⁻⁶and 1 × 10⁻⁵, respectively). When bipolar disorder and schizophrenia studies were combined, 22q had the most significant results of any region in the genome (P = 2 × 10⁻⁸). However, other individual studies, meta-analyses, and combined analysis found less support [Williams et al., 1997; Segurado et al., 2003; McQueen et al., 2005].
In this study, we attempt to fine map the variants associated with bipolar disorder at D22S278 with a high density SNP association scan of the region surrounding the marker in two independent family based samples. Subsequently, we attempt to replicate our results in an independent case control sample and a large genome-wide association study (GWAS) dataset.
Methods
Subject Selection and Assessment
Family sample
Families were selected from waves 1–4 of the NIMH Genetics Initiative for Bipolar Disorder sample and from the UCSD family sample. The methods used in the collection of the NIMH sample have been described elsewhere [Nurnberger et al., 1997; Dick et al., 2003]. Briefly, families in waves 1 and 2 were ascertained through a bipolar I (or schizoaffective, bipolar type, SABP) proband and selected for extended multiplex pedigrees. Waves 3 and 4 were ascertained through a bipolar I—bipolar I (or SABP) sib pair with parents. These samples were collected through a multisite consortium within the U.S. Subjects were directly interviewed using the Diagnostic Interview for Genetic Studies (DIGS) [Nurnberger et al., 1994]. Information from the DIGS, medical records and other family informants were then considered together in determining a final best estimate diagnosis. Similar methods were employed for the UCSD family sample which has been described previously [Kelsoe et al., 2001]. This sample was collected as part of a three site consortium (San Diego, Cincinnati, and Vancouver) and included extended families ascertained through bipolar probands [Kelsoe et al., 2001]. These subjects were directly interviewed using the Structured Clinical Interview for DSM IV (SCID), but otherwise similar diagnostic methods were employed.
Case control replication sample
An independent sample of unrelated cases were selected primarily from subjects collected at UCSD for a pharmacogenetic study of lithium response. These subjects were directly interviewed using either the SCID or DIGS and similar diagnostic methods were employed. Additional unrelated cases were selected from waves 1–5 of the NIMH Genetics Initiative collection. Wave 5 was collected by a similar consortium as that of waves 1–4 and similar assessment methods were employed. Wave 5 includes approximately 4,000 subjects who were ascertained as unrelated bipolar I cases for large association studies [Smith et al., 2009]. Control subjects were collected as part of a large genome-wide association study (GWAS) of schizophrenia [O’Donovan et al., 2008] and screened for psychiatric disorders as previously described [Smith et al., 2009]. The case control replication sample contained no overlap of subjects with either family study.
GAIN/TGEN
The Bipolar Genome Study (BiGS) was initiated in 2006 to conduct a genome-wide association study (GWAS) of BD using probands from waves 1–5 of the NIMH collection. Subjects were ascertained and assessed as described above. The control subjects for both the GAIN and TGEN studies came from the same collection for a large GWAS of schizophrenia as used for the case control replication sample described above [O’Donovan et al., 2008].
All subjects were Caucasians of European origin. All subjects provided written informed consent using IRB approved procedures.
Genotyping
Family study
The first phase of the family study consisted of 200 SNPs spanning a 5 Mb region around D22S278 (chr22:32161448–37304626, NCBI36/hg18) and included 598 individuals and 352 cases from 169 families from NIMH waves 1–2 and the UCSD family sample. The SNPs were genotyped at Illumina using the Golden Gate assay. The second phase of the family study consisted of 203 SNPs spanning a smaller 1.5 Mb region around the first study’s most significant haplotype (chr22:34271966–36048950, NCBI36/hg18) with 1,281 individuals and 702 cases from 294 families independent from the first phase’s sample. An additional 610 individuals from 161 families from the first phase were also genotyped in the second phase; these genotypes were removed when the two studies were compared and later used when merged for comparison to the case–control sample set. The SNPs in the second phase were genotyped using ABI SNPlex technology.
Case control replication sample
Twelve SNPs were selected based on the results from the family studies and genotyped in an independent sample of 574 cases and 550 controls. Genotyping was conducted using a 5′ exonuclease assay (ABI Taqman).
GAIN/TGEN GWAS
The initial BiGS genotyping for GWAS (1,001 cases and 1,033 controls of European ancestry) was conducted at the Broad Institute on the Affymetrix Genome-Wide Human SNP Array 6.0 as part of the Genetic Association Information Network (GAIN) [Smith et al., 2009]. These cases were partly from waves 1–4 and partly from wave 5. A second set of subjects (1,190 cases and 401 controls) were genotyped at the Translational Genomics Research Institute (TGEN) also on the Affymetrix Genome-Wide Human SNP Array 6.0 [Smith et al., 2011]. These cases derived entirely from wave 5. The present study uses genotypes from samples from both the GAIN and TGEN GWA studies which were merged and used as a replication sample. Subjects present in the family set used in this study (262 cases and 7 controls) were removed from the merged GAIN/TGEN GWA set before imputation in order to ensure independent samples. This sample is, therefore, independent of the family sample. However, it does overlap with the case control replication sample, as 271 of the cases and all the controls in the case control replication sample are included in GAIN/TGEN. Data was previously filtered for quality control [Smith et al., 2009].
Statistical Analysis
Family study, quality control
Individuals were tested for a missing genotype rate of >0.1 using PLINK [Purcell et al., 2007]. No individuals were removed for missingness. SNPs were also tested for missingness (with maximum 5% missing) and deviation from Hardy–Weinberg Equilibrium (HWE P < 0.001) using PLINK. No SNPs were filtered out due to violation of HWE. 13 SNPs from the first phase and 3 SNPs from the second phase were filtered out for genotype missingness in PLINK. After separate analyses, the two family phases of data were merged in PLINK over the smaller second phase region (chr22:34271966–36048950, NCBI36/hg18).
Family study, TDT
The family datasets were analyzed by the Transmission Disequilibrium Test (TDT) in PLINK with both the TDT and hap-TDT functions. Haplotypes of 2, 3, 4, and 5 SNPs were examined using a sliding window approach. The TDT is a family based association test that measures the transmission of alleles from heterozygous parents at a locus to affected offspring. It then tests whether transmission is statistically different from an even transmission of either allele using a chi-squared test with one degree of freedom. Significance thresholds were then adjusted with Nyholt’s correction, calculated from matSpD [Nyholt, 2004]. Nyholt’s method incorporates linkage disequilibrium in order to estimate the effective number of independent tests.
Family study, merging data by imputation
Because of differences in the SNPs genotyped within the 1.5 Mb intervalin the two phases of the family study, genotypes were imputed to a common set of SNPs using BEAGLE. Two measures of imputation accuracy were used as the criteria for final inclusion of imputed genotypes into the dataset: r2and genotype probability. An r 2 > 0.6 measure was used as a cutoff for reliable SNP-wide imputation calls. Only imputed SNPs with genotype probabilities >0.6 were used in subsequent analyses. Imputation yielded a dataset of 200 SNPs in 463 families and 1,931 subjects.
Analyses of family data using LAMP
LAMP employs a likelihood model of marker data conditional on trait data and likelihood ratio tests to detect both association and linkage in families [Li et al., 2005]. As with the PLINK analyses, single SNPs were analyzed, as well as, a sliding window of haplotypes of 2, 3, 4, and 5 SNPs in length. For haplotype analyses, the same haplotypes were used as were estimated by PLINK using the EM algorithm for the analyses using PLINK described above. All analyses assumed a disease prevalence of 0.01.
GAIN/TGEN, imputation
Imputation was also performed on the merged GAIN/TGEN dataset with the densely genotyped reference panel, HapMap 3 (CEU release 27, HapMap.org), using the program BEAGLE as described above. After imputation, SNPs were filtered for missingness (with maximum 5% missing).
Case control association analyses
Association analyses (both single SNP and haplotype) for both the case control replication sample and the GAIN/TGEN sample were performed in PLINK. Similar filtering for HWE and missingness were applied as used for the family studies.
GAIN/TGEN ± family study, psychosis
Information from the DIGS or SCID interviews was used to identify patients who had psychotic features during either mania or depression. Subjects were divided in terms of bipolar disorder with presence/absence of psychosis, and a TDT analysis was performed for both groups. Similarly, for the GAIN/TGEN sample, separate association analyses were conducted for cases with psychosis versus controls, and cases without psychosis versus controls. Nyholt’s correction was calculated using matSpD [Nyholt, 2004].
Results
We show here that haplotypes overlapping a common region at 22q12.3 showed evidence for association to bipolar disorder in two independent family sets and an independent case control sample in a region previously identified by linkage analysis. However, the association was not replicated in a GWAS case control sample. The samples and overall workflow are summarized in Table 1, the map of the region and all SNPs examined are summarized in Figure 2. Figure 1 summarizes the results from the fine mapping phases of the study in the two family samples
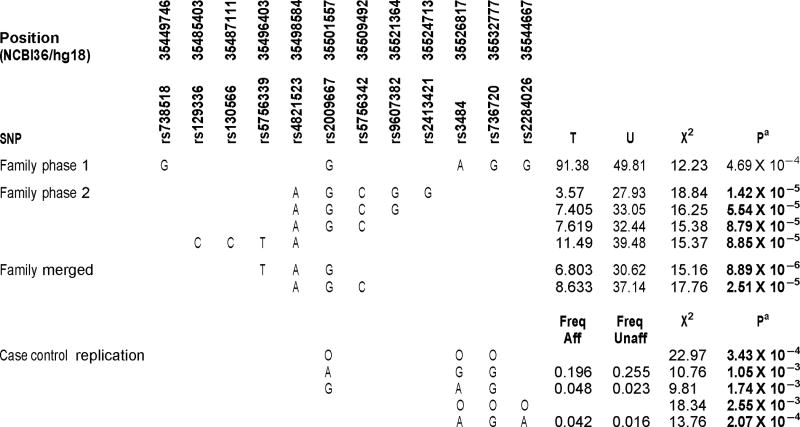
TABLE I.
Haplotypes Associated With Bipolar Disorder in Family Study Phase 1, Family Study Phase 2 and Case Control Sample
|
O, omnibus test over all haplotypes.
Statistically significant haplotypes using Nyholt correction for multiple comparisons are in bold.
Fig. 2. Association analysis of the case control replication sample.
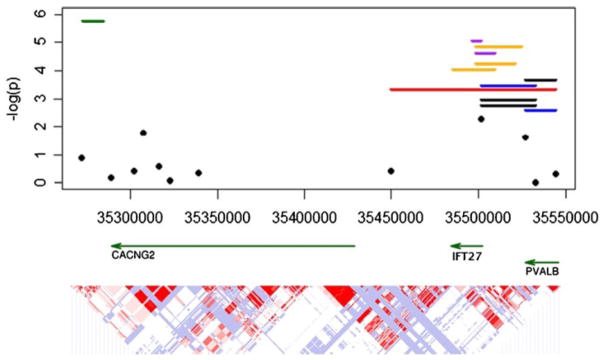
Significance levels as −log(P) of the 12 SNPs genotyped in the case control replication sample are illustrated as black circles. Black lines denote the significant individual haplotype window incorporating all haplotypes in the window. The significant haplotypes from the three family sample analyses are also illustrated here for comparison: family study phase 1 is red, family study phase 2 is orange, the merged family sample is purple. The most significant haplotype from the LAMP analysis is illustrated in green. Gene locations and the LD structure in the HapMap Caucasian sample are below for reference.
Positions are based on the NCBI 36 map.
FIG. 1. TDT analysis of family study phases.

The top three panels illustrate the significance of single SNP and haplotype analysis as –log(P) for the two independent family samples and their merged results. Black circles denote the single SNP analyses. The haplotypes are colored by number of SNPs used in the window (5 SNPs—red, 4 SNPs—orange, 3SNPs—green, 2SNPs—blue). UCSC genome browser gene track is provided for reference.
The NCBI 36 map is used for positions.
Family Study Phase 1
No single SNP reached statistical significance following the Nyholt correction for multiple comparisons. The most significant result was a 5 SNP haplotype consisting of SNPs: rs738518|rs2009667|rs3484|rs736720|rs2284026 with a P-value of 4.69 × 10⁻⁴, just missing the Nyholt corrected threshold for statistical significance (see Table I and Fig. 2). This haplotype spans a 95 kb region that is upstream of the CACNG2 promoter and overlaps the gene IFT27, previously known as RABL4, and the start of PVALB (chr22: 35449746–35544667). Since this was our most significant result, we designed a follow up family study to fine map an interval of 1.5 Mb surrounding this region in a second independent sample.
Family Study Phase 2
In the second phase of the study, no single SNP reached statistical significance following correction for multiple comparisons. The most significant result was a 5-SNP haplotype consisting of SNPs: rs4821523|rs2009667|rs5756342|rs9607382|rs2413421, with a statistically significant of P-value of 1.42 × 10⁻⁵. This haplotype was different from the significant haplotype from the first phase, but was entirely included in the region encompassed by the first phase haplotype. This second haplotype spanned a region at the end of IFT27 and upstream of PVALB (chr22: 35498584–35524713). Two other haplotypes in this region that were contained in the 5 SNP haplotype (4-SNP haplotype: rs4821523|rs2009667|rs5756342|rs9607382 and 3-SNP haplotype: rs4821523|rs2009667|rs5756342) also reached statistical significance (P-value = 5.54 × 10⁻⁵ and P-value = 8.79 × 10⁻⁵, respectively). Another 4-SNP haplotype that was overlapping, but centromeric within IFT27 also reached statistical significance (chr22: 35485403–35498584). This 4-SNP haplotype consisted of SNPs rs129336|rs130566|rs5756339|rs4821523 with a P-value of 8.85 × 10⁻⁵. Of note, all four of these significantly associated haplotypes shared the same “A” allele at rs4821523, and three of the haplotypes were essentially different length versions of the same haplotype. Three of these haplotypes also share the same “G” allele at rs2009667, which is consistent with the most significant 5 SNP haplotype from the first phase study. However, phases 1 and 2 results were inconsistent in that all significant phase 2 haplotypes showed diminished transmission, while the 5 SNP haplotype from the phase 1 study displayed an excess of transmission.
Merged Family Data
The most significant haplotype in the PLINK analysis of the merged dataset was a 3 SNP haplotype (rs5756339, rs4821523, rs2009667) with a P-value of 8.89 × 10⁻⁶ (Nyholt correction threshold: 2.82 × 10⁻⁴). An overlapping 3 SNP haplotype (rs4821523|rs2009667|rs5756342) with a P-value of 2.51 × 10⁻⁵ was also statistically significant. These haplotypes were both contained in significant haplotypes from family study phase 2 and the nominally significant haplotype from family study phase 1. As seen in phase 2, these two significantly associated haplotypes also showed diminished transmission.
Analysis of Family Data Using LAMP
We subsequently reanalyzed the family data using LAMP. By modeling each entire family, LAMP is more powerful for extended families than TDT. In particular, LAMP can determine what portion of linkage is explained by a specific SNP. All three family samples, phase 1, phase 2 and merged, were analyzed using LAMP in similar fashion to the PLINK analyses. The results of the direct association model are summarized in Figure 1. Limited support was found (P < 0.02) for the region identified in both family samples above using PLINK. However, a different 4 SNP haplotype was identified located near the 3′ end of CACNG2. This haplotype had the most significant P value of any analysis conducted (P = 1.76 × 10⁻⁶). As illustrated in Figure 2, this second region is just beyond the 3′ end of CACNG2 and approximately 260 kb from the other region identified by PLINK. These results suggest the possibility of a second mutation near the gene CACNG2. This idea is supported by the LAMP analysis which found evidence of other linked variants in addition to the best haplotype identified by LAMP (LOD = 1.46, P = 0.036).
Case Control Replication Study
In order to attempt further replication of these results, the twelve SNPs occurring in the most strongly associated haplotypes from the PLINK analysis of both family samples were genotyped in an independent sample of 574 bipolar I cases and 550 controls. Single SNPs and all 2, 3, 4, and 5 SNP haplotypes were tested for association. As shown in Table I and Figure 2, three haplotypes in two windows, as well as, the omnibus test over all haplotypes in the two windows were statistically significant after multiple comparisons correction. One of these (rs2009667, rs3484, and rs736720) contained alleles (GAG) identical to those of the core of the 5 SNP haplotype from family study 1. This haplotype showed an increase in frequency in the affecteds consistent with the overtransmission seen in family study 1.
GAIN/TGEN GWAS Dataset
An attempt was made to expand on these results by testing this region in the GAIN/TGEN combined GWAS dataset. These data included genotyped and imputed genotypes for 4,318 SNPs across the same 5 Mb interval examined in family study 1 in 1,929 bipolar I cases and 1,427 controls. These data yielded no statistically significant evidence of association after multiple comparisons correction for any individual SNP or any haplotype (data not shown). However, only 2 of the 12 most significant SNPs were included on the microarray, so there was limited ability to interrogate the same haplotypes.
This region has shown both linkage and association to both schizophrenia and psychotic bipolar disorder in previous studies. Therefore, we conducted separate analyses stratified by psychosis in both the merged family study dataset and the GAIN/TGEN dataset. However, neither of these analyses found evidence of association specific to psychotic bipolar cases (data not shown).
Discussion
In this study, we attempted to identify a susceptibility gene for bipolar disorder using a high density SNP association scan of the region surrounding a linkage peak at D22S278. Two independent family samples showed evidence of association to haplotypes near the genes stargazin (CACNG2), intraflagellar transport protein homolog 27 (IFT27, previously designated RABL4) and parvalbumin (PVALB). These results were further replicated by finding significant association to overlapping haplotypes in an independent case control sample. Analyses using LAMP, however, identified a different haplotype on the 3′ end of CACNG2, and little support for the region near IFT27. Furthermore, no evidence for association was found in a large GWAS dataset that included subjects from the case control replication sample. This region has been previously implicated in both schizophrenia and psychotic bipolar disorder, however, we found no evidence for association specifically to psychotic bipolar cases.
This study has several limitations. The family study sample size, even when both phases were combined, has limited power to detect loci of modest effect such as those that have been seen in most recent GWAS of BD. Though evidence for association in this region was found in three independent samples, this was not replicated in the BiGS GWAS dataset. This non-replication may be the result of real clinical differences between subject populations. The family sample was ascertained for a bipolar proband and the availability of other family members for linkage studies. The case control replication sample also included a large portion of cases with strong family histories. However, the BiGS GAIN/TGEN sample primarily included subjects from wave 5 of the NIMH Genetics Initiative consortium who were ascertained as individual unrelated cases and in general did not have as strong a family history. We have separately analyzed the clinical characteristics of these groups and found that the wave 5 sample shows twice the rate of comorbid anxiety disorders and substance use disorders than the family sample, suggesting that these two samples may be genetically different [Greenwood et al., 2009].
Another limitation regards inconsistency in associated haplotypes. The flip in odds ratios in the PLINK analyses (from increased risk to “protective”) between the most significant (but not statistically significant) family study phase 1 haplotype to the statistically significant phase 2 haplotype of the family study may weaken the strength of the result. However, this may be explained by the presence of multiple functional variants in the region. Additionally, the most significant result in this region is a rare three SNP haplotype that was not present in the families used for the original linkage study. This also may suggest allelic heterogeneity. Furthermore, support for this region was replicated in the case control replication sample by significant association of two haplotype windows using the omnibus test that considers all haplotypes in each window.
The analyses of the family samples using LAMP was not consistent with the results from PLINK. The LAMP analyses found little support for the region 5′ of CACNG2, however, LAMP did yield the most significant result in the study, a 4 SNP haplotype immediately 3′ of CACNG2. It is not clear how to interpret this discrepancy. If there are different susceptibility alleles in this region, then LAMP may have detected a different allele by accessing additional information from the families. Though not consistent with PLINK, the LAMP results do provide additional support for a BD locus in this region, and shift that evidence towards the CACNG2 gene.
The results must be further qualified because of the large number of multiple statistical tests conducted. The high level of correlation between the SNPs and haplotypes resulting from linkage disequilibrium in the region make it difficult to determine the appropriate correction. We employed the method of Nyholt which corrects for the correlation between markers to estimate the equivalent number of independent tests and corresponding threshold for significance [Nyholt, 2004].
We compared our results in this region to those of the Psychiatric GWAS Consortium for Bipolar Disorder (PGC–BD). The PGC is a large consortium whose goal is to conduct combined analyses of GWAS data for several psychiatric illnesses. The PGC –BD recently published the results of a combined analysis of 11 studies and 7,481 bipolar I cases [Sklar et al., 2011]. These results provided at best modest support for our results. Two SNPs in the CACNG2 gene showed modest though non-significant evidence of association (P = 0.01) to bipolar disorder.
The most significant result of the PLINK analysis was a rare three SNP haplotype (rs5756339|rs4821523|rs2009667, P = 8.89 × 10⁻⁶) overlapping the gene IFT27. Relatively little is known about this gene’s function. Previously known as RABL4 (RAB, member of RAS oncogene family-like 4), IFT27 is a 294 aa protein encoded by a 17 kb gene composed of seven exons. It encodes a putative GTP-binding protein similar to RAY/RAB1C. The protein is ras-related, but the function is unknown. IFT27 is expressed moderately in brain with multiple splicing variants predicted based on sequenced cDNA (16 total variants with four alternative promoters). Recently, IFT27’s homolog in Chlamydomonas reinhardtii was implicated in cilium function and cell cycle control [Qin et al., 2007].
Flanking IFT27 are two genes that have both been presented for potential roles in psychiatric illness—CACNG2 and PVALB. As seen in Figure 2, the associated haplotypes from the PLINK analysis span IFT27 and PVALB, as well as, a region just 5′ of CACNG2. Therefore, it is difficult for association methods to clearly rule out these genes. Parvalbumin (PVALB) is a 110 aa protein encoded by a 19 kb gene composed of five exons. It is a high affinity calcium–ion binding protein. It is expressed in high levels in fast-contracting muscles and at lower levels in brain and endocrine tissues. In the cerebral cortex, PVLAB is co-localized with GABA in a subpopulation of nonpyramidal cells [DeFelipe, 1997]. It is believed that PVALB is involved in regulating calcium pools critical for synaptic plasticity [Schwaller et al., 2002]. Recently, a reduction in PVALB mRNA was reported in the prefrontal cortex of schizophrenia patients [Hashimoto et al., 2003].
The study’s most significant result is immediately 3′ of Stargazin (CACNG2). Stargazin is a 323 aa protein encoded by a 120 kb gene composed of four exons. It was identified originally in a spontaneous mouse mutant, stargazer, which exhibited repeated head elevations, ataxia, and epilepsy, in addition to hyperactivity and agitated circling with environmental stimulus [Noebels et al., 1990]. Subsequently, two other spontaneous mutants of CACNG2 have been discovered—waggler and stargazer-3J [Letts et al., 1998, 2003]. The stargazin mutations all arose as early transposon insertions in the first or second intron [Letts et al., 2003]. Since its discovery, many functions have been suggested for stargazin, including that of voltage dependent calcium channel subunit [Letts et al., 1998], involvement in cell–cell communication/connections [Tomita et al., 2001], and a role in glutamatergic AMPA receptor interactions such as trafficking receptors to the membrane, targeting receptors to the synapse, and modulating receptor function [Chen et al., 1999; Hashimoto et al., 1999]. Stargazin is expressed solely in the central nervous system and expressed abundantly in the cerebellum, cerebral cortex, occipital lobe, frontal lobe, temporal lobe, hippocampus, and thalamus.
Recent work suggests that antidepressants and mood stabilizers may alter membrane and synaptic expression of stargazin and AMPA receptors that interact with it. After chronic treatment with antidepressants desipramine or paroxetine, increased membrane levels of stargazin complexed with AMPA receptor subunit GluR1 were observed in the hippocampus [Martinez-Turrillas et al., 2007]. Conversely, the mood stabilizers lithium and valproate decreased synaptic expression of the GluR1 and GluR2 subunits in the hippocampus [Du et al., 2004, 2007]. Additionally, overexpression of CACNG2 in the dorsolateral prefrontal cortex was observed in post mortem samples of bipolar disorder patients [Silberberg et al., 2008]. Moreover, in the same study, three SNPs spanning CACNG2 promoter/intron 1 were found to be associated with lithium response. Additionally, a 4 SNP haplotype in stargazin was also recently reported to be associated with schizophrenia patients who showed no deficits in executive function [Liu et al., 2008].
In this study, we have attempted to identify a susceptibility gene for bipolar disorder in a region near the microsatellite marker D22S278 previously implicated through linkage studies [Mujaheed et al., 2000; Kelsoe et al., 2001; Potash et al., 2003]. Results suggest that haplotypes overlapping IFT27, PVALB and the 5′ region of CACNG2, as well as a haplotype 3′ of CACNG2 are associated. However, the inconsistency in results between samples and analysis methods limit clear conclusions. It has been suggested that synthetic associations may occur when multiple rare causal variants are present [Dickson et al., 2010]. This study’s results cannot rule out the possibility that variants in more than one gene may be involved. Together these results suggest that one or more susceptibility variants may exist in the region of these three genes near our original linkage peak. Our association analyses were unable to clearly identify one of these as the most likely vulnerability gene. These results support the need for deep sequencing studies in this region to identify possible susceptibility variants.
Acknowledgments
We thank the participants in the study, without whom this work would not be possible. Support was provided to S.N. and S.L. by the NIH-sponsored UCSD Genetics Training Program (GM08666). This work was also supported by grants to J.R.K. from the NIMH and NHGRI (MH68503, MH078151, MH081804, MH059567 supplement) and by the Genetic Association Information Network (GAIN) and the UCSD General Clinical Research Center (M01 RR00827). Subjects in the UCSD family sample were collected in part by Paul Keck, MD and Susan McElroy, M.D. of the U. of Cincinnati; and Ronald Remick, M.D. and A. Dessa Sadovnick, Ph.D. of the University of British Columbia.
Data and biomaterials were collected in four projects that participated in the National Institute of Mental Health (NIMH) Bipolar Disorder Genetics Initiative. From 1991 to 1998, the Principal Investigators and Co-Investigators were: Indiana University, Indianapolis, IN, U01 MH46282, John Nurnberger, M.D., Ph.D., Marvin Miller, M.D., and Elizabeth Bowman, M.D.; Washington University, St. Louis, MO, U01 MH46280, Theodore Reich, M.D., Allison Goate, Ph.D., and John Rice, Ph.D.; Johns Hopkins University, Baltimore, MD U01 MH46274, J. Raymond DePaulo, Jr., M.D., Sylvia Simpson, M.D., MPH, and Colin Stine, Ph.D.; NIMH Intramural Research Program, Clinical Neurogenetics Branch, Bethesda, MD, Elliot Gershon, M.D., Diane Kazuba, B.A., and Elizabeth Maxwell, M.S.W.
Data and biomaterials were collected as part of ten projects that participated in the National Institute of Mental Health (NIMH) Bipolar Disorder Genetics Initiative. From 1999 to 2007, the Principal Investigators and Co-Investigators were: Indiana University, Indianapolis, IN, R01 MH59545, John Nurnberger, M.D., Ph.D., Marvin J. Miller, M.D., Elizabeth S. Bowman, M.D., N. Leela Rau, M.D., P. Ryan Moe, M.D., Nalini Samavedy, M.D., Rif El-Mallakh, M.D. (at University of Louisville), Husseini Manji, M.D. (at Wayne State University), Debra A. Glitz, M.D. (at Wayne State University), Eric T. Meyer, M.S., Carrie Smiley, R.N., Tatiana Foroud, Ph.D., Leah Flury, M.S., Danielle M. Dick, Ph.D., Howard Edenberg, Ph.D.; Washington University, St. Louis, MO, R01 MH059534, John Rice, Ph.D., Theodore Reich, M.D., Allison Goate, Ph.D., Laura Bierut, M.D.; Johns Hopkins University, Baltimore, MD, R01 MH59533, Melvin McInnis M.D., J. Raymond DePaulo, Jr., M.D., Dean F. MacKinnon, M.D., Francis M. Mondimore, M.D., James B. Potash, M.D., Peter P. Zandi, Ph.D., Dimitrios Avramopoulos, and Jennifer Payne; University of Pennsylvania, PA, R01 MH59553, Wade Berrettini M.D., Ph.D.; University of California at Irvine, CA, R01 MH60068, William Byerley M.D., and Mark Vawter M.D.; University of Iowa, IA, R01 MH059548, William Coryell M.D., and Raymond Crowe M.D.; University of Chicago, IL, R01 MH59535, Elliot Gershon, M.D., Judith Badner Ph.D., Francis McMahon M.D., Chunyu Liu Ph.D., Alan Sanders M.D., Maria Caserta, Steven Dinwiddie M.D., Tu Nguyen, Donna Harakal; University of California at San Diego, CA, R01 MH59567, John Kelsoe, M.D., Rebecca McKinney, B.A.; Rush University, IL, R01 MH059556, William Scheftner M.D., Howard M. Kravitz, D.O., M.P.H., Diana Marta, B.S., Annette Vaughn-Brown, MSN, RN, and Laurie Bederow, MA; NIMH Intramural Research Program, Bethesda, MD, 1Z01MH002810-01, Francis J. McMahon, M.D., LaylaKassem, PsyD, Sevilla Detera-Wadleigh, Ph.D., Lisa Austin, Ph.D., Dennis L. Murphy, M.D.
References
- Badner JA, Gershon ES. Meta-analysis of whole-genome linkage scans of bipolar disorder and schizophrenia. Mol Psychiatry. 2002;7(4):405–411. doi: 10.1038/sj.mp.4001012. [DOI] [PubMed] [Google Scholar]
- Chen L, Bao S, Qiao X, Thompson RF. Impaired cerebellar synapse maturation in waggler, a mutant mouse with a disrupted neuronal calcium channel gamma subunit. Proc Natl Acad Sci USA. 1999;96(21):12132–12137. doi: 10.1073/pnas.96.21.12132. [DOI] [PMC free article] [PubMed] [Google Scholar]
- DeFelipe J. Types of neurons, synaptic connections and chemical characteristics of cells immunoreactive for calbindin-D28K, parvalbumin and calretinin in the neocortex. J Chem Neuroanat. 1997;14(1):1–19. doi: 10.1016/s0891-0618(97)10013-8. [DOI] [PubMed] [Google Scholar]
- Dick DM, Foroud T, Flury L, Bowman ES, Miller MJ, Rau NL, Moe PR, Samavedy N, El-Mallakh R, Manji H, Glitz DA, Meyer ET, Smiley C, Hahn R, Widmark C, McKinney R, Sutton L, Ballas C, Grice D, Berrettini W, Byerley W, Coryell W, DePaulo R, MacKinnon DF, Gershon ES, Kelsoe JR, McMahon FJ, McInnis M, Murphy DL, Reich T, Scheftner W, Nurnberger JI., Jr Genomewide linkage analyses of bipolar disorder: A new sample of 250 pedigrees from the National Institute of Mental Health Genetics Initiative. Am J Hum Genet. 2003;73(1):107–114. doi: 10.1086/376562. [DOI] [PMC free article] [PubMed] [Google Scholar]
- Dickson SP, Wang K, Krantz I, Hakonarson H, Goldstein DB. Rare variants create synthetic genome-wide associations. PLoS Biol. 2010;8(1):e1000294. doi: 10.1371/journal.pbio.1000294. [DOI] [PMC free article] [PubMed] [Google Scholar]
- Du J, Gray NA, Falke CA, Chen W, Yuan P, Szabo ST, Einat H, Manji HK. Modulation of synaptic plasticity by antimanic agents: The role of AMPA glutamate receptor subunit 1 synaptic expression. J Neurosci. 2004;24(29):6578–6589. doi: 10.1523/JNEUROSCI.1258-04.2004. [DOI] [PMC free article] [PubMed] [Google Scholar]
- Du J, Suzuki K, Wei Y, Wang Y, Blumenthal R, Chen Z, Falke C, Zarate CA, Jr, Manji HK. The anticonvulsants lamotrigine, riluzole, and valproate differentially regulate AMPA receptor membrane localization: Relationship to clinical effects in mood disorders. Neuropsychopharmacology. 2007;32(4):793–802. doi: 10.1038/sj.npp.1301178. [DOI] [PubMed] [Google Scholar]
- Goodwin FK, Jamison KR. Manic-depressive illness. Oxford: Oxford University Press; 2007. [Google Scholar]
- Greenwood TA, McKinney R, Kelsoe JR Bipolar Genome Study (BiGS) Genome-Wide Association Study of Irritable Versus Elated Mania in a Larger Sample Provides Further Evidence for Genetic Differences Between Clinical Subforms of Bipolar Disorder. World Congress on Psychiatric Genetics; San Diego. 2009. [Google Scholar]
- Hashimoto K, Fukaya M, Qiao X, Sakimura K, Watanabe M, Kano M. Impairment of AMPA receptor function in cerebellar granule cells of ataxic mutant mouse stargazer. J Neurosci. 1999;19(14):6027–6036. doi: 10.1523/JNEUROSCI.19-14-06027.1999. [DOI] [PMC free article] [PubMed] [Google Scholar]
- Hashimoto T, Volk DW, Eggan SM, Mirnics K, Pierri JN, Sun Z, Sampson AR, Lewis DA. Gene expression deficits in a subclass of GABA neurons in the prefrontal cortex of subjects with schizophrenia. J Neurosci. 2003;23(15):6315–6326. doi: 10.1523/JNEUROSCI.23-15-06315.2003. [DOI] [PMC free article] [PubMed] [Google Scholar]
- Kelsoe JR, Spence MA, Loetscher E, Foguet M, Sadovnick AD, Remick RA, Flodman P, Khristich J, Mroczkowski-Parker Z, Brown JL, Masser D, Ungerleider S, Rapaport MH, Wishart WL, Luebbert H. A genome survey indicates a possible susceptibility locus for bipolar disorder on chromosome 22. Proc Natl Acad Sci USA. 2001;98(2):585–590. doi: 10.1073/pnas.011358498. [DOI] [PMC free article] [PubMed] [Google Scholar]
- Kieseppa T, Partonen T, Haukka J, Kaprio J, Lonnqvist J. High concordance of bipolar I disorder in a nationwide sample of twins. Am J Psychiatry. 2004;161(10):1814–1821. doi: 10.1176/ajp.161.10.1814. [DOI] [PubMed] [Google Scholar]
- Letts VA, Felix R, Biddlecome GH, Arikkath J, Mahaffey CL, Valenzuela A, Bartlett FS, II, Mori Y, Campbell KP, Frankel WN. The mouse stargazer gene encodes a neuronal Ca2+-channel gamma subunit. Nat Genet. 1998;19(4):340–347. doi: 10.1038/1228. [DOI] [PubMed] [Google Scholar]
- Letts VA, Kang MG, Mahaffey CL, Beyer B, Tenbrink H, Campbell KP, Frankel WN. Phenotypic heterogeneity in the stargazin allelic series. Mamm Genome. 2003;14(8):506–513. doi: 10.1007/s00335-003-2268-x. [DOI] [PubMed] [Google Scholar]
- Li M, Boehnke M, Abecasis GR. Joint modeling of linkage and association: Identifying SNPs responsible for a linkage signal. Am J Hum Genet. 2005;76(6):934–949. doi: 10.1086/430277. [DOI] [PMC free article] [PubMed] [Google Scholar]
- Liu YL, Fann CS, Liu CM, Chen WJ, Wu JY, Hung SI, Chen CH, Jou YS, Liu SK, Hwang TJ, Hsieh MH, Chang CC, Yang WC, Lin JJ, Chou FH, Faraone SV, Tsuang MT, Hwu HG. RASD2, MYH9, and CACNG2 genes at chromosome 22q12 associated with the subgroup of schizophrenia with non-deficit in sustained attention and executive function. Biol Psychiatry. 2008;64(9):789–796. doi: 10.1016/j.biopsych.2008.04.035. [DOI] [PubMed] [Google Scholar]
- Martinez-Turrillas R, Del Rio J, Frechilla D. Neuronal proteins involved in synaptic targeting of AMPA receptors in rat hippocampus by antidepressant drugs. Biochem Biophys Res Commun. 2007;353(3):750–755. doi: 10.1016/j.bbrc.2006.12.078. [DOI] [PubMed] [Google Scholar]
- McQueen MB, Devlin B, Faraone SV, Nimgaonkar VL, Sklar P, Smoller JW, Abou Jamra R, Albus M, Bacanu SA, Baron M, Barrett TB, Berrettini W, Blacker D, Byerley W, Cichon S, Coryell W, Craddock N, Daly MJ, Depaulo JR, Edenberg HJ, Foroud T, Gill M, Gilliam TC, Hamshere M, Jones I, Jones L, Juo SH, Kelsoe JR, Lambert D, Lange C, Lerer B, Liu J, Maier W, Mackinnon JD, McInnis MG, McMahon FJ, Murphy DL, Nothen MM, Nurnberger JI, Pato CN, Pato MT, Potash JB, Propping P, Pulver AE, Rice JP, Rietschel M, Scheftner W, Schumacher J, Segurado R, Van Steen K, Xie W, Zandi PP, Laird NM. Combined analysis from eleven linkage studies of bipolar disorder provides strong evidence of susceptibility loci on chromosomes 6q and 8q. Am J Hum Genet. 2005;77(4):582–595. doi: 10.1086/491603. [DOI] [PMC free article] [PubMed] [Google Scholar]
- Moises HW, Yang L, Li T, Havsteen B, Fimmers R, Baur MP, Liu X, Gottesman II. Potential linkage disequilibrium between schizophrenia and locus D22S278 on the long arm of chromosome 22. Am J Med Genet. 1995;60(5):465–467. doi: 10.1002/ajmg.1320600521. [DOI] [PubMed] [Google Scholar]
- Mujaheed M, Corbex M, Lichtenberg P, Levinson DF, Deleuze JF, Mallet J, Ebstein RP. Evidence for linkage by transmission disequilibrium test analysis of a chromosome 22 microsatellite marker D22S278 and bipolar disorder in a Palestinian Arab population. Am J Med Genet. 2000;96(6):836–838. [PubMed] [Google Scholar]
- Noebels JL, Qiao X, Bronson RT, Spencer C, Davisson MT. Stargazer: A new neurological mutant on chromosome 15 in the mouse with prolonged cortical seizures. Epilepsy Res. 1990;7(2):129–135. doi: 10.1016/0920-1211(90)90098-g. [DOI] [PubMed] [Google Scholar]
- Nurnberger JI, Jr, Blehar MC, Kaufmann CA, York-Cooler C, Simpson SG, Harkavy-Friedman J, Severe JB, Malaspina D, Reich T. Diagnostic interview for genetic studies. Rationale, unique features, and training. NIMH Genetics Initiative. Arch Gen Psychiatry. 1994;51(11):849–859. doi: 10.1001/archpsyc.1994.03950110009002. discussion 863–864. [DOI] [PubMed] [Google Scholar]
- Nurnberger J, DePaulo J, Gershon E, Reich T, Blehar M, Edenberg H, Foroud T, Miller M, Bowman E, Mayeda A, Rau N, Smiley C, Conneally P, McMahon FJ, Meyers D, Simpson S, McInnis M, Stine O, Detera-Wadleigh SD, Goldin L, Guroff J, Maxwell E, Kazuba D, Gejman P, Badner J, Sanders A, Rice J, Bierut L, Goate A. Genomic survey of bipolar illness in the NIMH genetics initiative pedigrees: A preliminary report. Am J Med Genet. 1997;74(3):227–237. doi: 10.1002/(sici)1096-8628(19970531)74:3<227::aid-ajmg1>3.0.co;2-n. [DOI] [PubMed] [Google Scholar]
- Nyholt DR. A simple correction for multiple testing for single-nucleotide polymorphisms in linkage disequilibrium with each other. Am J Hum Genet. 2004;74(4):765–769. doi: 10.1086/383251. [DOI] [PMC free article] [PubMed] [Google Scholar]
- O’Donovan MC, Craddock N, Norton N, Williams H, Peirce T, Moskvina V, Nikolov I, Hamshere M, Carroll L, Georgieva L, Dwyer S, Holmans P, Marchini JL, Spencer CC, Howie B, Leung HT, Hartmann AM, Moller HJ, Morris DW, Shi Y, Feng G, Hoffmann P, Propping P, Vasilescu C, Maier W, Rietschel M, Zammit S, Schumacher J, Quinn EM, Schulze TG, Williams NM, Giegling I, Iwata N, Ikeda M, Darvasi A, Shifman S, He L, Duan J, Sanders AR, Levinson DF, Gejman PV, Cichon S, Nothen MM, Gill M, Corvin A, Rujescu D, Kirov G, Owen MJ, Buccola NG, Mowry BJ, Freedman R, Amin F, Black DW, Silverman JM, Byerley WF, Cloninger CR. Identification of loci associated with schizophrenia by genome-wide associationand follow -up. Nat Genet. 2008;40(9):1053–1055. doi: 10.1038/ng.201. [DOI] [PubMed] [Google Scholar]
- Potash JB, Zandi PP, Willour VL, Lan TH, Huo Y, Avramopoulos D, Shugart YY, MacKinnon DF, Simpson SG, McMahon FJ, DePaulo JR, Jr, McInnis MG. Suggestive linkage to chromosomal regions 13q31 and 22q12 in families with psychotic bipolar disorder. Am J Psychiatry. 2003;160(4):680–686. doi: 10.1176/appi.ajp.160.4.680. [DOI] [PubMed] [Google Scholar]
- Purcell S, Neale B, Todd-Brown K, Thomas L, Ferreira MA, Bender D, Maller J, Sklar P, de Bakker PI, Daly MJ, Sham PC. PLINK: A tool set for whole-genome association and population-based linkage analyses. Am J Hum Genet. 2007;81(3):559–575. doi: 10.1086/519795. [DOI] [PMC free article] [PubMed] [Google Scholar]
- Qin H, Wang Z, Diener D, Rosenbaum J. Intraflagellar transport protein 27 is a small G protein involved in cell-cycle control. Curr Biol. 2007;17(3):193–202. doi: 10.1016/j.cub.2006.12.040. [DOI] [PMC free article] [PubMed] [Google Scholar]
- Schwaller B, Meyer M, Schiffmann S. ‘New’ functions for ‘old’ proteins: The role of the calcium-binding proteins calbindin D-28k, calretinin and parvalbumin, in cerebellar physiology. Studies with knockout mice. Cerebellum. 2002;1(4):241–258. doi: 10.1080/147342202320883551. [DOI] [PubMed] [Google Scholar]
- Segurado R, Detera-Wadleigh SD, Levinson DF, Lewis CM, Gill M, Nurnberger JI, Jr, Craddock N, DePaulo JR, Baron M, Gershon ES, Ekholm J, Cichon S, Turecki G, Claes S, Kelsoe JR, Schofield PR, Badenhop RF, Morissette J, Coon H, Blackwood D, McInnes LA, Foroud T, Edenberg HJ, Reich T, Rice JP, Goate A, McInnis MG, McMahon FJ, Badner JA, Goldin LR, Bennett P, Willour VL, Zandi PP, Liu J, Gilliam C, Juo SH, Berrettini WH, Yoshikawa T, Peltonen L, Lonnqvist J, Nothen MM, Schumacher J, Windemuth C, Rietschel M, Propping P, Maier W, Alda M, Grof P, Rouleau GA, Del-Favero J, Van Broeckhoven C, Mendlewicz J, Adolfsson R, Spence MA, Luebbert H, Adams LJ, Donald JA, Mitchell PB, Barden N, Shink E, Byerley W, Muir W, Visscher PM, Macgregor S, Gurling H, Kalsi G, McQuillin A, Escamilla MA, Reus VI, Leon P, Freimer NB, Ewald H, Kruse TA, Mors O, Radhakrishna U, Blouin JL, Antonarakis SE, Akarsu N. Genome scan meta-analysis of schizophrenia and bipolar disorder, part III: Bipolar disorder. Am J Hum Genet. 2003;73(1):49–62. doi: 10.1086/376547. [DOI] [PMC free article] [PubMed] [Google Scholar]
- Silberberg G, Levit A, Collier D, St Clair D, Munro J, Kerwin RW, Tondo L, Floris G, Breen G, Navon R. Stargazin involvement with bipolar disorder and response to lithium treatment. Pharmacogenet Genomics. 2008;18(5):403–412. doi: 10.1097/FPC.0b013e3282f974ca. [DOI] [PubMed] [Google Scholar]
- Sklar P, Ripke S, Scott LJ, Andreassen OA, Cichon S, Craddock N, Edenberg HJ, Nurnberger JI, Jr, Rietschel M, Blackwood D, Corvin A, Flickinger M, Guan W, Mattingsdal M, McQuillin A, Kwan P, Wienker TF, Daly M, Dudbridge F, Holmans PA, Lin D, Burmeister M, Greenwood TA, Hamshere ML, Muglia P, Smith EN, Zandi PP, Nievergelt CM, McKinney R, Shilling PD, Schork NJ, Bloss CS, Foroud T, Koller DL, Gershon ES, Liu C, Badner JA, Scheftner WA, Lawson WB, Nwulia EA, Hipolito M, Coryell W, Rice J, Byerley W, McMahon FJ, Schulze TG, Berrettini W, Lohoff FW, Potash JB, Mahon PB, McInnis MG, Zollner S, Zhang P, Craig DW, Szelinger S, Barrett TB, Breuer R, Meier S, Strohmaier J, Witt SH, Tozzi F, Farmer A, McGuffin P, Strauss J, Xu W, Kennedy JL, Vincent JB, Matthews K, Day R, Ferreira MA, O’Dushlaine C, Perlis R, Raychaudhuri S, Ruderfer D, Hyoun PL, Smoller JW, Li J, Absher D, Thompson RC, Meng FG, Schatzberg AF, Bunney WE, Barchas JD, Jones EG, Watson SJ, Myers RM, Akil H, Boehnke M, Chambert K, Moran J, Scolnick E, Djurovic S, Melle I, Morken G, Gill M, Morris D, Quinn E, Muhleisen TW, Degenhardt FA, Mattheisen M, Schumacher J, Maier W, Steffens M, Propping P, Nothen MM, Anjorin A, Bass N, Gurling H, Kandaswamy R, Lawrence J, McGhee K, McIntosh A, McLean AW, Muir WJ, Pickard BS, Breen G, St Clair D, Caesar S, Gordon-Smith K, Jones L, Fraser C, Green EK, Grozeva D, Jones IR, Kirov G, Moskvina V, Nikolov I, O’Donovan MC, Owen MJ, Collier DA, Elkin A, Williamson R, Young AH, Ferrier IN, Stefansson K, Stefansson H, Thornorgeirsson T, Steinberg S, Gustafsson O, Bergen SE, Nimgaonkar V, Hultman C, Landen M, Lichtenstein P, Sullivan P, Schalling M, Osby U, Backlund L, Frisen L, Langstrom N, Jamain S, Leboyer M, Etain B, Bellivier F, Petursson H, Sigur Sson E, Muller-Mysok B, Lucae S, Schwarz M, Schofield PR, Martin N, Montgomery GW, Lathrop M, Oskarsson H, Bauer M, Wright A, Mitchell PB, Hautzinger M, Reif A, Kelsoe JR, Purcell SM. Large-scale genome-wide association analysis of bipolar disorder identifies a new susceptibility locus near ODZ4. Nat Genet. 2011;43(10):977–983. doi: 10.1038/ng.943. [DOI] [PMC free article] [PubMed] [Google Scholar]
- Smith EN, Bloss CS, Badner JA, Barrett T, Belmonte PL, Berrettini W, Byerley W, Coryell W, Craig D, Edenberg HJ, Eskin E, Foroud T, Gershon E, Greenwood TA, Hipolito M, Koller DL, Lawson WB, Liu C, Lohoff F, McInnis MG, McMahon FJ, Mirel DB, Murray SS, Nievergelt C, Nurnberger J, Nwulia EA, Paschall J, Potash JB, Rice J, Schulze TG, Scheftner W, Panganiban C, Zaitlen N, Zandi PP, Zollner S, Schork NJ, Kelsoe JR. Genome-wide association study of bipolar disorder in European American and African American individuals. Mol Psychiatry. 2009;14(8):755–763. doi: 10.1038/mp.2009.43. [DOI] [PMC free article] [PubMed] [Google Scholar]
- Smith EN, Koller DL, Panganiban C, Szelinger S, Zhang P, Badner JA, Barrett TB, Berrettini WH, Bloss CS, Byerley W, Coryell W, Edenberg HJ, Foroud T, Gershon ES, Greenwood TA, Guo Y, Hipolito M, Keating BJ, Lawson WB, Liu C, Mahon PB, McInnis MG, McMahon FJ, McKinney R, Murray SS, Nievergelt CM, Nurnberger JI, Jr, Nwulia EA, Potash JB, Rice J, Schulze TG, Scheftner WA, Shilling PD, Zandi PP, Zöllner S, Craig DW, Schork NJ, Kelsoe JR. Genome-wide association of bipolar disorder suggests an enrichment of replicable associations in regions near genes. PLoS Genet. 2011;7(6):e1002134. doi: 10.1371/journal.pgen.1002134. [DOI] [PMC free article] [PubMed] [Google Scholar]
- Smoller JW, Finn CT. Family, twin, and adoption studies of bipolar disorder. Am J Med Genet C Semin Med Genet. 2003;123C(1):48–58. doi: 10.1002/ajmg.c.20013. [DOI] [PubMed] [Google Scholar]
- Tomita S, Nicoll RA, Bredt DS. PDZ protein interactions regulating glutamate receptor function and plasticity. J Cell Biol. 2001;153(5):F19–F24. doi: 10.1083/jcb.153.5.f19. [DOI] [PMC free article] [PubMed] [Google Scholar]
- Tsuang MT, Faraone SV. The genetics of mood disorders. Baltimore: Johns Hopkins University Press; 1990. [Google Scholar]
- Vallada HP, Gill M, Sham P, Lim LC, Nanko S, Asherson P, Murray RM, McGuffin P, Owen M, Collier D. Linkage studies on chromosome 22 in familial schizophrenia. Am J Med Genet. 1995;60(2):139–146. doi: 10.1002/ajmg.1320600210. [DOI] [PubMed] [Google Scholar]
- Williams NM, Jones LA, Murphy KC, Cardno AG, Asherson P, Williams J, McGuffin P, Owen MJ. No evidence for an allelic association between schizophrenia and markers D22S278 and D22S283. Am J Med Genet. 1997;74(1):37–39. doi: 10.1002/(sici)1096-8628(19970221)74:1<37::aid-ajmg8>3.0.co;2-s. [DOI] [PubMed] [Google Scholar]
- Wray NR, Gottesman II. Using summary data from the Danish National Registers to Estimate Heritabilities for Schizophrenia, Bipolar Disorder, and Major Depressive Disorder. Front Genet. 2012;3:118. doi: 10.3389/fgene.2012.00118. [DOI] [PMC free article] [PubMed] [Google Scholar]