

Abstract
Procainamide, a type I antiarrhythmic agent, is used to treat a variety of atrial and ventricular dysrhythmias. It was reported that long-term therapy with procainamide may cause lupus erythematosus in 25–30% of patients. Interestingly, procainamide does not induce lupus erythematosus in mouse models. To explore the differences in this side-effect of procainamide between humans and mouse models, metabolomic analysis using ultra-performance liquid chromatography coupled with electrospray ionization quadrupole time-of-flight mass spectrometry (UPLC-ESI-QTOFMS) was conducted on urine samples from procainamide-treated humans, CYP2D6-humanized mice, and wild-type mice. Thirteen urinary procainamide metabolites, including nine novel metabolites, derived from P450-dependent, FMO-dependent oxidations and acylation reactions, were identified and structurally elucidated. In vivo metabolism of procainamide in CYP2D6-humanized mice as well as in vitro incubations with microsomes and recombinant P450s suggested that human CYP2D6 plays a major role in procainamide metabolism. Significant differences in N-acylation and N-oxidation of the drug between humans and mice largely account for the interspecies differences in procainamide metabolism. Significant levels of the novel N-oxide metabolites produced by FMO1 and FMO3 in humans might be associated with the development of procainamide-induced systemic lupus erythematosus. Observations based on this metabolomic study offer clues to understanding procainamide-induced lupus in humans and the effect of P450s and FMOs on procainamide N-oxidation.
Keywords: Procainamide, Systemic lupus erythematosus, Metabolomics, N-Oxidation, Ultra-performance liquid chromatography, Time-of-flight mass spectrometry
1. Introduction
Procainamide, an effective type I antiarrhythmic agent, is used to treat a variety of atrial and ventricular dysrhythmias. Procainamide was developed over 40 years ago to increase the effective refractory period of the atria, and to a lesser extent, the bundle of His–Purkinje system and ventricles of the heart [1–3]. Procainamide is rapidly absorbed in the body with plasma levels peaking 15–60 min after intravenous or oral administration [4]. Nearly one-half of the administered procainamide dose is eliminated unchanged in the urine [5], and the acetylated metabolite N-acetylprocainamide with antiarrhythmic activity is the major metabolite generated by the polymorphic N-acetyltransferase 2 (NAT2) in vivo[6,7]. Procainamide and N-acetylprocainamide can be further dealkylated into the desethylprocainamide and N-acetyl-desethylprocainamide [8]. Another important metabolite, procainamide hydroxylamine, is produced by N-hydroxylation of the primary aromatic amine in vivo and in vitro[9–11]. Several studies suggested that the CYP2D6 is responsible for procainamide N-hydroxylation [11,12]. Other minor metabolites were also reported, such as 4-aminobenzoic acid [13], nitroprocainamide [14], and nitrosoprocainamide [15]. In addition, previous studies reported that procainamide could specifically inhibit the hemimethylase activity of DNA methyltransferase 1 (DNMT1), suggesting that procainamide might be of value in the prevention of cancer [16,17].
Procainamide is limited in its application due to the relatively high incidence (25–30%) of procainamide-induced lupus [18–20]. It was proposed that procainamide hydroxylamine and its nitroso derivatives underlie procainamide-induced lupus [21–23]. To a large extent, this side-effect is dependent on the aromatic amino group of procainamide and acylation of this amino group helps block the lupus-inducing effect [24]. It was reported that patients having the rapid acetylator phenotype require a longer period of time to develop lupus than the slow acetylator phenotype [19]. Additionally, N-acetylprocainamide is a less potent inducer of T cell autoreactivity than procainamide [25]. Interestingly, lupus was not induced during treatment with N-acetylprocainamide, suggesting that N-acetylation of procainamide represents a protective pathway [26]. However, procainamide does not induce lupus in animals including dog, pig, mouse, and rat, after treatment for up to 39 weeks [27]. This significant difference between animals and humans suggests that differential metabolism of procainamide may be involved insusceptibility to drug-induced lupus.
Despite the large number of published studies on procainamide metabolism and the effect of its metabolites on immune function, the mechanism by which lupus is induced by procainamide in humans and not animal models, remains unclear. Here, a comprehensive comparative analysis of procainamide metabolism in humans, CYP2D6-humanized mice, and wild-type mice was undertaken using ultra-performance chromatography coupled with electrospray ionization quadrupole time of-flight mass spectrometry (UPLC-ESI-QTOFMS)-based metabolomics, which has proven successful in studies to uncover novel metabolites of ifosfamide [28], cyclophosphamide [28], and thioTEPA [29]. The present study sheds new light on the metabolic pathways of procainamide in vivo, and reveals metabolic differences between human and mice that might contribute to our understanding of the mechanisms underlying the side-effects of procainamide in the clinic.
2. Materials and methods
2.1. Chemicals and reagents
The procainamide used in the human study was Pronestyl SR purchased from Bristol-Myers Squibb Company (New York, NY). Procainamide hydrochloride used in the mouse study, and NADPH were purchased from Sigma (St. Louis, MO). HPLC-grade solvents (acetonitrile and water) were purchased from Fisher Scientific (Hampton, NH). Recombinant human P450s and flavin-containing monooxygenases (FMO) were obtained from BD Biosciences (San Jose, CA).
2.2. Synthesis and chemical reduction of N-oxide metabolites of procainamide
For purposes of validation of procainamide N-oxide in urine, authentic procainamide N-oxide was prepared by a modification of a published method [30]. A solution of procainamide hydrochloride (1.0 g) in diluted ammonium hydroxide (pH 9) was extracted with chloroform (5 × 2 ml). The extracts were combined and dried down in nitrogen at room temperature. Part of the resultant residue (100 mg) was dissolved in chloroform (0.5 ml) and treated with 39% (v/v) peroxyacetic acid (200 mg) drop-wise during 30-min. After 2 h, the mixture was analyzed by UPLC-ESI-QTOFMS following 1:10,000 dilution. To further determine the N-oxide metabolite of procainamide in urine, TiCl3 was used for chemical reduction of procainamide N-oxide and N-acetylprocainamide N-oxide [31]. A100 μl aliquot of urine was treated with ice-cold TiCl3 in HCl (10 μl) and shaken at room temperature for 1 h, and analyzed by UPLC-ESI-QTOFMS.
2.3. In vivo metabolism of procainamide in humans and mice
Ten male and ten female healthy volunteers aged from 20 to 35 years were included in this study. All volunteers were evaluated by clinicians before and during the study to ensure they remained in good health during the course of the study. The study was originally conceived and designed to test the effects of high and low salt diets on DNA methylation. Therefore, an aim of the study containing procainamide treatment was included, in order to inhibit DNA methylation. Individuals received an oral dose of procainamide (500–1000 mg) twice daily according to the body weight of the volunteer. This study included three periods. In the first period, procainamide was administrated to the volunteers in normal salt diet from day 1 to day 10. Urine sample was collected at day 10. In the period 2, the volunteers were treated with procainamide in low salt diet from day 11 to day 21, and the urine collection was at day 17 and day 21. In the period 3, the procainamide was given to the volunteers in high salt diet from day 22 to day 28, and urine collection was at day 24 and day 28. Pretreatment urine was collected from the volunteers 2 weeks prior to administration of the drug. Urine collection was at days 1, 3, 7, 10 and 14. All the urine samples used in this study were collected over 24 h. The collected urine sample was immediately stored at −80°C until analysis. The study was approved by the Ethics Commission of the Canton of Bern.
The CYP2D6-humanized mouse line on an FVB/N background was described previously [32] and wild-type mice on the FVB/N background were also used. All animals were maintained under a standard 12 h light/dark cycle with water and food provided ad libitum. Male wild-type and CYP2D6-humanized mice 8- to 10-weeks old, five mice per group, were used for urinary metabolite profiling. Pretreatment urine was collected 1 day before procainamide administration, and then a 10 mg/kg body weight dose of procainamide (dissolved in isotonic saline) was administrated to mice by oral gavage. Control mice were treated with normal saline alone. Urine samples were collected from mice housed in plastic metabolism cages. After a 24 h urine collection, the urines were stored at −80°C until analysis. All animal experiments were conducted in accordance with a protocol approved by the NCI Animal Care and Use Committee.
2.4. In vitro metabolism of procainamide in mouse liver microsomes (MLMs) and human liver microsomes (HLMs)
Mouse liver microsomes (MLMs) were prepared from untreated wild-type (FVB/N mice) and transgenic (hCYP2D6) mouse liver as described previously [33]. Human liver microsomes (HLMs) were purchased from BD Biosciences (San Jose, CA). Microsomal incubations were carried out in 20 mM phosphate-buffered saline (PBS), pH 7.4, containing 0.5 mg/ml microsomal protein, 2 mM MgCl2,20 μM procainamide, and 2 mM freshly prepared NADPH (dissolved in PBS) in a final volume of 200 μl. After a 30-min incubation at 37°C with shaking at 250 rpm, the reaction was stopped by plunging the samples into dry ice. Acetonitrile, 100 μl, was directly added into the 100 μl reaction mix. After centrifuging at 14,000 × g for 20-min, 5 μl of the supernatant was transferred to an autosampler vial.
2.5. In vitro metabolism of procainamide by recombinant human P450s
Reactions were carried out in 20 mM PBS, pH 7.4, containing 0.5 mg/ml recombinant human P450s, 2 mM MgCl2, 20 μM procainamide, and 2 mM freshly prepared NADPH (dissolved in PBS) in a final volume of 200 μl. The recombinant human P450s included CYPs 1A1, 1A2, 1B1, 2A6, 2B6, 2C8, 2C9, 2C19, 2D6, 2E1, 2J12, 3A4, 3A5, 3A7, 4A11 and 4F12 (BD Biosciences, San Jose, CA). After 30 min of incubation at 37°C, samples for UPLC-ESI-QTOFMS analysis were prepared under the same conditions as described above. The kinetics of procainamide hydroxylamine (VI) formation by CYP2D6 were determined by incubating with procainamide in duplicate at 1.0, 2.0, 5.0, 10, 20, 50, 100, and 200 μM. Kinetic parameters (Km) for VI were evaluated by the nonlinear regression (Prism GraphPad 5.0; GraphPad Software Inc., San Diego, CA).
2.6. In vitro metabolism of procainamide by recombinant human FMO isozymes
Reactions were carried out in 20 mM PBS, pH 7.4, containing 0.25 mg/ml recombinant human P450s, 2 mM MgCl2, 20 μM procainamide, and 2 mM freshly prepared NADPH (dissolved in PBS) in a final volume of 200 μl. The recombinant human FMOs included FMO1, FMO3, and FMO5 (BD Biosciences, San Jose, CA). After 30 min of incubation at 37°C, samples for UPLC-ESI-QTOFMS analysis were prepared under the same conditions as described above. The kinetics of procainamide N-oxide (V) formation by FMO1 and FMO3 isozymes were determined by incubating with procainamide in duplicate at 1.0, 2.0, 5.0, 10, 20, 50, 100, and 200 μM. Kinetic parameters (Km) for V were evaluated by the nonlinear regression (Prism GraphPad 5.0; GraphPad Software Inc., San Diego, CA).
2.7. UPLC-ESI-QTOFMS analysis
Human samples were prepared by mixing 100 μl of urine with 100 μl of 50% aqueous acetonitrile, and mouse samples were prepared by mixing 20 μl of urine with 180 μl of 50% aqueous acetonitrile. After centrifugation at 14,000 × g for 20 min, a 5 μl aliquot of the supernatant was injected into a UPLC-ESI-QTOFMS system (Waters Corporation, Milford, MA). The urine and microsome incubation mixture were analyzed using an Acquity BEH UPLC column (Waters Corporation). A flow rate of 0.5 ml/min was maintained throughout the 10 min run. Solvent A was composed of water and 0.1% formic acid and solvent B was composed of acetonitrile and 0.1% formic acid. The gradient was maintained at 100% A for 0.5 min, increased to 100% B over the next 7.5-min and returning to 100% A in the last 2 min. The capillary voltage and cone voltage was 3000 and 20 V, respectively. Source temperature and desolvation temperature were set at 120°C and 350°C, respectively. Nitrogen was used as both cone gas (50 l/h) and desolvation gas (600 l/h). Data were collected in positive mode and negative ionization mode.
2.8. Data processing and multivariate data analysis
Chromatographic and spectral data of urine samples were processed by MarkerLynx (Waters Corporation). The data matrix was further analyzed using SIMCA-P + 12.0 (Umetrics, Kinnelon, NJ). Principal component analysis (PCA) and partial least squares discriminant analysis (PLS-DA) were used to examine the separation of all the procainamide treatment group (93 samples) and pretreatment group (97 samples) in human. Orthogonal projections to latent structures (OPLS) was conducted to identify procainamide metabolites in human and mouse samples after procainamide was given in the normal salt. Identification of procainamide metabolites in human and mouse urine was performed by comparing the distribution of ions in the scatter plots of control or pretreatment with procainamide treatment group.
2.9. Data analysis
Experimental values are presented as mean ± SD. Statistical significance was determined using two-tailed Student’s test. P-values less than 0.05 were considered significant.
3. Results
3.1. Metabolomic profiling of human and mouse urine
UPLC-ESI-QTOFMS coupled with both PCA and PLS-DA modeling was used to examine the separation of all the procainamide treatment and pretreatment groups in humans. The procainamide treatment and pretreatment group could be well separated by both models (Fig. 1A and B). Since principal component 1 (X-axis) represents the effect of drug metabolites on the urinary ions, it can clearly be seen that no such variance exits in the untreated group. Principal component 2 (Y-axis) represents the other main sources of variance, for example, gender, diet, lifestyle, etc. Here, interindividual variation in the untreated subjects is clearly visible and this is also the case for the treated group, presumably due to wide-interindividual differences in procainamide metabolism. To determine the procainamide metabolites, OPLS model was applied to the identification of procainamide metabolites in human and mouse samples. The differences between human samples and mouse samples were best described by OPLS (Fig. 2A and B). Examination of the loadings scatter S-plots for human and mouse urine revealed ions that deviated from the major ion cloud (Fig. 2A and B). Many ions were elevated in the urine after the treatment of procainamide as evident in the top right of the S-plots in the bottom panels. A comparison of the increased ions in the human and mouse samples revealed many ions with similar mass-to-charge (m/z) ratios and retention times. Combined with the trend plots of these ions in the control and treatment groups, these increased ions were putatively identified as procainamide metabolites and their fragments. In this study, 13 procainamide metabolites were determined in human samples, and 9 metabolites were determined in mouse samples based on metabolomic analysis (Table 1).
Fig. 1.
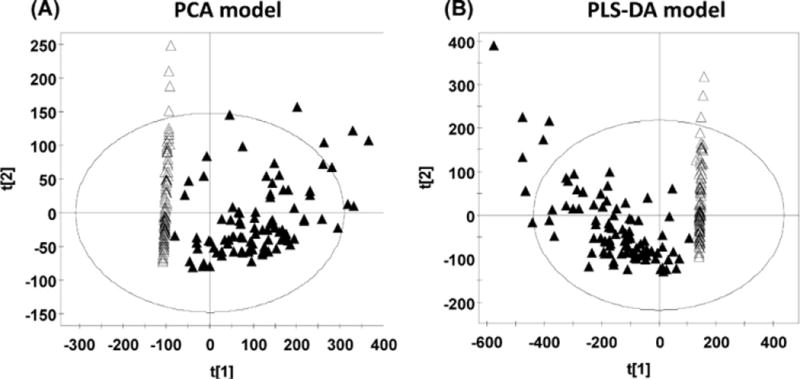
PCA and PLS-DA analysis of the procainamide treatment and pretreatment groups in human. (A) Scores plot of a PCA model between procainamide treatment and pretreatment in the low, normal, and high salt groups. Each point represents an individual human urine sample. (B) Scores plot of a PLS-DA model between procainamide treatment and pretreatment in the low, normal, and high salt groups. Each point represents an individual human urine sample. The t[1] and t[2] correspond to principal components 1 and 2, respectively. Closed triangles represent procainamide treated-samples; open triangles represent pretreatment samples.
Fig. 2.
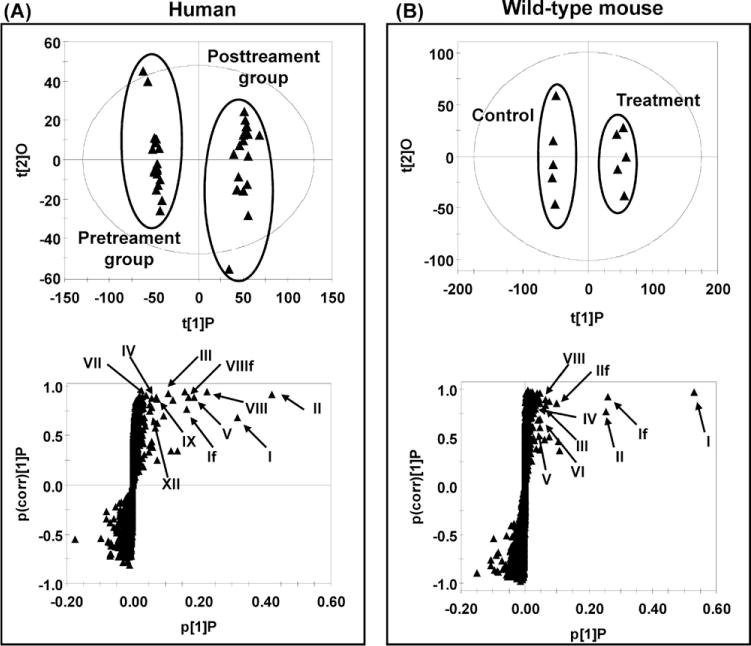
Identification of procainamide metabolites in human and mouse urine using UPLC-ESI-QTOFMS-based metabolomics. (A) Scores plot of an OPLS model and OPLS loadings S-plot of urinary ions from pretreatment and procainamide-treated human innormal salt group. Each point represents an individual human urine sample (top) and a urinary ion (bottom). Procainamide and its metabolites are labeled in the S-plot (I, II, III, IV, V, VII, VIII, IX, and XII), and “f” indicates a fragment ion. (B) Scores plot of an OPLS model and OPLS loadings S-plot of urine ions from control and procainamide-treated mice. Each point represents an individual mouse urine sample (top) and a urine ion (bottom). Procainamide and its metabolites are labeled in the S-plot (I, II, III, IV, V, VI, and VIII), and f indicates a fragment ion. The t[1]P and t[2]O correspond to principal components 1 and 2, respectively. The p(corr)[1]P values represent the interclass difference and p[1]P values represent the relative abundance of the ions. All the data were obtained in positive mode (ESI+).
Table 1.
Identified procainamide metabolites in human, CYP2D6-humanized, and wild-type mice.
| Symbol | RT (min) | Observed m/z | Formula | Mass error (ppm) | Identity | Detected |
|---|---|---|---|---|---|---|
| I | 0.91 | 236.1765 | C13H21N3O[H+] | 0.8 | Procainamide | Human, hCYP2D6, wild-type |
| II | 1.83 | 278.1891 | C15H23N3O2[H+] | 7.9 | N-Acetylprocainamide | Human, hCYP2D6, wild-type |
| III | 1.41 | 250.1564 | C13H19N3O2[H+] | 3.2 | N-Acetyl-desethylprocainamide | Human, hCYP2D6, wild-type |
| IV | 0.51 | 208.1452 | C11H17N3O[H+] | 0.9 | Desethylprocainamide | Human, hCYP2D6, wild-type |
| Va | 1.35 | 252.1696 | C13H21N3O2[H+] | −6.3 | Procainamide N-oxide | Human, hCYP2D6, wild-type |
| VI | 0.74 | 252.1715 | C13H21N3O2[H+] | 1.2 | Procainamide hydroxylamine | Human, hCYP2D6, wild-type |
| VIIa | 1.78 | 294.1832 | C15H23N3O3[H+] | 4.7 | Procainamide hydroxylamine acetic ester | Human, hCYP2D6, wild-type |
| VIIIa | 2.14 | 294.1804 | C15H23N3O3[H+] | −4.7 | N-Acetylprocainamide N-oxide | Human, hCYP2D6, wild-type |
| IXa | 1.57 | 264.1703 | C14H21N3O2[H+] | −3.4 | N-Formylprocainamide | Human, hCYP2D6, wild-type |
| Xa | 3.02 | 430.2238 | C19H31N3O8[H+] | 11.4 | Procainamide hydroxylamine hexuronide | Human |
| XIa | 2.47 | 292.2035 | C16H25N3O2[H+] | 3.4 | N-Propionylprocainamide | Human |
| XIIa | 1.22 | 308.1596 | C15H21N3O4[H+] | −4.5 | N-Oxalylprocainamide | Human, |
| XIIIa | 2.65 | 306.2193 | C17H27N3O2[H+] | 3.6 | N-Butyrylprocainamide | Human, hCYP2D6, wild-type |
| XIVa | 3.15 | 306.2181 | C17H27N3O2[H+] | −0.3 | N-Isobutryrylprocainamide | Human |
Novel metabolites identified in this study.
3.2. Identification and structural elucidation of urinary metabolites of procainamide
OPLS analysis of human and mouse samples initially suggested some potential procainamide metabolites and their fragments in the scatter plots. The chemical compositions and structures of these metabolites were further identified based on the accurate mass measurement and MS/MS fragmentography. Overall, procainamide (I) and 13 metabolites were identified in the urine sample from human and mouse. Four (II, III, IV, and VI) are known metabolites, and nine (V, VII, VIII, IX, X, XI, XII, XIII, and XIV) are novel metabolites. The chemical compositions and retention times of procainamide metabolites are listed in Table 1, and MS/MS spectra of four new metabolites (V, VIII, IX, and XI,) are presented in Fig. 3. MS/MS spectra of I, II, III, IV, VI, VII, X, XII, XIII, and XIV are presented in Supplementary Figs. 1 and 2.
Fig. 3.
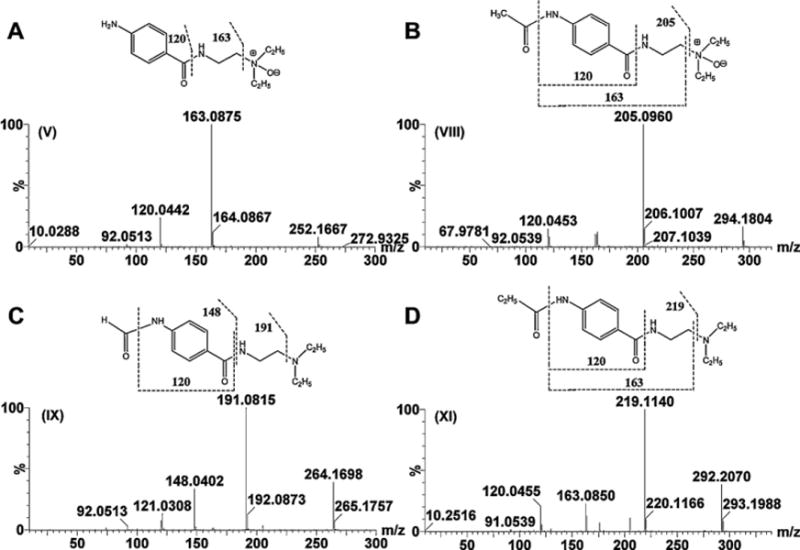
Tandem MS and chemical structures of metabolites V, VIII, IX, and XI. (A) Procainamide N-oxide (V). (B) N-Acetylprocainamide N-oxide (VIII). (C) N-Formylprocainamide (IX). (D) N-Propionylprocainamide (XI).
Metabolites V and VI were calculated as C13H21N3O2 with a mass error of −6.3 and 1.2 ppm based on their accurate mass measurement, m/z 252.1696+ (RT = 1.35 min) and 252.1715+ (RT = 0.74 min), respectively. Compared with the chemical composition of procainamide (I, C13H21N3O), metabolites V and VI were oxidation products of procainamide. The elimination of (CH3CH2)2NH and CH2 = CHNH2 gave fragment ions m/z 179.0832+ and 136.0418+ from metabolite VI (Supplementary Fig. 1E), while two ions m/z 163.0875+ and 120.0442+ were generated by the loss of(CH3CH2)2NO and CH2 = CHNH2 from metabolite V (Fig. 3A). This suggested that the site of oxidation was different in the generation of metabolites V and VI. Compared with the fragment pattern of procainamide, the oxidation in metabolite VI and V was the primary amine and the tertiary amine, respectively. Metabolite VI was identified as the previously reported procainamide hydroxylamine metabolite [10]. Metabolite V was identified as procainamide N-oxide. This metabolite was one novel metabolite, which underwent a similar N-oxidation reaction reported in previous studies [34,35]. Metabolite V was confirmed to be N-oxide compound through the use of TiCl3 reduction (Fig. 4A and C). The retention time and MS fragmentation were consistent with the synthesized procainamide N-oxide (Supplementary Fig. 3A–D).
Fig. 4.
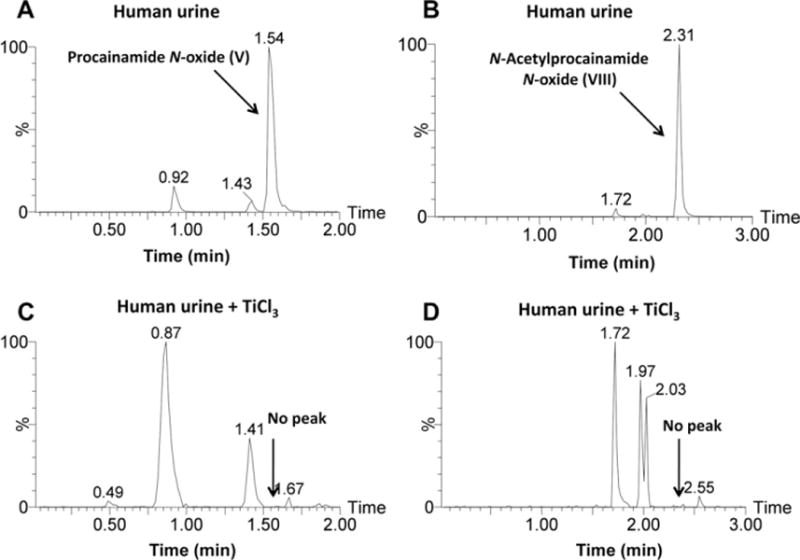
Chemical reduction of procainamide N-oxide (V) and N-acetylprocainamide N-oxide (VIII). (A) Procainamide N-oxide in human urine. (B) N-Acetylprocainamide N-oxide in human urine. (C) Procainamide N-oxide was lost from human urine following treatment with TiCl3. (D) N-Acetylprocainamide N-oxide was lost from human urine following the treatment with TiCl3.
Metabolites VII and VIII were calculated as C15H23N3O3 with a mass error of 4.7 and −4.7 ppm based on their accurate mass measurement, m/z 294.1832+ (RT = 1.78 min) and 294.1804+ (RT = 2.14 min), respectively. Compared with the chemical composition of N-acetylprocainamide (II, C15H23N3O2), metabolites VII and VIII were the oxidation metabolites of N-acetylprocainamide. The elimination of (CH3CH2)2NH and CH2 = CHNH2 gave fragment ions m/z 221.0933+ from metabolite VII (Supplementary Fig. 2A), while the ion m/z 205.0960+ was generated by the loss of (CH3CH2)2NO from metabolite VIII (Fig. 3B). These data suggested that the site of oxidation was different for generation of metabolites V and VI. Compared with the fragmentation pattern of N-acetylprocainamide, metabolite VII was the acetic ester of procainamide hydroxylamine (VI). Compared with the fragment of procainamide N-oxide (V), the oxidation site of metabolite VIII was also at the tertiary amine. Both metabolites have not been previously identified. Metabolites VII and VIII were identified as procainamide hydroxylamine acetic ester and N-acetylprocainamide N-oxide, respectively. Metabolite VIII was reduced by TiCl3, confirming that VIII was N-oxide metabolite (Fig. 4B and D).
Metabolite IX was calculated as C14H21N3O2 with a mass error of −3.4 ppm based on the accurate mass measurement, m/z 264.1703+. Compared with the chemical composition of procainamide (I, C13H21N3O) and N-acetylprocainamide (II, C15H23N3O2), metabolite IX was a formylation product of procainamide by the conjugation of a formyl group and a primary amine. The three ions, m/z 191.0816+, 148.0402+, and 120.0433+, in its MS spectra were consistent with this conclusion (Fig. 3C). Therefore, metabolite IX was identified as N-formylprocainamide. Similarly, metabolite XI was identified by the conjugation of a propionyl group. The three ions, m/z 219.1140+, 163.0850+, and 120.0455+, in its MS spectra were consistent with this conclusion (Fig. 3D). Metabolite XI was identified as N-propionylprocainamide.
Metabolite X was calculated as C19H31N3O8 with a mass error of 11.4 ppm based on the accurate mass measurement, m/z 430.2238+. Compared with the chemical composition of procainamide (I, C13H21N3O), metabolite X was a conjugated metabolite of procainamide. The elimination of (CH3CH2)2NH and CH2 = CHNH2 gave fragment ions m/z 357.1449+ and 314.1036+ in this metabolite, suggesting that the site of conjugation is the primary amine. As seen from its MS/MS fragment (Supplementary Fig. 1F), the fragment m/z 236.1781+ was generated by the loss of m/z 195.0682+, suggesting that the conjugating group was gluconic acid (C6H12O7) and not glucuronic acid (C6H10O7). The generation of metabolite X might be due to the conjugation of hydroxylamine procainamide (V) with gluconic acid. However, no gluconic acid conjugate has ever been described and gluconic acid is not thought to be a mammalian metabolite. That notwithstanding, it is hard to reconcile the neutral loss of m/z 195.0682+, as anything else but gluconic acid, or one of its isomers, hexonic acid, galactonic acid, gulonic acid, mannonic acid, altronic acid, talonic acid, idonic acid or allonic acid. Metabolite X can only be assigned at this time as a procainamide hydroxylamine hexuronide (a conjugate with a hexuronic acid, an acidic sugar derived from a hexose).
Metabolite XII was calculated as C15H21N3O4 with an error of –4.5 ppm based on the accurate mass measurement, m/z 308.1596+. Compared with the chemical composition of N-formylprocainamide (IX, C14H21N3O2), metabolites XII was the carboxylation N-formylprocainamide. Three ions m/z 264.1725+, 191.0832+, 148.0413+, and 120.04367+ in its MS spectra were consistent with this conclusion (Supplementary Fig. 2B). Therefore, metabolite XII was identified as N-oxalylprocainamide.
Metabolites XIII and XIV were calculated as C17H27N3O2 with an error of 3.6 and −0.3 ppm based on their accurate mass measurement, m/z 306.2193+ (RT = 2.65 min) and 306.2181+ (RT = 3.15 min), respectively. Compared with the chemical composition of procainamide (I, C13H21N3O) and N-acetylprocainamide (II, C15H23N3O2), metabolites XIII and XIV were the butanoylated and isobutanoylated metabolites of procainamide. As seen from their MS/MS fragmentation patterns (Supplementary Fig. 2C and D), metabolite XIV shows more fragments than XIII, suggesting that XIII was more stable under similar MS/MS collision energies compared to XIV. Therefore, metabolites XIII and XIV were identified as N-butyrylprocainamide and N-isobutyrylprocainamide, respectively.
3.3. Comparison of in vivo metabolism of procainamide in humans, CYP2D6-humanized mice and wild-type mice
To determine the metabolic maps of procainamide metabolism in humans and mice, the relative composition of urinary procainamide metabolites were compared in humans, CYP2D6-humanized mice, and wild-type mice by extracting the peak area of all identified metabolites (Fig. 5). As shown in Table 1 and Fig. 6A, the differences were distinct among humans and the two mouse strains with regard to the relative abundance of procainamide metabolites. These differences fell into three groups: First, procainamidehad ahigher metabolic rate in humans than in wild-type and CYP2D6-humanized mice. Although there was no significant difference in the excretion of unchanged procainamide (I), the major metabolites N-acetylprocainamide (II) in human urine was about 25-fold higher than that in wild-type mouse urine. Moreover, the further metabolism of metabolites III, V, VIII, and IX was greater in humans than in mice; second, the contributions of primary amine hydroxylation and tertiary amine oxidation to procainamide metabolism were comparable in humans, wild-type mice, and CYP2D6-humanized mice, based on the peak areas of primary amine-hydroxylated metabolite (VI, procainamide hydroxylamine) and tertiary amine-oxidative metabolites (V, procainamide N-oxide; VIII, N-acetylprocainamide N-oxide). N-Oxide formation was a dominant reaction in humans as revealed by the comparatively high abundance of metabolites V and VIII, while primary amine-hydroxylation was a minor reaction in humans. In contrast, primary amine-hydroxylation (VI) in wild-type and CYP2D6-humanized mice was a more dominant reaction than N-oxide formation (V and VIII). The peak intensities of total N-oxidation to procainamide metabolism were human > CYP2D6-humanized mice > wild-type mice. The current study revealed that CYP2D6 has an important role in procainamide N-oxidation consistent with previous studies [12]. Finally, four new metabolites (X, XI, XII, and XIV) in human samples were not detected in wild-type and CYP2D6-humanized mouse samples, likely due to the different metabolic pathways of procainamide in humans and mice. Overall, the differences of urinary procainamide metabolites among humans, CYP2D6-humanized mice and wild-type mice were significant as shown in Fig. 6A.
Fig. 5.
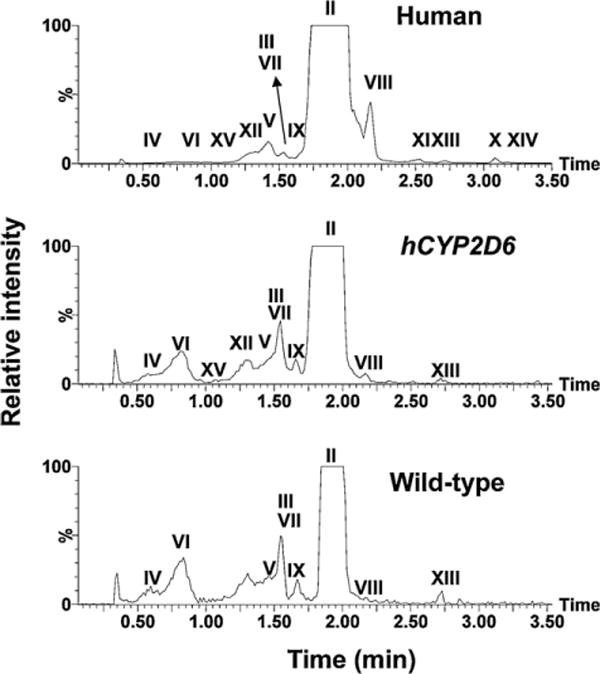
Representative chromatograms of major procainamide metabolites in urine samples of humans, CYP2D6-humanized mice (hCYP2D6), and wild-type mice. Ions within the 20 ppm range of theoretical accurate mass ([M + H]+) of procainamide metabolites (278.189, 250.156, 208.145, 252.169, 294.183, 264.170, 430.223, 292.203, 308.159, and 306.219) were extracted from each 10 min LC–MS run.
Fig. 6.
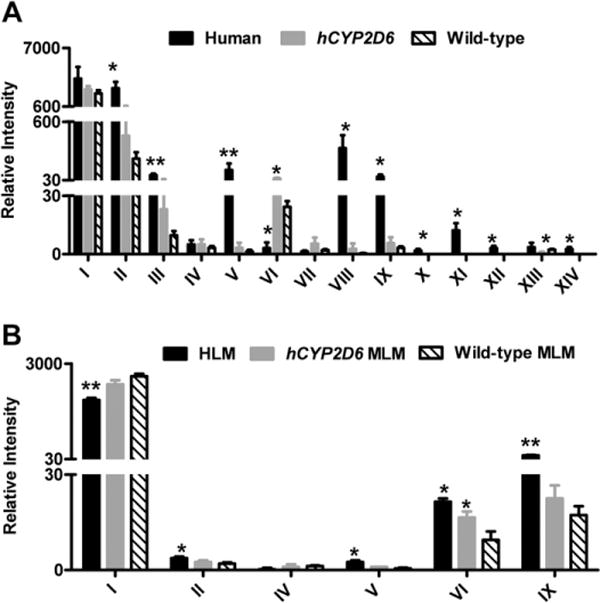
Relative intensity of procainamide and its metabolites produced in vivo and in vitro. (A) Relative intensity of procainamide and its metabolites in humans, CYP2D6-humanized mice, and wild-type mice urine. (B) Relative intensity of procainamide and its metabolites in HLM and MLM from wild-type and CYP2D6-humanized mice. The metabolite codes correspond to those in Table 1. *, significant differences (P < 0.05) in human or CYP2D6-humanized mice (hCYP2D6) and wild-type mice; **, significant differences (P < 0.01) in human and wild-type mice.
3.4. Comparison of in vitro metabolism of procainamide by mouse liver microsomes from wild-type and CYP2D6-humanized mice, and by human liver microsomes
To verify the metabolite profiles of procainamide in humans, CYP2D6-humanized mouse, and wild-type mouse, procainamide was incubated with MLMs from wild-type and CYP2D6-humanized mice and pooled HLMs. The unchanged procainamide in HLM was significantly reduced compared to MLM from wild-type mice (P < 0.01) (Fig. 6B), suggesting that procainamide (I) had a higher metabolic rate in humans than in mice, in agreement with the in vivo results. The peak intensities of metabolite V plus VI were HLM > MLM from CYP2D6-humanized mice > MLM from wildtype mice, indicating that CYP2D6-humanized MLM may mimic HLM in the metabolism of procainamide compared to wild-type MLM. Further, metabolites II and IX could also be detected in greater abundance in HLM than in MLM from wild-type mice, consistent with the in vivo results.
3.5. Role of CYP2D6 in the procainamide metabolism
Although a previous study reported that CYP2D6 is the major enzyme involved in the N-hydroxylation of procainamide, to verify the current results of in vivo and in vitro metabolism, procainamide was incubated with a panel of recombinant human P450s, specifically CYP1A1, CYP1A2, CYP1B1, CYP2A6, CYP2B6, CYP2C8, CYP2C9, CYP2C19, CYP2D6, CYP2E1, CYP2J12, CYP3A4, CYP3A5, CYP3A7, CYP4A11, and CYP4F12. CYP2D6 was the most active among all the P450s in primary amine oxidation (Fig. 7A) consistent with published studies [12]. CYP1A1 also had some activity. The kinetics of human CYP2D6-mediated formation of procainamide hydroxylamine (VI) (Fig. 7B) revealed a Km = 140 μM suggesting that CYP2D6 played an important role in hydroxylation of the procainamide primary amine group.
Fig. 7.
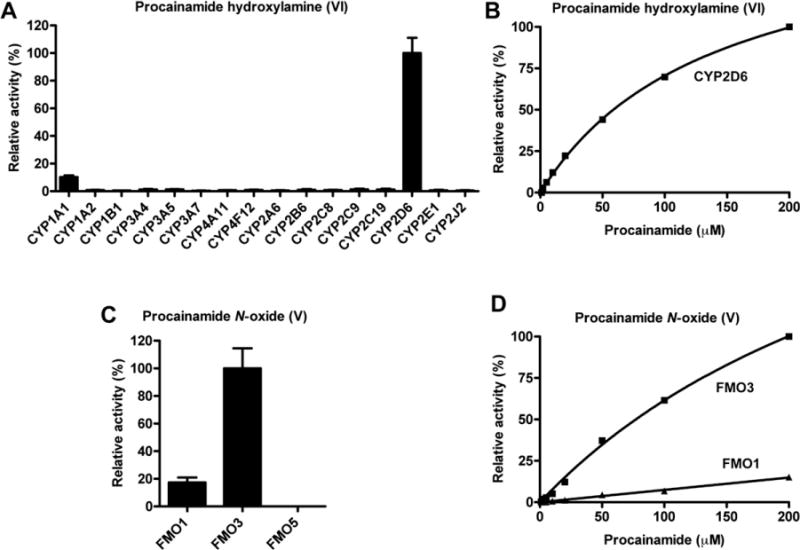
Relative N-oxidation activities of recombinant human P450 and FMO isozymes, and enzyme kinetics of CYP2D6 and FMO3. (A) Relative activities of recombinant human P450s for the generation of procainamide hydroxylamine (VI). The enzymatic activity of the P450 form with the highest yield of VI was set as 100%. The relative activity was presented as the mean ± SD (n = 3). (B) Kinetics of formation of procainamide hydroxylamine (VI) production by CYP2D6. The abundance of VI in the incubation with 200 μM procainamide was set as 100%. (C) Relative activities of recombinant human FMOs for the generation of procainamide N-oxide (V). The enzymatic activity of the FMO with the highest yield of V was set as 100%. (D) Kinetics of procainamide N-oxide (V) production by FMO3. The abundance of V in the incubation with 200 μM procainamide was set as 100%.
3.6. Role of FMO1 and FMO3 in procainamide metabolism
Incubation of recombinant FMO1, FMO3, and FMO5 with procainamide revealed that, procainamide N-oxide (V) was detected after incubation with FMO1 and FMO3 (Fig. 7C). Comparison of the abundance of V suggested that FMO3 had the highest rate of transformation of V than as compared to FMO1. The Km of FMO3 was 342 μM, while the Km of FMO1 was 543 μM (Fig. 7D). This observation suggested that both FMO1 and FMO3 were responsible for the generation of procainamide and N-acetylprocainamide N-oxide in vivo.
4. Discussion
Through the combination of high-resolution LC–MS technology and OPLS analysis, nine novel metabolites of procainamide (V, VII, VIII, IX, XI,XII, XIII, and XIV) were identified and further structurally elucidated by MS/MS fragmentography. By using this strategy, a series of N-acylation metabolites of procainamide were identified in such as N-formylprocainamide (IX), N-acetylprocainmide (II), N-butyrylprocainamide (XIII), and N-propionylprocainamide (XI). Another interesting observation from this study is that two highly abundant quaternary ammonium N-oxide metabolites V and VIII were generated by the oxidation of this tertiary amine in humans. Metabolomic analysis can simultaneously determine the relative abundance of all the procainamide metabolites in urine and elucidate metabolic differences in the metabolism of procainamide in humans and mice. The differential metabolism of procainamide in human and mouse is summarized in Fig. 8.
Fig. 8.
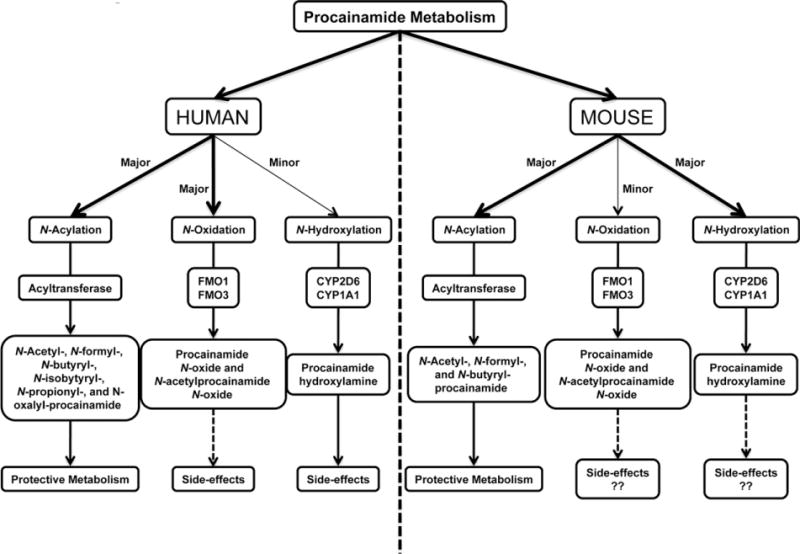
Summary of differential metabolism of procainamide in humans and mice. The acylation of procainamide in humans is responsible for the protective metabolism, consistent with procainamide acylation in mouse. However, more acylated metabolites of procainamide can be formed by acyltransferase in humans than in mice. The differential metabolism of procainamide is N-oxidation and N-hydroxylation associated with the side-effects of procainamide in vivo. In humans, N-oxidation mediated by FMO1 and FMO3 is the major route of metabolism of procainamide, while N-hydroxylation regulated by CYP2D6 and CYP1A1 is a minor metabolic pathway. In contrast, N-hydroxylation is the major metabolic route of procainamide in mice, while N-oxidation is a minor pathway in this species.
Although in vitro and in vivo metabolism of procainamide in humans and mice was previously reported [10,11], a comprehensive profile and comparison of procainamide metabolism in these species has not been investigated. Results from the current metabolomic analysis provided a detailed view of the distribution of each procainamide metabolite and its potential biotransformation pathway and further confirmed the interspecies difference between human and mouse. This study suggested the higher metabolic rate of procainamide was observed in humans, and the N-acylation metabolites of procainamide were dominant in humans and mice. Interestingly, besides the N-acetylation metabolites, the N-formylation, N-butyrylation, N-isobutyrylation, N-propionylation and N-oxalylation metabolites of procainamide also were found in this study. Previously, N-acetylation of procainamide was reported to be mediated by polymorphic N-acetyltransferase (Nat2) [19]. Generally, the other N-acylation reactions are very rare in xenobiotic metabolism. The transformation of the N-acylation metabolites in humans were much more than in mouse suggesting that humans possess a specific N-acyltransferase mediating formation of the N-acylated metabolites of procainamide. Another interesting observation was that tertiary amine oxidation was the dominant reaction in humans, while primary amine hydroxylation was the dominant reaction in wildtype and CYP2D6-humanized mice. In vitro studies indicated that formation of the N-oxide of the tertiary amine was carried out by FMO1 and FMO3, and formation of the N-hydroxylation of the primary amine was mediated by CYP2D6 and CYP1A1. These observations suggested that the N-oxidations of procainamide in vivo metabolism are species-specific.
In vitro microsome metabolism kinetics of recombinant CYP2D6 metabolism of procainamide indicated that CYP2D6 was the main P450involvedintheformationofprocainamidehydroxylamine(VI), consistent with previous studies [11,12].Tofurtherexamine the role of CYP2D6 in vivo, procainamide metabolism was investigated in a CYP2D6-humanized mouse model. In agreement with in vitro metabolism, the formation of procainamide hydroxylamine (VI) was a major pathway in CYP2D6-humanized mice compared with wild-type mice. In humans, CYP2D6 is the single active member of CYP2D subfamily, whereas mice have at least five CYP2D members, none of which share the same enzymatic activity as human CYP2D6 [36]. Although the N-oxidations of procainamide were comparable in humans and mice, the level of the total N-oxidation metabolites in CYP2D6-humanized mice were more than in wild-type mice, suggesting that N-oxidation of procainamide in CYP2D6-humanized mice was most similar to that in humans. These results also suggested that the CYP2D6-humanized mouse could be used to mimic the metabolism of N-oxidation observed in human, especially for drugs with primary amine groups.
Previous clinical studies reported that long term therapy with procainamide is associated with development of antinuclear antibodies in 50–90% patients and 25–30% of these patients ultimately develop systemic lupus erythematosus (SLE) [18–20]. However, the exact mechanism of procainamide-induced lupus in human remains unknown. Interestingly, procainamide does not induce SLE in several animal models including dog, pig, mouse, and rat, after treatment with procainamide for up to 39 weeks [27], the exception being in the A/J mouse that lacks N-acetyltransferase activity and develops antinuclear antibodies with procainamide treatment [37]. The species differences in generation of SLE might be due to differential metabolism of procainamide among the species. Indeed, in this study significant differences in procainamide metabolism were found in humans and mice, most notably the N-acylated metabolites and N-oxidation metabolites. Previous studies indicated that the aromatic amino group on procainamide is necessary to induce SLE and that acetylating this amino group helps block the lupus-inducing effect [24]. These results suggested that the high transformation of N-acylation metabolites in humans contributed to inhibit procainamide-induced SLE. However, a large case–control study of 209 SLE patients and 209 controls was conducted in which the NAT2 gene was genotyped for seven known inactivating alleles and the authors could find no association between N-acetylation and SLE [38]. Others have suggested that the N-oxidized metabolites are responsible for SLE development, such as procainamide hydroxylamine and nitrosoprocainamide [21,22,39]. In the present study, the procainamide hydroxylamine (VI) was of low abundance and nitrosoprocainamide was not detected in the human samples. However, significant levels of N-oxide metabolites (V and VIII) were generated in humans and not mice. This suggested that these novel N-oxide metabolites of procainamide might be candidates for the development of SLE.
In summary, metabolomics was conducted to investigate procainamide metabolism in humans and mice. Thirteen urinary procainamide metabolites including nine novel metabolites, from P450-dependent or FMO-dependent oxidations as well as N-acylation reactions, were identified and structurally elucidated, and a comprehensive in vivo metabolic pathway of procainamide was constructed (Fig. 9). Significant differences in the relative composition of urinary metabolites between humans and mice demonstrated that the novel N-oxide metabolites of procainamide in this study might be candidates for procainamide-induced SLE that is primarily observed in humans. In vivo metabolism of procainamide in CYP2D6-humanized mouse as well as in vitro incubations with microsomes and recombinant P450s confirmed that human CYP2D6 plays an important role in procainamide metabolism. Further studies are needed to assess the toxicity of these novel identified N-oxide metabolites in animal models and in vitro systems.
Fig. 9.
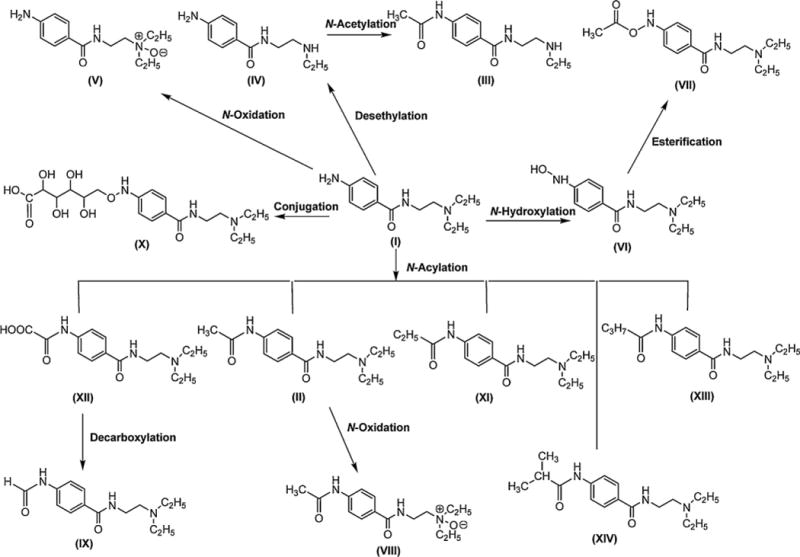
Major in vivo procainamide metabolic pathways. The primary amine in procainamide (I) can conjugate with different types of acyl group to generate several N-acylation metabolites (II, XI, XII, XIII, and XIV). The metabolites II and XII can be further metabolized to VIII and IX, respectively. Procainamide (I) can also be converted to N-hydroxylation metabolite VI and N-oxide V under the effect of oxidation. VI can be transformed into VII by esterification. In addition to desethylation of I to IV, procainamide also can be conjugated with a hexuronic acid to X.
Supplementary Material
Acknowledgments
This work was supported in part by the Intramural Research Program of the Center for Cancer Research, National Cancer Institute, National Institutes of Health. FJF acknowledges Swiss National Science Foundation support for grant no. 31003A-102153.
Appendix A. Supplementary data
Supplementary data associated with this article can be found, in the online version, at doi:10.1016/j.bcp.2012.02.013.
References
- 1.Ribeiro C, Longo A. Procainamide and disopyramide. Eur Heart J. 1987;8(Suppl. A):11–9. doi: 10.1093/eurheartj/8.suppl_a.11. [DOI] [PubMed] [Google Scholar]
- 2.Bigger JT, Heissenbuttel RH. The use of procainamide and lidocaine in the treatment of cardiac arrhythmias. Prog Cardiovasc Dis. 1969;11:515–34. doi: 10.1016/0033-0620(69)90004-8. [DOI] [PubMed] [Google Scholar]
- 3.Koch-Weser J. Procainamide dosage schedules, plasma concentration, and clinical effects. JAMA. 1971;215:1454–60. [PubMed] [Google Scholar]
- 4.Koch-Weser J. Pharmacokinetic of procainamide in man. Ann N Y Acad Sci. 1971;179:370–82. doi: 10.1111/j.1749-6632.1971.tb46914.x. [DOI] [PubMed] [Google Scholar]
- 5.Strong JM, Dutcher JS, Lee WK, Atkinson AJ., Jr Pharmacokinetics in man of the N-acetylated metabolite of procainamide. J Pharmacokinet Biopharm. 1975;3:223–35. doi: 10.1007/BF01066919. [DOI] [PubMed] [Google Scholar]
- 6.Okumura K, Kita T, Chikazawa S, Komada F, Iwakawa S, Tanigawara Y. Genotyping of N-acetylation polymorphism and correlation with procaina-mide metabolism. Clin Pharmacol Ther. 1997;61:509–17. doi: 10.1016/S0009-9236(97)90131-4. [DOI] [PubMed] [Google Scholar]
- 7.Kamath BL, Lai CM, Gupta SD, Durrani MJ, Yacobi A. Pharmacokinetics of procainamide and N-acetylprocainamide in rats. J Pharm Sci. 1981;70:299–302. doi: 10.1002/jps.2600700319. [DOI] [PubMed] [Google Scholar]
- 8.Ruo TI, Morita Y, Atkinson AJ, Jr, Henthorn T, Thenot JP. Identification of desethyl procainamide in patients: a new metabolite of procainamide. J Pharmacol Exp Ther. 1981;216:357–62. [PubMed] [Google Scholar]
- 9.Uetrecht J, Zahid N, Rubin R. Metabolism of procainamide to a hydroxylamine by human neutrophils and mononuclear leukocytes. Chem Res Toxicol. 1988;1:74–8. doi: 10.1021/tx00001a013. [DOI] [PubMed] [Google Scholar]
- 10.Budinsky RA, Roberts SM, Coats EA, Adams L, Hess EV. The formation of procainamide hydroxylamine by rat and human liver microsomes. Drug Metab Dispos. 1987;15:37–43. [PubMed] [Google Scholar]
- 11.Lessard E, Hamelin BA, Labbe L, O’Hara G, Belanger PM, Turgeon J. Involvement of CYP2D6 activity in the N-oxidation of procainamide in man. Pharmacogenetics. 1999;9:683–96. doi: 10.1097/01213011-199912000-00003. [DOI] [PubMed] [Google Scholar]
- 12.Lessard E, Fortin A, Belanger PM, Beaune P, Hamelin BA, Turgeon J. Role of CYP2D6 in the N-hydroxylation of procainamide. Pharmacogenetics. 1997;7:381–90. doi: 10.1097/00008571-199710000-00007. [DOI] [PubMed] [Google Scholar]
- 13.du Souich P, Erill S. Metabolism of procainamide and p-aminobenzoic acid in patients with chronic liver disease. Clin Pharmacol Ther. 1977;22:588–95. doi: 10.1002/cpt1977225part1588. [DOI] [PubMed] [Google Scholar]
- 14.Wheeler JF, Adams LE, Mongey AB, Roberts SM, Heineman WR, Hess EV. Determination of metabolically derived nitroprocainamide in the urine of procainamide-dosed humans and rats by liquid chromatography with electrochemical detection. Drug Metab Dispos. 1991;19:691–5. [PubMed] [Google Scholar]
- 15.Wheeler JF, Lunte CE, Heineman WR, Adams L, Hess EV. Electrochemical determination of N-oxidized procainamide metabolites and functional assessment of effects on murine cells in vitro. Proc Soc Exp Biol Med. 1988;188:381–6. doi: 10.3181/00379727-188-3-rc1. [DOI] [PubMed] [Google Scholar]
- 16.Scheinbart LS, Johnson MA, Gross LA, Edelstein SR, Richardson BC. Procainamide inhibits DNA methyltransferase in human T cell line. J Rheumatol. 1991;18:530–4. [PubMed] [Google Scholar]
- 17.Lee BH, Yegnasubramanian S, Lin X, Nelson WG. Procainamide is a specific inhibitor of DNA methyltransferase 1. J Biol Chem. 2005;280:40749–56. doi: 10.1074/jbc.M505593200. [DOI] [PMC free article] [PubMed] [Google Scholar]
- 18.Blomgren SE, Condemi JJ, Bignall MC, Vaughan JH. Antinuclear antibody induced by procainamide. A prospective study. N Engl J Med. 1969;281:64–6. doi: 10.1056/NEJM196907102810203. [DOI] [PubMed] [Google Scholar]
- 19.Woosley RL, Drayer DE, Reidenberg MM, Nies AS, Carr K, Oates JA. Effect of acetylator phenotype on the rate at which procainamide induces antinuclear antibodies and the lupus syndrome. N Engl J Med. 1978;298:1157–9. doi: 10.1056/NEJM197805252982101. [DOI] [PubMed] [Google Scholar]
- 20.Henningsen NC, Cederberg A, Hanson A, Johansson BW. Effects of long-term treatment with procaine amide. A prospective study with special regard to ANF and SLE in fast and slow acetylators. Acta Med Scand. 1975;198:475–82. [PubMed] [Google Scholar]
- 21.Uetrecht JP. Reactivity and possible significance of hydroxylamine and nitroso metabolites of procainamide. J Pharmacol Exp Ther. 1985;232:420–5. [PubMed] [Google Scholar]
- 22.Jiang X, Khursigara G, Rubin RL. Transformation of lupus-inducing drugs to cytotoxic products by activated neutrophils. Science. 1994;266:810–3. doi: 10.1126/science.7973636. [DOI] [PubMed] [Google Scholar]
- 23.Adams LE, Sanders CE, Jr, Budinsky RA, Donovan-Brand R, Roberts SM, Hess EV. Immunomodulatory effects of procainamide metabolites: their implications in drug-related lupus. J Lab Clin Med. 1989;113:482–92. [PubMed] [Google Scholar]
- 24.Kluger J, Drayer DE, Reidenberg MM, Lahita R. Acetylprocainamide therapy in patients with previous procainamide-induced lupus syndrome. Ann Intern Med. 1981;95:18–23. doi: 10.7326/0003-4819-95-1-18. [DOI] [PubMed] [Google Scholar]
- 25.Richardson B, Cornacchia E, Golbus J, Maybaum J, Strahler J, Hanash S. N-Acetylprocainamide is a less potent inducer of T cell autoreactivity than procainamide. Arthritis Rheum. 1988;31:995–9. doi: 10.1002/art.1780310809. [DOI] [PubMed] [Google Scholar]
- 26.Roden DM, Reele SB, Higgins SB, Wilkinson GR, Smith RF, Oates JA, et al. Antiarrhythmic efficacy, pharmacokinetics and safety of N-acetylprocainamide in human subjects: comparison with procainamide. Am J Cardiol. 1980;46:463–8. doi: 10.1016/0002-9149(80)90016-8. [DOI] [PubMed] [Google Scholar]
- 27.Dubois EL, Strain L. Failure of procainamide to induce a systemic lupus erythematosus-like disease in animals. Toxicol Appl Pharmacol. 1972;21:253–9. doi: 10.1016/0041-008x(72)90068-3. [DOI] [PubMed] [Google Scholar]
- 28.Li F, Patterson AD, Hofer CC, Krausz KW, Gonzalez FJ, Idle JR. Comparative metabolism of cyclophosphamide and ifosfamide in the mouse using UPLC-ESI-QTOFMS-based metabolomics. Biochem Pharmacol. 2010;80:1063–74. doi: 10.1016/j.bcp.2010.06.002. [DOI] [PMC free article] [PubMed] [Google Scholar]
- 29.Li F, Patterson AD, Hofer CC, Krausz KW, Gonzalez FJ, Idle JR. A comprehensive understanding of thioTEPA metabolism in the mouse using UPLC-ESI-QTOFMS-based metabolomics. Biochem Pharmacol. 2011;81:1043–53. doi: 10.1016/j.bcp.2011.01.024. [DOI] [PMC free article] [PubMed] [Google Scholar]
- 30.Nery R. The metabolic interconversion of arecoline and arecoline 1-oxide in the rat. Biochem J. 1971;122:503–8. doi: 10.1042/bj1220503. [DOI] [PMC free article] [PubMed] [Google Scholar]
- 31.Kulanthaivel P, Barbuch RJ, Davidson RS, Yi P, Rener GA, Mattiuz EL, et al. Selective reduction of N-oxides to amines: application to drug metabolism. Drug Metab Dispos. 2004;32:966–72. [PubMed] [Google Scholar]
- 32.Corchero J, Granvil CP, Akiyama TE, Hayhurst GP, Pimprale S, Feigenbaum L, et al. The CYP2D6 humanized mouse: effect of the human CYP2D6 transgene and HNF4alpha on the disposition of debrisoquine in the mouse. Mol Pharmacol. 2001;60:1260–7. doi: 10.1124/mol.60.6.1260. [DOI] [PubMed] [Google Scholar]
- 33.Yu AM, Idle JR, Byrd LG, Krausz KW, Kupfer A, Gonzalez FJ. Regeneration of serotonin from 5-methoxytryptamine by polymorphic human CYP2D6. Pharmacogenetics. 2003;13:173–81. doi: 10.1097/01.fpc.0000054066.98065.7b. [DOI] [PubMed] [Google Scholar]
- 34.Giri S, Idle JR, Chen C, Zabriskie TM, Krausz KW, Gonzalez FJ. A metabolomic approach to the metabolism of the areca nut alkaloids arecoline and arecaidine in the mouse. Chem Res Toxicol. 2006;19:818–27. doi: 10.1021/tx0600402. [DOI] [PMC free article] [PubMed] [Google Scholar]
- 35.Giri S, Krausz KW, Idle JR, Gonzalez FJ. The metabolomics of (+/−)-arecoline 1-oxide in the mouse and its formation by human flavin-containing monooxygenases. Biochem Pharmacol. 2007;73:561–73. doi: 10.1016/j.bcp.2006.10.017. [DOI] [PubMed] [Google Scholar]
- 36.Bogaards JJ, Bertrand M, Jackson P, Oudshoorn MJ, Weaver RJ, van Bladeren PJ, et al. Determining the best animal model for human cytochrome P450 activities: a comparison of mouse, rat, rabbit, dog, micropig, monkey and man. Xenobiotica. 2000;30:1131–52. doi: 10.1080/00498250010021684. [DOI] [PubMed] [Google Scholar]
- 37.Tannen RH, Weber WW. Antinuclear antibodies related to acetylator phenotype in mice. J Pharmacol Exp Ther. 1980;213:485–90. [PubMed] [Google Scholar]
- 38.Zschieschang P, Hiepe F, Gromnica-Ihle E, Roots I, Cascorbi I. Lack of association between arylamine N-acetyltransferase 2 (NAT2) polymorphism and systemic lupus erythematosus. Pharmacogenetics. 2002;12:559–63. doi: 10.1097/00008571-200210000-00008. [DOI] [PubMed] [Google Scholar]
- 39.Kretz-Rommel A, Rubin RL. Persistence of autoreactive T cell drive is required to elicit anti-chromatin antibodies in a murine model of drug-induced lupus. J Immunol. 1999;162:813–20. [PubMed] [Google Scholar]
Associated Data
This section collects any data citations, data availability statements, or supplementary materials included in this article.