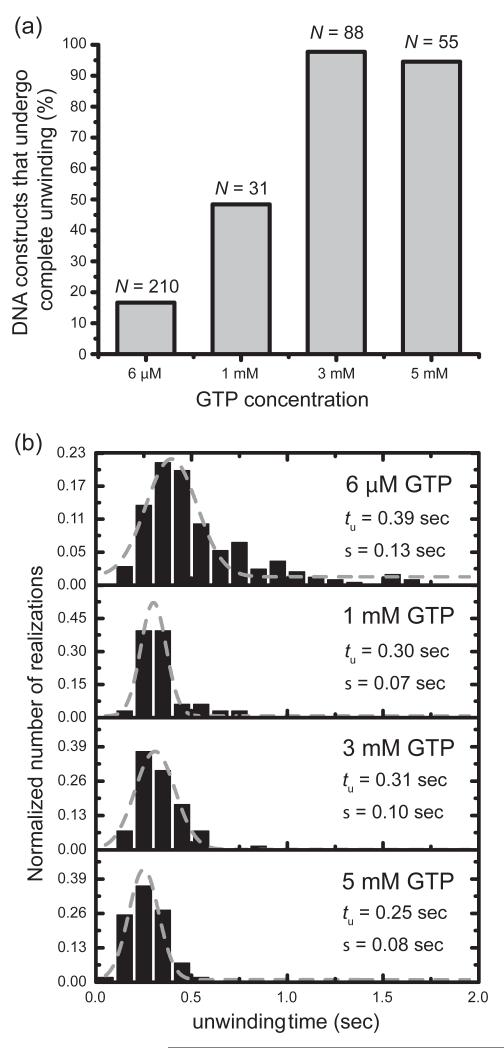
Figure 7. At elevated GTP concentration (3 mM), 97% of the fork constructs observed exhibited a ‘complete’ unwinding pattern.
(a) Percentage of DNA constructs showing a ‘complete’ unwinding pattern, taken from the total number (N) of FRET-active single molecule trajectories, increased at high GTP concentration. (b) Histogram of unwinding times (number of trajectories N ranged from 33 to 210). Grey curves are Gaussians fits described by exp[−(t − tu)2/2σ2]. The best-fit values of the mean unwinding time tu and standard deviation σ are given in the panels. All histograms are normalized to the number of traces N.

