Abstract
Crowding impairs the perception of form in peripheral vision. It is likely to be a key limiting factor of form vision in patients without central vision. Crowding has been extensively studied in normally sighted individuals, typically with a stimulus duration of a few hundred milliseconds to avoid eye movements. These restricted testing conditions do not reflect the natural behavior of a patient with central field loss. Could unlimited stimulus duration and unrestricted eye movements change the properties of crowding in any fundamental way? We studied letter identification in the peripheral vision of normally sighted observers in three conditions: (i) a fixation condition with a brief stimulus presentation of 250 ms, (ii) another fixation condition but with an unlimited viewing time, and (iii) an unrestricted eye movement condition with an artificial central scotoma and an unlimited viewing time. In all conditions, contrast thresholds were measured as a function of target-to-flanker spacing, from which we estimated the spatial extent of crowding in terms of critical spacing. We found that presentation duration beyond 250 ms had little effect on critical spacing with stable gaze. With unrestricted eye movements and a simulated central scotoma, we found a large variability in critical spacing across observers, but more importantly, the variability in critical spacing was well correlated with the variability in target eccentricity. Our results assure that the large body of findings on crowding made with briefly presented stimuli remains relevant to conditions where viewing time is unconstrained. Our results further suggest that impaired oculomotor control associated with central vision loss can confound peripheral form vision beyond the limits imposed by crowding.
Keywords: crowding, form vision, peripheral vision, eye movements
1. INTRODUCTION
Crowding occurs when a target stimulus presented to the visual periphery is flanked by other stimuli, impairing identification of the target. Experimentally it has been common to use letters or simple patterns like Gabor patches in crowding experiments but the effect also occurs for more natural stimuli such as objects (Wallace & Tjan, 2010). Under normal viewing conditions and even in a cluttered natural environment, crowding does not pose an insurmountable problem as we can foveate the target and rely on central vision to identify objects. However, people who suffer central visual field loss must use peripheral vision for identification, and crowding can become a severe limiting factor. For example, reading is a particular problem for patients with age-related macular degeneration (AMD). Peripheral reading speeds can be up to six times slower than normal (Chung, Mansfield & Legge, 1998). Crowding in normal peripheral vision has been studied extensively and known to have a number of intriguing properties. It affects stimulus identification, but not detection, such that an observer can perceive that a target stimulus is present but be unable to identify it (Pelli & Tillman, 2008; Levi, 2008). It is influenced by the similarity between the target and the flankers, such that more similar (e.g. in orientation, shape, spatial frequency, color) stimuli cause more frequent identification errors (Bouma, 1970; Andriessen & Bouma, 1976; Kooi et al., 1994; Chung, Levi & Legge, 2001). Perhaps the most interesting aspect of crowding is that it depends on the center-to-center distance between the target and flankers but not the gap between them (Bouma, 1970; Toet & Levi, 1992; Levi & Carney, 2009). The maximum center-to-center distance at which the flankers can still exert a measurable impediment to the identification of the target is called the ‘critical spacing’. The critical spacing depends upon the target eccentricity and is independent of visual acuity and stimulus size (Strasburger, Harvey, & Rentschler, 1991; Levi, Hariharan, & Klein, 2002; Pelli, Palomares, & Majaj, 2004). The critical spacing is expected to be about half the eccentricity (Bouma, 1970), although smaller ratios are common (e.g. Strasburger, Harvey, & Rentschler, 1991; Wallace & Tjan, 2011). This eccentricity dependence may reflect a neural process of a constant spatial extent on the cortex (Toet & Levi, 1992; Motter & Simoni, 2008; Pelli, 2008; Nandy & Tjan, 2012).
One variable that has not received as much attention is that of stimulus duration. Most studies have used brief stimulus presentation to minimize eye movements and ensure that the target stimulus is being presented at the intended eccentricity. However, for people with central field loss and who have adopted a preferred retinal locus (PRL) in the peripheral retina for fixation (Crossland et al., 2005), eccentric fixation durations can be as long as needed. It is therefore of interest to know if stimulus duration affects identification performance in crowded conditions. Only a few results have been reported. In their seminal study, Toet and Levi (1992) reported results for stimulus durations of 150 ms. However, they stated in their results that for stimulus durations of 500 ms (for single un-flanked targets) they found only slightly better acuity thresholds, but that the fall-off in performance with eccentricity remained unchanged by duration. It is unclear from that result if there would be a similar lack of effect in the presence of flankers. Tripathy and Cavanagh (2002) examined crowding using oriented T’s and T-like distractors. They were primarily interested in the effects of stimulus size on the extent of the crowding zone; however, they also used two stimulus durations per observer, a typical duration of 360 ms and a much shorter duration of 27ms or 13 ms (dependent on observer) and found that estimated crowding zones were larger for the shorter durations (an increase of 1.5°–2° at a target eccentricity of 9.2°). More recently, Chung and Mansfield (2009) also found that shorter durations led to larger crowding regions for identifying an oriented T flanked by oriented T’s that were either same or opposite in contrast polarity as the target. At the target eccentricity of 10°, the largest crowding region occurred for the shortest same-polarity stimulus: 5.5° at a duration of 57 ms. The region shrinks to less than 4° for a duration of 147 ms and to 3° for a duration of 1000 ms.
Will the spatial extent of crowding reduce further if the stimulus duration is unlimited? What if eye movements are unrestricted as in the case of central field loss? The present study addresses these questions with three experimental conditions. In two conditions, we required observers to maintain fixation. The stimulus duration was either brief or unlimited. In the third condition, both stimulus duration and eye movements were unrestricted. In all three conditions, gaze position was continuously monitored with an eye tracker. In the first two conditions, stimuli were made visible only when observers were accurately fixating (within an invisible bounding box centered on a fixation cross). In the third condition, eye tracking was used to present a gaze-contingent central scotoma as a way to control the minimum target eccentricity while allowing unrestricted eye movements. A strong dependency of the spatial extent of crowding on stimulus duration or eye movements would suggest that previous results provide an incomplete description of crowding, while no difference would suggest that the results of crowding established using brief stimulus presentation could generalize to conditions of central vision loss.
To anticipate our findings, prolonging stimulus presentation from 250 ms to unlimited duration without eye movements resulted in only a small reduction of the crowding zone in four of the five observers. Allowing unrestricted eye movements generally made crowding worse as observers tended to place the target further away from the artificial scotoma than was necessary. When the critical spacing was expressed as fraction of the effective target eccentricity, we found only a very weak effect of stimulus duration on crowding, which was consistent across all conditions.
2. METHODS
2.1 Observers
Two groups of observers with normal vision were utilized. The ‘novice’ group (N) consisted of three observers who had little or no experience using an artificial scotoma. One of these observers (N3) was an author and was not naive to the purpose of the experiment. The ‘experienced’ group (E) consisted of two observers. They had previously been trained to adapt to an artificial scotoma in an unrelated experiment, but were naive to the purpose of this experiment. The experienced observers practiced a visual-search task with an artificial scotoma over the course of three months. Both observers adapted a preferred retinal locus (PRL) as a result of the practice and had re-referenced their saccades to the PRL (Tjan et al., 2011).
2.2 Stimuli
The stimuli consisted of the 26 lowercase letters of the English alphabet in Arial font. Letter size (in x-height) in the experiment was 1.5 times the acuity at test eccentricity for each observer, as measured before the experiment. Stimuli were displayed on a Dell P1230 19″ CRT monitor (resolution: 1024 × 768 at 85 Hz) at a viewing distance of 57 cm and controlled using a custom-built desktop running Windows 7 Enterprise. A gray-scale video attenuator (Li et al., 2003) was used with custom-built contrast calibration and control software implemented in MATLAB to provide eleven bits of linearly spaced contrast levels.
In two of the three experimental conditions (FXU & FXB, see Procedure), observers had to fixate on a cross near the top of the screen, directly above the target letter, such that the center of target letter was presented at an eccentricity of 6° in the observer’s lower visual field and physically located at the center of the screen. In the remaining condition (EMU), a central scotoma 5.5° in radius was simulated with a gaze-contingent display such that the minimum eccentricity to the target letter without any part of the target being occluded by the scotoma is about 6° (equivalent to the fixation conditions). (The actual letter sizes were based on the individual observers’ letter acuity, and were less than 1° for all observers except for observer E1, which was slightly larger than 1°.) The central scotoma had the same luminance as the gray background. It was therefore invisible except when it intersected a letter.
The two flanking letters were located symmetrically above and below the target. During each trial, the target and the flanker letters were selected randomly from the 26 available letters, without replacement, such that all three letters were always different. Contrast of the flanking letters was fixed at 30% (Weber contrast). Contrast of the target letter was adjusted using QUEST (Watson & Pelli, 1983) as implemented in the Psychophysics Toolbox (version 3.0.8) to estimate threshold contrast for reaching an accuracy criterion of 50% (chance level was 3.85%).
2.3 Acuity
Peripheral letter acuity was measured for all observers prior to the experiment. Lowercase letters in Arial font were presented for 250 ms at 100% contrast on a CRT without any flankers at 6° eccentricity in the lower visual field. Letter size was varied using QUEST to achieve an identification accuracy criterion of 50%, across 5 blocks of 60 trials each. Acuity was estimated as the letter height at criterion. This acuity measurement also serves as practice for the observers who were not used to performing laboratory tasks in peripheral vision. Letter stimuli used in the experiment were 1.5 times the acuity size.
2.4 Procedure
We measured contrast thresholds of crowded target letters as a function of the center-to-center spacing between targets and flankers. There were three conditions for each observer (Figure 1): (i) an eye movement condition using an artificial scotoma with an unlimited stimulus duration (EMU), (ii) a fixation condition with an unlimited presentation duration (FXU), and (iii) another fixation condition but with a brief stimulus duration of 250ms (FXB). In the EMU condition, the artificial scotoma was a disc of 5.5° in radius and the same color as the gray background. The observer was allowed to move their eyes freely. The center of the artificial scotoma continuously followed the observer’s point of gaze. The scotoma could obscure part or whole of the stimulus if the observer attempted to fixate on parts of the screen close to the stimulus (as illustrated in Figure 2). Stimuli remained static on the screen, with the target letter located at the center of the screen and the flankers located vertically at one of the pre-specified center-to-center distances from the target. When the observer was ready to make a response in this scotoma condition, a key press terminated the stimulus presentation and brought up a response screen for the observer to indicate the target letter with a mouse click.
Figure 1.
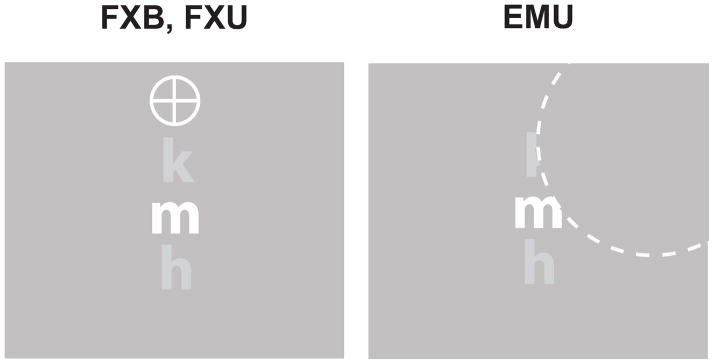
The three viewing conditions. FXB: fixation condition with brief (250 ms) viewing duration. FXU: fixation condition with unlimited viewing. EMU: unrestricted eye movements with an artificial central scotoma and unlimited viewing duration. The dashed curve, for illustration only, indicates the boundary of the invisible central scotoma.
Figure 2.
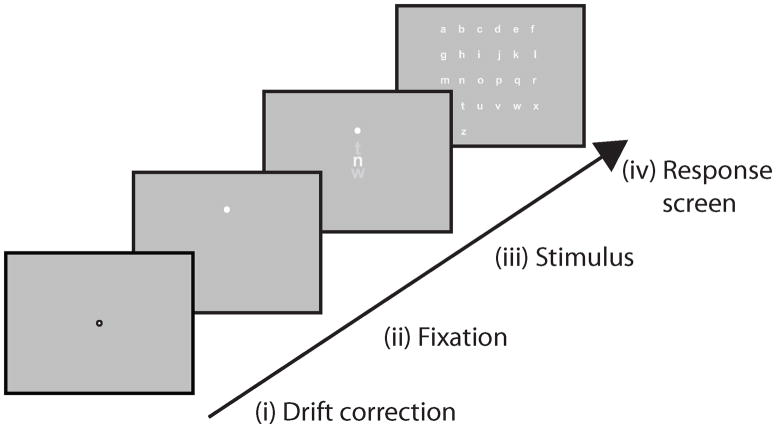
The sequence of events in a trial: (i) drift-correction with a central fixation for re-centering the eye tracker calibration, (ii) a fixation cross in which the observer held fixation for 1500 ms, (iii) an auditory beep to alert the observer followed by the stimulus presentation, and (iv) a response selection in which all 26 lowercase letters were presented alphabetically in a response array. To respond, the observer selected a letter from the response array (iv) with a mouse click. In the EMU and FXU conditions, the duration of step (iii) varied depending on how long the observer chose to view the stimulus (terminated by pressing the space bar), while in the FXB condition it was fixed to 250 ms.
In the fixation conditions (FXU/FXB), an invisible box centered at the fixation cross set the boundary for fixation to be ±1.4°. Fixations within this invisible box were admissible, which caused the stimulus to be presented onscreen. The target letter was presented at the center of the screen, 6° eccentricity in the lower visual field from the fixation cross. If the observer’s gaze moved out of the box, the stimulus disappeared until the eye returned to the cross. In the FXU condition, the observer had as much time as they needed to view the stimulus while holding fixation, and pressed a key to move onto the response screen. For the FXB condition, the stimulus was presented for only 250 ms while the observer fixated on the cross before the screen progressed to the response screen. If the observer’s gaze moved out of the box the stimulus disappeared; further, no additional time was given.
Eye movements were monitored monocularly (right eye) using the Eyelink 1000 Tower Mount (SR Research) while observers viewed the stimulus binocularly. Eye tracker calibration preceded each block of trials. The sequence of events in a trial were as depicted in Figure 2: (i) first, drift-correction with a central fixation for re-centering the eye tracker, (ii) a fixation cross requiring the observer to hold stable fixation for 1500 ms at the fixation cross in the upper half of the screen before stimulus presentation, (iii) an auditory beep to alert the observer to the trial initiation followed by the stimulus presentation, and (iv) response selection in which all 26 lowercase letters were presented alphabetically in a response array. To respond, the observer selected a letter from the response array with a mouse click. Feedback was provided. A high tone beep indicated a correct response, and a low tone beep was used for incorrect response. In the EMU and FXU conditions, the duration of step (iii) varied depending on how long the observer chose to view the stimulus, while in the FXB condition it was fixed to 250 ms.
In all conditions, flanker letters were presented vertically at a range of center-to-center distances relative to the target letter. These were 15 logarithmically spaced values from 0.5° to 6°. In addition to these spacings, there was a no-flanker condition (an infinite spacing), giving a total of 16 spacings. At the smaller spacing distances, the flankers could overlap with the target letter. In such a case, the target object was made to occlude the flankers. For each of the three viewing conditions (EMU, FXU & FXB) and each of the 16 spacings, a block of 60 QUEST trials was used to estimate the threshold contrast for the target identification - giving 48 total blocks per observer. To distribute the conditions evenly, a ‘superblock’ was constructed that consisted of three QUEST blocks, one for each of the three viewing conditions, at the same spacing. The order of the viewing conditions within the 16 superblocks was randomized and the superblock presentation order (for different spacing distances) was also randomized.
2.5 Analysis
Data analysis largely followed the method described in Wallace & Tjan (2011). The data of threshold contrast energy (E), defined as the product of the squared root-mean-square (rms) contrast and the area of the stimulus in degrees squared, versus center-to-center spacing (s) were fit with a clipped line function:
| (1) |
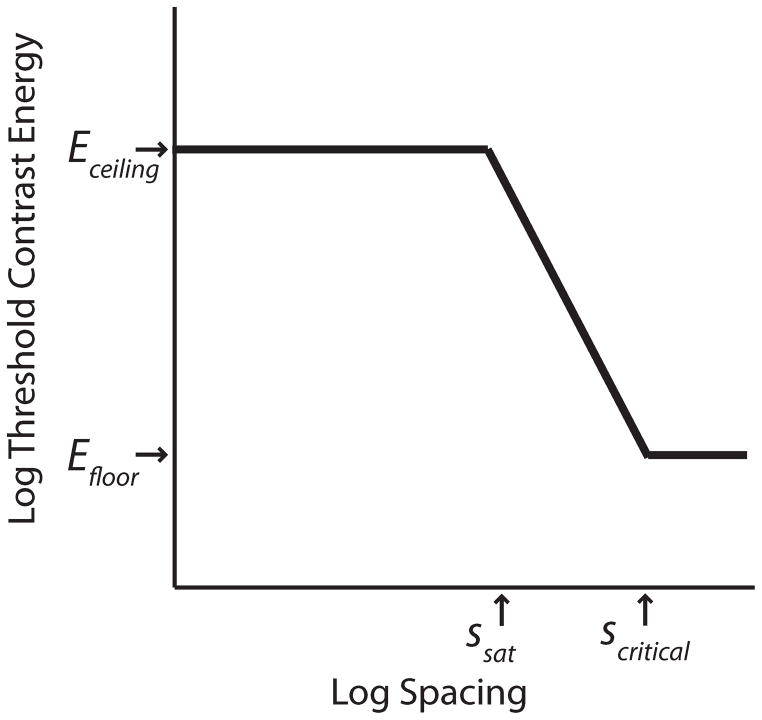
This function (Figure 3) has four parameters: ceiling (Eceiling), floor (Efloor), saturation spacing (ssat) and critical spacing (scritical). It provides an adequate description of the data: the part of the function for s ≥ ssat is commonly used to characterize crowding for relatively large target-flanker spacing (Chung, Levi & Legge, 2001; Pelli, Palomares & Majaj, 2004; Wallace & Tjan, 2011). We estimated the parameters by fitting Equation (1) to the data of each observer using a multi-start procedure, which minimizes the squared residual in log(E) and estimated the 95% (asymmetric) confidence interval of the four parameters (Wallace & Tjan, 2011, Appendix B). For the letter stimuli used in this study, the saturation spacing (Ssat) is related to the minimum spacing at which the target and flankers physically overlap. As such, it depends on letter size and may have little to do with crowding. We omitted saturation spacing from further analysis.
Figure 3.
An illustration of the clipped line function and its key parameters used to describe the threshold vs. spacing data: ceiling contrast energy threshold (Eceiling), floor contrast energy threshold (Efloor), saturation spacing (ssat) and critical spacing (scritical).
We adopted the significance level of α=0.05 for statistical testing. We used a one-way repeated measures ANOVA to assess statistical differences in the parameter estimates across all conditions. To assess specific differences between two conditions, we used a paired t-test. The significance level corrected for multiple comparisons in this case will be p < 0.025 for the two comparisons of interest: EMU vs. FXU, and FXB vs. FXU. To test for effects per observer, we compared the estimated value of each parameter with the bootstrapped 95% confidence interval of the comparison parameter. The difference was considered significant if and only if both values fell outside the confidence intervals of their counterparts.
3. RESULTS
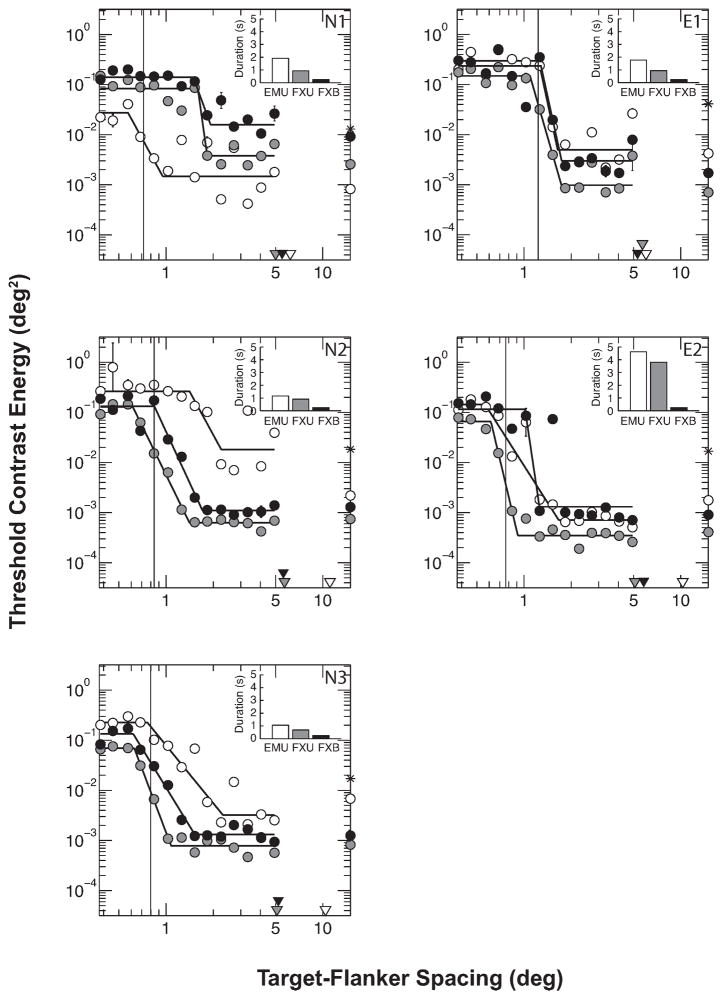
The threshold contrast energy as a function of target-flanker spacing is plotted in Figure 4, along with the corresponding median reaction times. These data are well described by the clipped line function (mean R2 = 0.80). From these functions, it can be seen that for each observer the FXU and FXB functions are quite similar, with the FXB function tending to shift horizontally to a slightly larger critical spacing relative to the FXU function, and in some cases there appears to be a small vertical shift to higher threshold contrast values. In comparison, the EMU function is not consistent in its relation to FXU or FXB across observers. We found no significant main effect of viewing conditions on critical spacing [F(2,8) = 0.752, p = 0.502], ceiling threshold [F(2,8) = 1.177, p = 0.356] or floor threshold [F(2,8) = 2.056, p = 0.190].
Figure 4.
Contrast energy threshold for identifying the target letter as a function of target-flanker spacing in the three viewing conditions. Solid lines show the clipped-line functions fit to the data. Vertical lines represent the target letter size in x-height for each observer (1.5 times the observer’s letter acuity at test eccentricity). N1-3: Novice observers. E1-2: observers experienced with simulated central scotoma. The median stimulus duration of each viewing condition is indicated in the inset. The triangles on the abscissa indicate the effective target eccentricity (eccentricity relative to the position of peak gaze density) for each condition. The circles on the right ordinate indicate contrast energy thresholds for letter identification without flankers. The asterisk on the right ordinate indicates the contrast energy of the flankers. (Flankers were fixed at 30% Weber contrast; contrast energy depends on the letter size used for the observer.)
We next looked specifically at (1) the effect of viewing duration on crowding when eye movements were minimal (conditions FXB vs. FXU), and (2) the effect of eye movement when viewing duration was unlimited (conditions EMU vs. FXU). When considering FXU vs. FXB exclusively, we found that there was a small trend in critical spacing [t(4) = 2.635, p = 0.058], with FXU tending to smaller values than FXB (1.39° vs. 1.63° on average). Indeed, the ratios of critical spacing to target eccentricity were almost identical (0.29±0.05 across observers for FXB versus 0.26±0.07 across observers for FXU). Thus, critical spacing is not affected despite a three to eight times difference in viewing duration between the two conditions (see insets in Figure 4). At the extreme, observer E2 required a median viewing duration of 4600 ms in the FXU condition; yet there was only a small (<0.4°) difference in critical spacing for this observer between FXU and FXB conditions (see Figures 4 & 5). Comparing within each observer, everyone except E1 had a significantly smaller critical spacing for FXU than for FXB, although the differences are small relative to the target eccentricity (around 4% of the target eccentricity).
Figure 5.
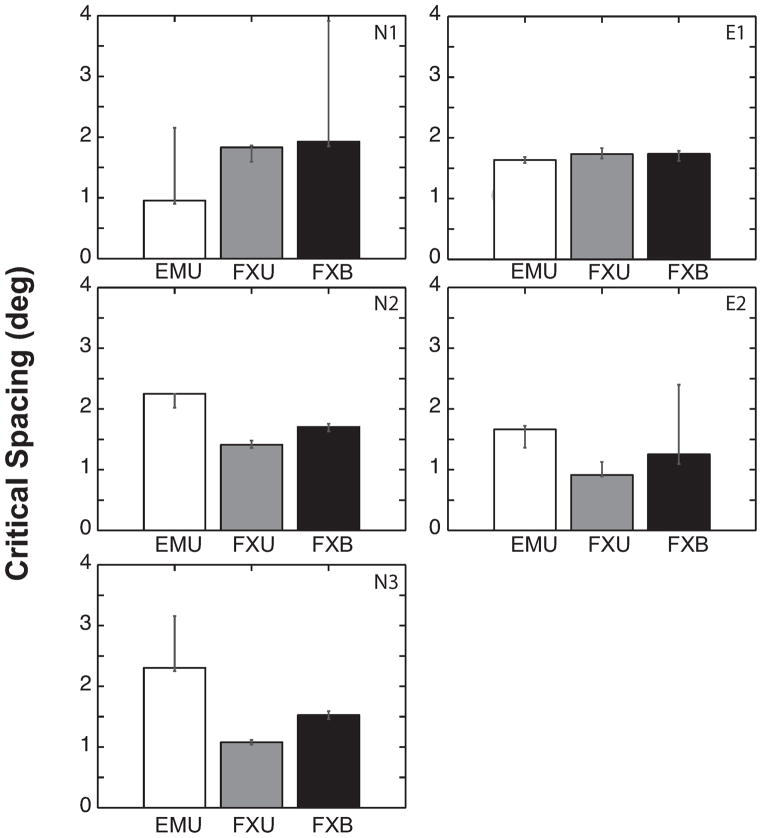
Critical spacing estimated for each viewing condition and observer. Error bars represent the bootstrapped 95% confidence interval, which are noticeably asymmetric. Increased critical spacing means worsening of crowding. For each condition, the lower bound of critical spacing is more tightly estimated than the upper bound. Without eye movements, the estimated critical spacing and its lower bound are reduced in four of five observers with longer viewing duration (FXU vs. FXB), resulting in a small but statistically insignificant difference across all observers [t(4) = 2.635, p = 0.058]. Allowing eye movements (EMU) introduces large individual variability. Compared to the FXU condition, critical spacing increased substantially in the EMU condition for three observers, but overall there was no significant difference between EMU and FXU [t(4) = 0.206, p = 0.847].
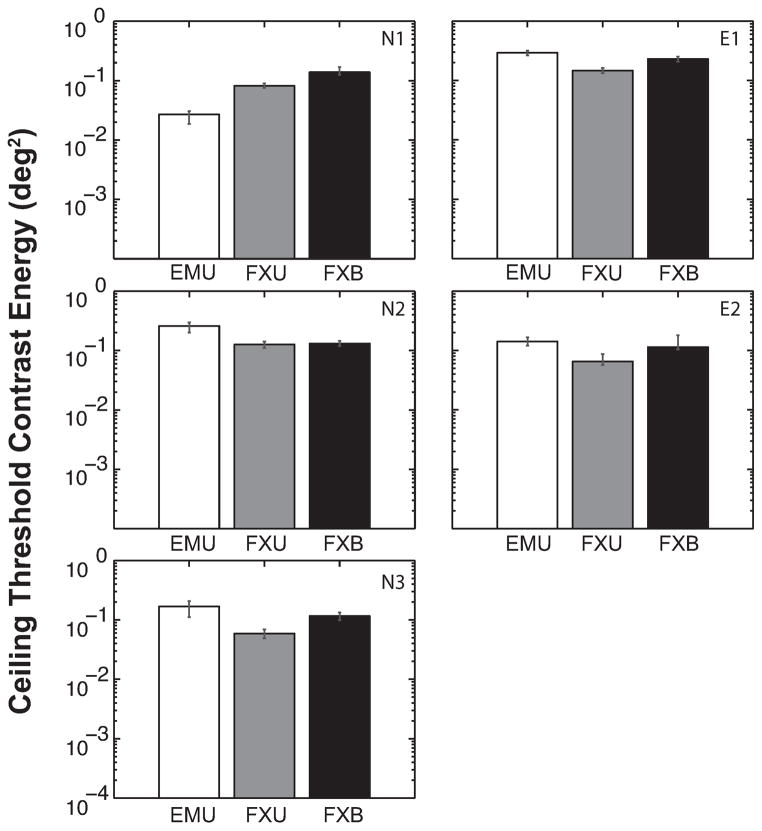
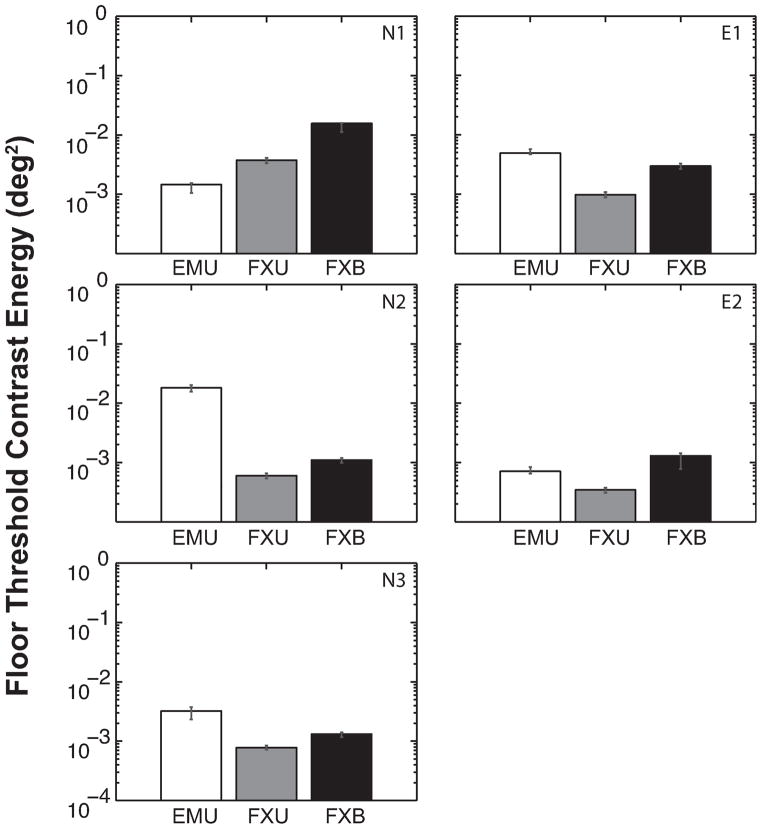
The ceiling threshold was consistently lower for FXU than FXB (Figure 6), and this difference was significant overall [t(4) = 4.187, p = 0.014] and also significant at the individual level for all observers except N2. Floor thresholds were also consistently smaller for FXU than FXB (Figure 7) for every observer, and the difference is significant [t(4) = 5.239, p = 0.006]. This suggests that increasing viewing duration three to eight fold (FXU) from a standard of 250 ms reduces the disruptive effects of crowding on contrast threshold, although its effect on critical spacing did not reach statistical significance at the group level.
Figure 6.
Ceiling contrast energy threshold estimated for each viewing condition and observer. Error bars represent the bootstrapped 95% confidence interval. Ceiling threshold represents the maximum effect of flankers on letter identification was consistently and significantly lower for FXU than FXB [t(4) = 4.187, p = 0.014] but not significantly different for the EMU versus FXU comparison [t(4) = 0.016, p = 0.988].
Figure 7.
Floor contrast energy threshold estimated for each viewing condition and observer. Error bars represent the bootstrapped 95% confidence interval. Floor threshold represents the letter-identification threshold not affected by the presence of the flankers. In the fixation conditions (FXU vs. FXB), longer duration (FXU) generally leads to lower threshold, and this was significant [t(4) = 5.239, p = 0.006]. Allowing eye movements (EMU) introduces large individual variability in floor threshold. With the exception of one observer, the floor threshold in is worsened (elevated) by allowing free eye movements with unlimited viewing time but overall this was not significant [EMU vs. FXU: t(4) = 1.772, p = 0.151].
When eye movements were unrestricted, performance varied hugely across observers, and direct comparisons of EMU vs. FXU across observers did not reveal any significant differences overall for critical spacing [t(4) = 0.206, p = 0.847], ceiling threshold [t(4) = 0.016, p = 0.988] or floor threshold [t(4) = 1.772, p = 0151]. Within each observer, all differences in ceiling and floor thresholds between EMU and FXU were significant, but the differences were not consistent across observers. Similarly, for critical spacing it can be seen that for some observers the EMU value is higher and for others it is lower (Figure 5). For observers N2 and N3, free viewing led to a worsening of crowding, with critical spacing increased significantly from 1.4° (FXU) to 2.3° (EMU) for N2 and from 1.1° to 2.3° for N3, respectively (see Figure 4 & 5). Similarly to these novice observers, scotoma-trained observer E2 showed a significant increase in critical spacing from 0.9° (FXU) to 1.7° (EMU). In contrast, one novice observer, N1, showed a large but statistically non-significant decrease in critical spacing from 1.8° (FXU) to 0.95° (EMU). Highly practiced observer E1 (naive to the purpose of the experiment) showed a significant but small reduction in critical spacing from 1.7° (FXU) to 1.6° (EMU). The full results on the critical spacing can be seen in Figure 4 and Figure 5. Overall, the effect of eye movements appears to increase variability across observers in the spatial extent and magnitude of crowding. We next examined the cause of this variability.
Critical spacing scales with target eccentricity (Bouma, 1970). Unlike the two fixation conditions (FXU/FXB) with target at a relatively fixed eccentricity, in the EMU condition, the eye movements were unrestricted, and the target eccentricity varied across fixations. The artificial scotoma in the EMU condition imposed only a lower bound on target eccentricity. The target letter sizes were around 1° (depending on an observer’s acuity), and the artificial scotoma had a radius of 5.5°. This means that a target letter located at 6° from the central fixation point would not be occluded by the scotoma, but at distances less than 6° the scotoma would start to occlude the stimulus. However, an observer may choose not to place the target as close to the artificial scotoma as possible.
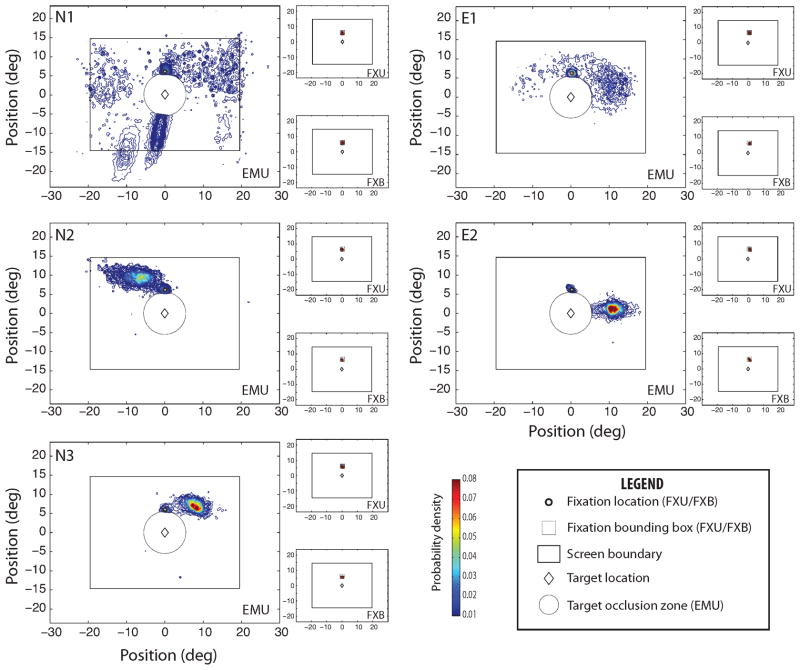
We estimated duration-weighted probability density distribution of gaze positions using an adaptive Gaussian kernel density estimation algorithm (Botev et al., 2010), excluding gaze positions where the scotoma was occluding at least part of the target letter (Figure 8). It is noteworthy that for every observer, the density distribution had a distinct peak of maximum density. We defined the effective eccentricity of the target letter as the eccentricity at peak density, which is robust to outliers. The effective target eccentricity in the fixation conditions (FXB and FXU) ranged from 5° to 5.8°, with a mean of 5.4° - close to the desired target eccentricity of 6°, allowing for the tolerance zone on the fixation position (Table 1).
Figure 8.
Probability densities of gaze positions (or center of the artificial scotoma in the EMU condition) for each observer and condition, excluding gaze positions (target occlusion zone, gray circle) where the scotoma, if present, occludes at least part of the target letter (center of display, small diamond). Gaze is directed accurately at the fixation mark in the fixation conditions (FXU, FXB), but is highly variable across observers in the EMU condition. Gaze was tracked beyond the screen boundary (solid rectangle) to capture eye-movement strategies that relied on extra-stimulus features (e.g. the frame of the screen or other features in the environment). Only one observer (N1) appears to use any extra-stimulus features to guide eye movements.
Table 1.
The effective target eccentricity in degrees, computed from the density estimation of gaze positions (eccentricity relative to the position of maximum density) for each condition and observer.
| EMU | FXU | FXB | |
|---|---|---|---|
| N1 | 6.2 | 5.0 | 5.5 |
| N2 | 11.1 | 5.7 | 5.6 |
| N3 | 10.4 | 5.1 | 5.2 |
| E1 | 6.0 | 5.7 | 5.3 |
| E2 | 10.3 | 5.1 | 5.8 |
In contrast, there was considerable variation in the EMU condition, and the eccentricity could be quite far from that specified in the fixation conditions, ranging from 6° to 11°, and did not appear to depend on experience. For every observer, there is a local peak of gaze density at a position near the extinguished fixation mark, which appeared before stimulus presentation. Viewing the target letter from this position put the target at an eccentricity of 6°. Most observers also used other retinal locations to view the target; however, these locations tended to place the target at a greater eccentricity. The effective target eccentricities in the EMU condition were considerably greater than 6° for three observers (see EMU column of Table 1), suggesting that these observers either could not maintain the initial fixation, which would be advantageous for minimizing eccentricity, or did not prefer viewing the target at this retinal location.
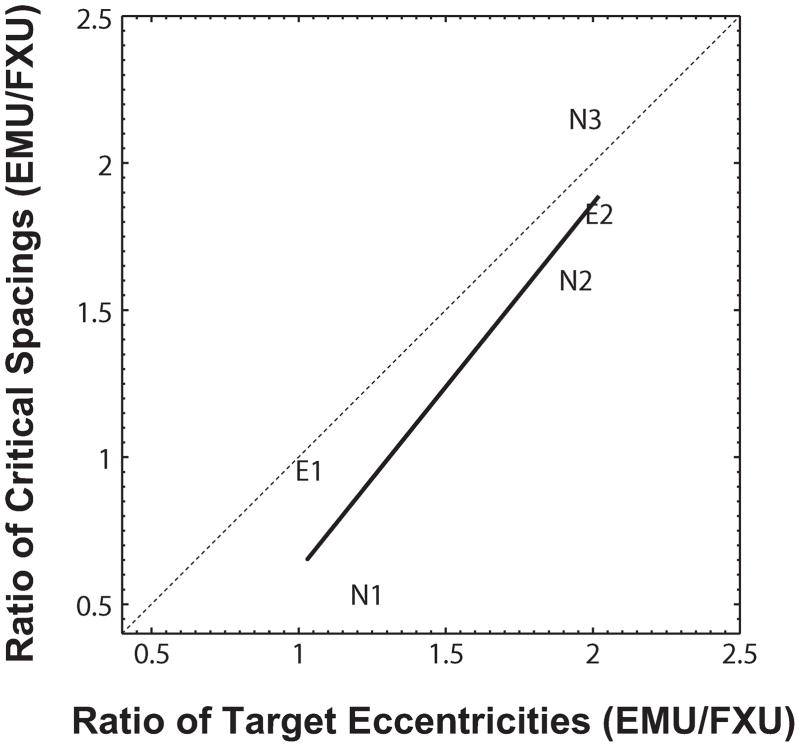
The effective eccentricities for each viewing condition are indicated along the abscissa of Figure 4 as triangles and color-coded to the condition. Critical spacing generally follows the ordering of the effective eccentricities and reflects an eccentricity scaling. The ratio of critical spacing to effective eccentricity within the EMU condition is remarkably consistent across observers: 015 (N1), 0.20 (N2), 0.22 (N3), 0.27 (E1), 0.16 (E2). Although the average ratio of 0.20±0.05 in the EMU condition is lower than a Bouma ratio of 0.5, it is consistent with the average ratio of 0.27±0.06 in the FXB and FXU conditions (and consistent with Wallace & Tjan, 2011). To allow for individual variability in this ‘Bouma’ ratio, we compared the fractional change in critical spacing in the EMU condition relative to the FXU condition against the corresponding fractional change in the effective eccentricity (Figure 9), we found a significant correlation between the two [R2 = 0.79, p = 0.04] and that the relationship between the two was not significantly different from that of an identity [χ2(1)=1.363, p = 0.243]. That is, the critical spacing when eye movements are unrestricted (EMU) can be expressed in terms of the critical spacing in the fixation condition with unlimited viewing time (FXU) scaled by the ratios of the effective eccentricities between these two conditions. In other words, there is no qualitative difference in critical spacing whether eye movements are restricted or not.
Figure 9.
Effective target eccentricity predicts critical spacing in the condition with unrestricted eye movement and simulated central scotoma (EMU). The ratios of critical spacing between the EMU and FXU conditions for all observers are plotted as a function of the corresponding ratios of the effective target eccentricities. The correlation between the two ratios is highly significant [R2 = 0.79, p = 0.04] but not significantly differ from identity [χ2(1)=1.363, p = 0.243].
4. DISCUSSION
Without eye movements, we found no more than a small change in the spatial extent of crowding when viewing duration was unrestricted (actual duration between 700 to 4000 ms) as compared to the brief viewing duration (250 ms). Our results extend the range of the earlier findings on the effect of stimulus duration, assuring that the voluminous measurements of crowding in the literature with briefly presented stimuli are generalizable. In particular, we found that critical spacing is reduced by less than a quarter of a degree (or about 15%), despite extending stimulus duration many times larger than 250 ms. Across observers, this reduction did not reach statistical significance. This result adds to a chorus of findings showing that critical spacing, and thus the spatial extent of crowding, is a particularly robust property of crowding.
However, the present result is in apparent contrast with the findings of Chung & Mansfield (2009) where increasing duration from 57 ms to 1000 ms resulted in a decrease of crowding extent by about 2 degrees, and Tripathy and Cavanagh who found a similar magnitude of decrease in crowding extent but for a much smaller increase in duration from 13 or 27 ms (dependent on observer) up to 360 ms. Both those studies were testing at an eccentricity at or near to 10 degrees and thus represent a larger effect than those at the smaller eccentricity used in the present study. More importantly, the larger effects in these earlier studies may be more attributable to an increase in crowding extent for the shorter-than-250-ms viewing durations they tested, as opposed to a decrease in crowding extent for the longer viewing duration. For example, Chung & Mansfield found that the extent of crowding was already reduced by about a degree from 57 ms to 147 ms, about 50% of the total change they observed when extending duration up to 1000 ms. It is possible that at the smaller eccentricity we tested (6°), we are already at or close to the limit in the extent of crowding with a viewing duration of 250 ms. Taken together, these results suggest that while reducing viewing duration below 250 ms can significantly increase the spatial extent of crowding, increasing viewing duration above 250 ms does not significantly relieve crowding.
Previous studies have found that target type (letters vs. gratings, Pelli, Palomares, & Majaj, 2004; letters vs. objects, Wallace & Tjan, 2011), target size (Pelli, Palomares, & Majaj, 2004; Tripathy & Cavanagh, 2002; Levi, Hariharan, & Klein, 2002; Hariharan, Levi & Klein, 2005), and target-flank similarity in terms of orientation, spatial frequency and polarity (Andriessen & Bouma, 1976; Chung, Levi & Legge, 2001; Hariharan, Levi & Klein, 2005) have at most a small effect on critical spacing. In contrast, these same manipulations have substantial effects on the threshold elevation caused by crowding. Similarly, while extensive practice can modestly decrease critical spacing, by 38% according to Chung (2007), the same learning procedure substantially reduces contrast energy threshold by a factor of 5.5 (pre vs. post noiseless threshold, E0Table A1 of Sun et al., 2011). In the current study, we did find an effect on contrast thresholds associated with crowding when limits on stimulus duration were removed (conditions FXU vs. FXB), with both ceiling and floor thresholds being reduced, concurring with previous evidence that some reduction in the detrimental effect of crowding is possible although the spatial extent of crowding remains unaffected.
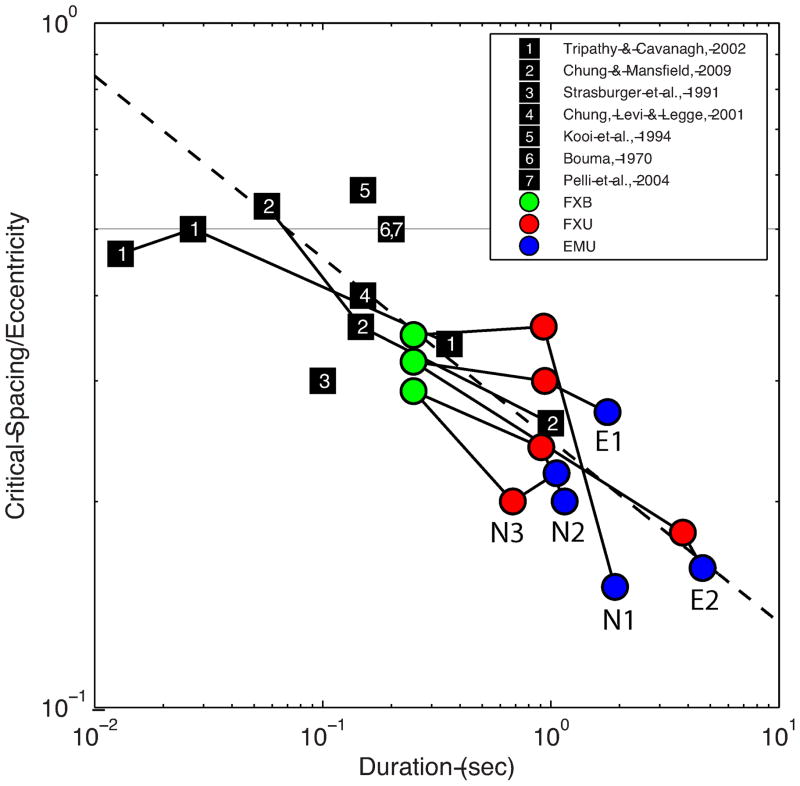
Combining our result with those from earlier studies (Toet & Levi, 1992; Tripathy & Cavanagh, 2002; Chung & Mansfield, 2009) leads to the conclusion that stimulus duration beyond 100 ms has only a marginal effect on critical spacing. Importantly, when we looked at the eccentricity-normalized critical spacing (critical spacing divided by target eccentricity) as a function of stimulus duration across a representative set of the prior studies and extended the range with the present study, we found that for stimulus durations longer than 100 ms, normalized critical spacing is related to stimulus duration by a power law with an exponent of −0.27 (Figure 10). This implies that more than a 13-fold increase in stimulus duration would be required to reduce the critical spacing in half. Reduction of crowding at this gradual rate is unlikely to be due to any change in the inherent spatial interference that defines crowding. Rather, it is most probably a result of having multiple “looks” of the stimulus during a long presentation interval, permitting an accumulation of form information sufficient to result in a small improvement in recognition performance.
Figure 10.
Plot of eccentricity-normalized critical spacing as a function of stimulus duration, over a representative set of studies using letters and numerals as stimuli. Previous studies are plotted as numbered squares, the current data is plotted as colored symbols: FXB (green), FXU (red), EMU (blue). The horizontal gray line represents a ratio of 0.5 times the eccentricity ie. Bouma’s ‘Law’. The solid lines connect data across durations for the same observers (present study with observers identified) or same study (prior studies). The dotted line represents a power law fit to the data, weighted by number of observers of each study. The estimated exponent is −0.27, meaning that over 13-fold increase in stimulus duration is required to reduce critical space by one half.
The sluggish relationship between critical spacing and stimulus duration is consistent with the notion that a bottom-up, and perhaps anatomically defined, mechanism determines critical spacing and the crowding zone. Critical spacing scales linearly with eccentricity (Bouma, 1970), and the crowding zones are elliptical in shape with their long axis pointing along the radial direction towards the fovea (Toet & Levi, 1992). Pelli (2008; see also Pelli & Tillman, 2008) noted that the specific scaling rate determined by Bouma (1970) corresponds to a constant distance of 6 mm on V1 cortex, independent of eccentricity. Nandy and Tjan (2012) linked this 6-mm distance to the average radius of the lateral connections between V1 neurons and attributed the radially elongated shape of the crowding zone to a saccade-induced systematic bias in the natural-scene image statistics acquired and represented by the lateral connections. This theory predicts a robust and stable critical spacing and suggests that the size and shape of the crowding zone can only change gradually when presented with a different visual experience. Theories that associate crowding with stable physiological features such as the receptive field of neurons in specific visual areas (V2: Freeman & Simoncelli, 2011, V4: Motter, 2006) likewise predict a robust and stable critical spacing, and so do theories that explain crowding with bottom-up signal-processing mechanisms (Parkes et al., 2001; Levi, Hariharan, & Klein, 2002; Pelli, Palomares, and Majaj, 2004; Balas, Nakano & Rosenholtz, 2009; Greenwood, Bex, & Dakin, 2009; van den Berg, Roerdink, & Cornelissen, 2010).
Crowding appeared to be made worse and more variable when unrestricted eye movements were allowed in conjunction with occluded central vision in the EMU condition – three observers showed a substantial increase in critical spacing, while two showed a reduction (with one being statistically significant). In the EMU condition, the fixation mark was eliminated when the stimulus appeared. To maintain a stable gaze, a peripheral target must be relied upon. Bellmann et al. (2004) found that peripheral fixation stability in patients with age-related macular generation was about a factor of 10 worse than central fixation in age-matched controls. While crowding has been regarded as a key limiting factor of peripheral form vision (Levi, 2008; Pelli & Tillman, 2008; Whitney & Levi, 2011), most measurements of crowding, particularly obtained from normally sighted observers, were done with stationary gaze. Our result suggests that gaze instability cannot be ignored when considering peripheral form vision in the context of central vision loss.
With unrestricted eye movements, it is conceivable that one could view the stimulus from a direction where the flankers are arranged tangentially relative to the fovea (e.g. observer E2) or use the central scotoma to occlude one of the flankers and thereby partially reduce crowding. However, we did not find any consistent benefit in unrestricting eye movements even for the two observers who were experts in performing visual tasks with simulated central scotoma. There was a very small reduction in crowding in terms of critical spacing for one expert observer (E1); the other (E2) in fact had a large increase in crowding. Neither of the observers showed any reduction in contrast thresholds. Our analysis of the target position with eye movements revealed that observers with an artificial scotoma tend to keep the target at a safe distance from the scotoma and thereby increase the effective target eccentricity. With respect to the effective target eccentricity, the estimated critical spacing in all conditions and across all observers was found to be highly consistent with the known eccentricity scaling for crowding. Thus, while fixation and gaze control appears to be effortful with central scotoma and impedes performance, the spatial extent of crowding is unaffected once we have taken into account the effective target eccentricity.
5. CONCLUSIONS
We found that presentation duration beyond 250 ms has little effect on crowding with stable gaze. Unrestricted eye movements with a simulated central scotoma yield varying and generally worsening peripheral form vision, although the results remain consistent with the accepted eccentricity scaling of crowding. Our results assure that the large body of findings on crowding that utilized briefly presented stimuli are generalizable to conditions where viewing time is unconstrained, such as patients with central vision loss. Our results further suggest that impaired oculomotor control associated with central vision loss can further impede peripheral form vision, but the added impediment can be understood as an increase in crowding due to increased target eccentricity.
Highlights.
We studied crowding with unlimited viewing duration and with unrestricted eye movements.
Stimulus duration beyond 250 ms had little effect on the spatial extent of crowding.
Unrestricted eye movements caused a large variability in crowding extent.
Crowding extent with eye movements was dependent on the effective eccentricity of the target.
Unlimited amount of viewing time and unrestricted eye movements do not reduce crowding in peripheral vision.
Acknowledgments
This work was supported by NIH/NEI Grants R01-EY017707 and R01-EY016093.
Footnotes
Commercial relationships: none.
Publisher's Disclaimer: This is a PDF file of an unedited manuscript that has been accepted for publication. As a service to our customers we are providing this early version of the manuscript. The manuscript will undergo copyediting, typesetting, and review of the resulting proof before it is published in its final citable form. Please note that during the production process errors may be discovered which could affect the content, and all legal disclaimers that apply to the journal pertain.
References
- Andriessen JJ, Bouma H. Eccentric vision: adverse interactions between line segments. Vision research. 1976;16(1):71–78. doi: 10.1016/0042-6989(76)90078-x. [DOI] [PubMed] [Google Scholar]
- Balas B, Nakano L, Rosenholtz R. A summary-statistic representation in peripheral vision explains visual crowding. Journal of vision. 2009;9(12):13.1–18. doi: 10.1167/9.12.13. [DOI] [PMC free article] [PubMed] [Google Scholar]
- Bellmann C, Feely M, Crossland MD, Kabanarou SA, Rubin GS. Fixation stability using central and pericentral fixation targets in patients with age-related macular degeneration. Ophthalmology. 2004;111(12):2265–2270. doi: 10.1016/j.ophtha.2004.06.019. [DOI] [PubMed] [Google Scholar]
- Botev ZI, Grotowski JF, Kroese DP. Kernel density estimation via diffusion. The Annals of Statistics. 2010;38(5):2916–2957. doi: 10.1214/10-AOS799. [DOI] [Google Scholar]
- Bouma H. Interaction effects in parafoveal letter recognition. Nature. 1970;226(5241):177–178. doi: 10.1038/226177a0. [DOI] [PubMed] [Google Scholar]
- Chung STL. Learning to identify crowded letters: does it improve reading speed? Vision research. 2007;47(25):3150–3159. doi: 10.1016/j.visres.2007.08.017. [DOI] [PMC free article] [PubMed] [Google Scholar]
- Chung STL, Levi DM, Legge GE, Tjan BS. Spatial-frequency properties of letter identification in amblyopia. Vision research. 2002;42(12):1571–1581. doi: 10.1016/s0042-6989(02)00065-2. [DOI] [PubMed] [Google Scholar]
- Chung STL, Mansfield JS. Contrast polarity differences reduce crowding but do not benefit reading performance in peripheral vision. Vision research. 2009;49(23):2782–2789. doi: 10.1016/j.visres.2009.08.013. [DOI] [PMC free article] [PubMed] [Google Scholar]
- Chung ST, Mansfield JS, Legge GE. Psychophysics of reading. XVIII. The effect of print size on reading speed in normal peripheral vision. Vision research. 1998;38(19):2949–2962. doi: 10.1016/s0042-6989(98)00072-8. [DOI] [PubMed] [Google Scholar]
- Crossland MD, Culham LE, Kabanarou SA, Rubin GS. Preferred retinal locus development in patients with macular disease. Ophthalmology. 2005;112(9):1579–1585. doi: 10.1016/j.ophtha.2005.03.027. [DOI] [PubMed] [Google Scholar]
- Freeman J, Simoncelli EP. Metamers of the ventral stream. Nature Neuroscience. 2011;14(9):1195–1201. doi: 10.1038/nn.2889. [DOI] [PMC free article] [PubMed] [Google Scholar]
- Greenwood JA, Bex PJ, Dakin SC. Crowding follows the binding of relative position and orientation. Journal of vision. 2012;12(3) doi: 10.1167/12.3.18. [DOI] [PMC free article] [PubMed] [Google Scholar]
- Hariharan S, Levi DM, Klein SA. Crowding” in normal and amblyopic vision assessed with Gaussian and Gabor C’s. Vision research. 2005;45(5):617–633. doi: 10.1016/j.visres.2004.09.035. [DOI] [PubMed] [Google Scholar]
- Kooi FL, Toet A, Tripathy SP, Levi DM. The effect of similarity and duration on spatial interaction in peripheral vision. Spatial vision. 1994;8(2):255–279. doi: 10.1163/156856894x00350. [DOI] [PubMed] [Google Scholar]
- Levi DM. Crowding--an essential bottleneck for object recognition: a mini-review. Vision research. 2008;48(5):635–654. doi: 10.1016/j.visres.2007.12.009. [DOI] [PMC free article] [PubMed] [Google Scholar]
- Levi DM, Carney T. Crowding in peripheral vision: why bigger is better. Current biology: CB. 2009;19(23):1988–1993. doi: 10.1016/j.cub.2009.09.056. [DOI] [PMC free article] [PubMed] [Google Scholar]
- Levi DM, Hariharan S, Klein SA. Suppressive and facilitatory spatial interactions in peripheral vision: peripheral crowding is neither size invariant nor simple contrast masking. Journal of vision. 2002;2(2):167–177. doi: 10.1167/2.2.3. doi:10:1167/2.2.3. [DOI] [PubMed] [Google Scholar]
- Li X, Lu ZL, Xu P, Jin J, Zhou Y. Generating high gray-level resolution monochrome displays with conventional computer graphics cards and color monitors. Journal of neuroscience methods. 2003;130(1):9–18. doi: 10.1016/s0165-0270(03)00174-2. [DOI] [PubMed] [Google Scholar]
- Motter BC. Modulation of transient and sustained response components of V4 neurons by temporal crowding in flashed stimulus sequences. The Journal of neuroscience: the offcial journal of the Society for Neuroscience. 2006;26(38):9683–9694. doi: 10.1523/JNEUROSCI.5495-05.2006. [DOI] [PMC free article] [PubMed] [Google Scholar]
- Motter BC, Simoni DA. Changes in the functional visual field during search with and without eye movements. Visoin research. 2008;48(22):2382–2393. doi: 10.1016/j.visres.2008.07.020. [DOI] [PubMed] [Google Scholar]
- Nandy AS, Tjan BS. Saccade-confounded image statistics explain visual crowding. Nature neuroscience. 2012;15(3):463–469. S1–2. doi: 10.1038/nn.3021. [DOI] [PMC free article] [PubMed] [Google Scholar]
- Parkes L, Lund J, Angelucci A, Solomon JA, Morgan M. Compulsory averaging of crowded orientation signals in human vision. Nature neuroscience. 2001;4(7):739–744. doi: 10.1038/89532. [DOI] [PubMed] [Google Scholar]
- Pelli DG. Crowding: a cortical constraint on object recognition. Current opnion n neurobiology. 2008;18(4):445–451. doi: 10.1016/j.conb.2008.09.008. [DOI] [PMC free article] [PubMed] [Google Scholar]
- Pelli DG, Palomares M, Majaj NJ. Crowding is unlike ordinary masking: distinguishing feature integration from detection. Journal of vision. 2004;4(12):1136–1169. doi: 10.1167/4.12.12. doi:10:1167/4.1212. [DOI] [PubMed] [Google Scholar]
- Pelli DG, Tillman KA. The uncrowded window of object recognition. Nature neuroscience. 2008;11(10):1129–1135. doi: 10.1038/nn.2187. [DOI] [PMC free article] [PubMed] [Google Scholar]
- Strasburger H, Harvey LO, Jr, Rentschler I. Contrast thresholds for identification of numeric characters in direct and eccentric view. Perception & psychophyscs. 1991;49(6):495–508. doi: 10.3758/bf03212183. [DOI] [PubMed] [Google Scholar]
- Sun GJ, Chung STL, Tjan BS. Ideal observer analysis of crowding and the reduction of crowding through learning. Journal of vision. 2010;10(5):16. doi: 10.1167/10.5.16. [DOI] [PMC free article] [PubMed] [Google Scholar]
- Tjan BS, Kwon M, Nandy AS. Changes in oculomotor behavior induced by a simulated central scotoma. Journal of Visoin. 2011;11(11):484–484. doi: 10.1167/11.11.484. [DOI] [Google Scholar]
- Toet A, Levi DM. The two-dimensional shape of spatial interaction zones in the parafovea. Visoin research. 1992;32(7):1349–1357. doi: 10.1016/0042-6989(92)90227-a. [DOI] [PubMed] [Google Scholar]
- Tripathy SP, Cavanagh P. The extent of crowding in peripheral vision does not scale with target size. Visoin research. 2002;42(20):2357–2369. doi: 10.1016/s0042-6989(02)00197-9. [DOI] [PubMed] [Google Scholar]
- van den Berg R, Roerdink JBTM, Cornelissen FW. A neurophysiologically plausible population code model for feature integration explains visual crowding. PLoS computational biology. 2010;6(1):e1000646. doi: 10.1371/journal.pcbi.1000646. [DOI] [PMC free article] [PubMed] [Google Scholar]
- Wallace JM, Tjan BS. Object crowding. Journal of vision. 2011;11(6) doi: 10.1167/11.6.19. [DOI] [PMC free article] [PubMed] [Google Scholar]
- Watson AB, Pelli DG. QUEST: a Bayesian adaptive psychometric method. Perception & psychophyscs. 1983;3(2):113–120. doi: 10.3758/bf03202828. [DOI] [PubMed] [Google Scholar]
- Whitney D, Levi DM. Visual crowding: a fundamental limit on conscious perception and object recognition. Trends in cognitive sciences. 2011;15(4):160–168. doi: 10.1016/j.tics.2011.02.005. [DOI] [PMC free article] [PubMed] [Google Scholar]


