Abstract
Conrad et al. (Reports, 10 August 2012, p. 74) reported a doubling of RNA polymerase II (Pol II) occupancy at X-linked promoters to support 5' recruitment as the key mechanism for dosage compensation in Drosophila. However, they employed an erroneous data processing step, overestimating Pol II differences. Reanalysis of the data fails to support the authors' model for dosage compensation.
In D. melanogaster, dosage compensation is achieved by a ~2-fold up-regulation of genes on the male X chromosome (1, 2). The MSL complex is critical for dosage compensation (3), but the specific mechanisms and stage of the transcriptional process at which it acts are less clear. GRO-seq analyses suggested that facilitated transcriptional elongation plays an important role (4). The article by Conrad et al. (5) appeared to refute this, based on Pol II occupancy (ChIP-seq) in male and female salivary glands. A 2-fold increase was found in Pol II binding starting at promoters and continuing throughout X-linked genes in males compared to females, or male X vs. autosomes. Thus, an entirely initiation-based model was suggested, in which differential elongation plays no role.
We noticed that the analysis by Conrad et al. reported unusually high Pol II ChIP enrichment levels. The average enrichment at the promoters of bound genes was reported to be ~30,000-fold over input (~15 on a log2 scale), orders of magnitude higher than what is typical of robust ChIP-seq experiments. We re-examined the data of Conrad et al. using an independent analysis pipeline (6), finding an average promoter enrichment ratio of ~8-fold rather than ~30,000. More importantly, we found that the difference in the Pol II occupancy between male X-linked and autosomal genes was ~1.2, which is substantially lower than the ~2-fold increase reported by Conrad et al. The reduced ratio does not support an initiation-based model, but rather is inconclusive regarding the steps in the transcription cycle necessary to achieve a 2-fold increase in male X-linked transcription.
This major discrepancy can be traced to an erroneous normalization step in the analysis of Conrad et al. (5) that resulted in overestimation of the Pol II ratios. We repeated the analysis utilizing the same gene lists, annotations, parameters, and code that were provided to us by the authors as well as their previously published pipeline (7). We found that both discrepancies described above can be traced to a single normalization step in their ChIP-seq data processing. Their pipeline calculated log2 ratios of the normalized read counts (IP over input) in 25bp bins and used a moving average with a 400bp window to smooth the resulting profiles. The empty bins and non-finite log2 ratios were removed by the earlier preprocessing steps to avoid introducing bias in the moving average estimates. The moving averages were then multiplied by the square root of the number of remaining bins within each moving average window (7). However, this multiplication was mistakenly performed directly on the log2-transformed ratios, resulting in exponential amplification of the IP over input (Pol II enrichment) ratios, and distorting the comparisons subsequently performed (5).
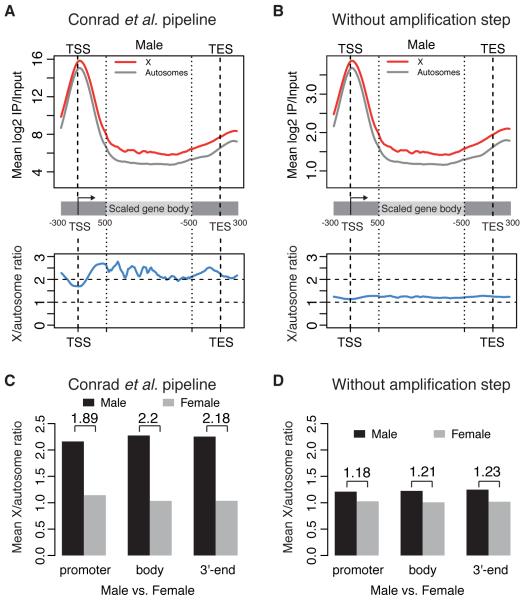
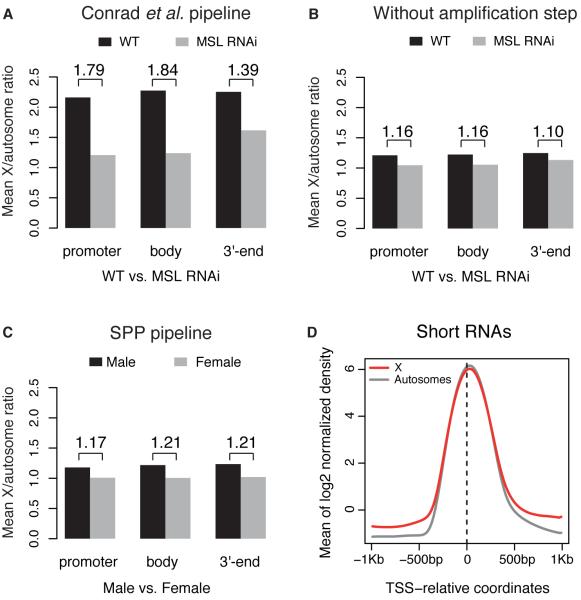
Omitting this multiplication step reduces the average Pol II enrichment levels by three orders of magnitude, bringing them into the 2 to 20-fold enrichment range typical of most ChIP-seq studies (Fig. 1, A vs. B, upper panels). The resulting Pol II ratios for male X-linked genes compared to autosomal genes are around ~1.2-fold (Fig. 1, A vs. B, lower panels), as are Pol II ratios for X-linked genes in males vs. females (Fig. 1, C vs. D). The RNAi experiments were affected in a similar way (Fig. 2A,B). The ~1.2-fold ratio is consistent with what we obtained from the independent analysis pipeline as described above (Fig. 2C). The difference between males and females based on a rank-based test is statistically significant in both cases, but the modest ratio of ~1.2 fails to support a doubling of RNA pol II occupancy at male X-linked promoters, which is the central evidence for the initiation model.
Fig. 1.
Effect of the erroneous multiplication step on the ratio of Pol II binding on X-linked genes compared to autosomal genes. (A) We have reproduced the analysis pipeline in (5). The upper plot reports the average Pol II ChIP over input log2 enrichment ratio along X-linked (red) and autosomal (grey) genes in male salivary glands. The lower plot reports the ratio between X and autosomes. The same annotations and gene lists from Figure 2 by Conrad et al. (5) are used here. (B) Same data as in panel A, but processed without the erroneous multiplication step. (C) Average Pol II binding ratios between X and autosomal genes in male (black) and female (grey) salivary glands, as measured at the promoter, gene body and 3'-end regions. Male over female ratios are also indicated. The data were processed using the ChIP-seq processing pipeline in (5). (D) Same as panel C, but processed without the erroneous amplification step.
Fig. 2.
(A) Average Pol II binding ratios between X and autosomal genes in untreated wild type (black) and MSL2 RNAi treated (grey) male cells, using the same annotations and gene lists as in Figure 4 by Conrad et al. (5). (B) The same as panel B, but processed without the erroneous amplification step. (C) Average Pol II binding ratios between chromosome X and autosomal genes in male (black) and female (grey) salivary glands, analyzed with an alternative pipeline. Normalized ChIP over Input enrichment was computed using the maximum likelihood estimate (MLE) analysis implemented in the SPP package (6). The promoter, gene body and 3'-end regions are analyzed. The numbers on top specify the ratio of male over female values. (D) Short RNAs associated with paused Pol II from (8) show similar density per gene copy around the transcription start sites (TSS) on active X-linked and autosomal genes in males. The same annotations and gene lists from Figure 2 by Conrad et al. (5) were used; data were processed with SPP (6); normalization over genomic control was used to account for differences in copy number.
In a corroborating line of evidence, Conrad et al. examined short RNAs for a panel of genes by qPCR, showing a two-fold increase at X-linked genes in males compared to females. However, genome-wide data from the Adelman lab (8), show that X and autosomal genes exhibit very similar levels of paused RNA, with no evidence of a doubling, on average, at male X-linked genes (Fig. 2D). Finally, the re-analysis of our GRO-seq data (5) is also problematic, as the index for elongation effect they employed ignores the last 500bp of each gene, in addition to the usual first 500bp. This is highly relevant, as genes as short as 1.1Kb were considered and the effect is greatest towards the 3' ends. Thus, the overall evidence in Conrad et al. is insufficient to support the authors' model for dosage compensation.
Acknowledgements
This work was supported by a Sloan Research Fellowship to P.J.P. and NIH grant GM45744 to M.I.K.
References and Notes
- 1.Gelbart ME, Kuroda MI. Drosophila dosage compensation: a complex voyage to the X chromosome. Development. 2009;136:1399. doi: 10.1242/dev.029645. [DOI] [PMC free article] [PubMed] [Google Scholar]
- 2.Conrad T, Akhtar A. Dosage compensation in Drosophila melanogaster: epigenetic fine-tuning of chromosome-wide transcription. Nat Rev Genet. 2011 Feb;13:123. doi: 10.1038/nrg3124. [DOI] [PubMed] [Google Scholar]
- 3.Hilfiker A, Hilfiker-Kleiner D, Pannuti A, Lucchesi JC. mof, a putative acetyl transferase gene related to the Tip60 and MOZ human genes and to the SAS genes of yeast, is required for dosage compensation in Drosophila. EMBO J. 1997 Apr 15;16:2054. doi: 10.1093/emboj/16.8.2054. [DOI] [PMC free article] [PubMed] [Google Scholar]
- 4.Larschan E, et al. X chromosome dosage compensation via enhanced transcriptional elongation in Drosophila. Nature. 2011;471:115. doi: 10.1038/nature09757. [DOI] [PMC free article] [PubMed] [Google Scholar]
- 5.Conrad T, Cavalli FM, Vaquerizas JM, Luscombe NM, Akhtar A. Drosophila dosage compensation involves enhanced Pol II recruitment to male X-linked promoters. Science. 2012;337:742. doi: 10.1126/science.1221428. [DOI] [PubMed] [Google Scholar]
- 6.Kharchenko PV, Tolstorukov MY, Park PJ. Design and analysis of ChIP-seq experiments for DNA-binding proteins. Nat Biotechnol. 2008 Dec;26:1351. doi: 10.1038/nbt.1508. [DOI] [PMC free article] [PubMed] [Google Scholar]
- 7.Ali R, Cavalli FMG, Vaquerizas JM, Luscombe NM. A pipeline for ChIP-seq data analysis (Prot 56) 2012 http://www.epigenesys.eu/index.php/en/protcols/bio-informatics/411-a-pipeline-for-chip-seq-data-analysis.
- 8.Nechaev S, et al. Global analysis of short RNAs reveals widespread promoter-proximal stalling and arrest of Pol II in Drosophila. Science. 2010 Jan;327:335. doi: 10.1126/science.1181421. [DOI] [PMC free article] [PubMed] [Google Scholar]


