

Abstract
Objective
Very low cerebral blood volume (VLCBV), diffusion and hypoperfusion lesion volumes have been proposed as predictors of hemorrhagic transformation following stroke thrombolysis. We aimed to compare these parameters, validate VLCBV in an independent cohort using DEFUSE study data and investigate the interaction of VLCBV with regional reperfusion.
Methods
The EPITHET and DEFUSE studies obtained diffusion and perfusion MRI in patients 3–6 hours from onset of ischemic stroke. EPITHET randomized patients to tPA or placebo, and all DEFUSE patients received tPA. VLCBV was defined as CBV<2.5th percentile of brain contralateral to the infarct. Parenchymal hematoma (PH) was defined using ECASS criteria. Reperfusion was assessed using subacute perfusion MRI co-registered to baseline imaging.
Results
In DEFUSE, 69 patients were analyzed including 9 who developed PH. The >2mL VLCBV threshold defined in EPITHET predicted parenchymal hematoma (PH) with 100% sensitivity, 72% specificity, 35% positive predictive value and 100% negative predictive value. Pooling EPITHET and DEFUSE (163 patients including 23 with PH), regression models using VLCBV (p<0.001) and tPA (p=0.02) predicted PH independent of clinical factors better than models using diffusion or Tmax>8sec lesion volumes. Excluding VLCBV in regions without reperfusion improved specificity from 61% to 78% in the pooled analysis.
Interpretation
VLCBV predicts PH after stroke thrombolysis and appears to be a more powerful predictor than baseline diffusion or hypoperfusion lesion volumes. Reperfusion of regions of VLCBV is strongly associated with post-thrombolysis PH. VLCBV may be clinically useful to identify patients at significant risk of hemorrhage following reperfusion.
Keywords: Stroke, Hemorrhagic transformation, Thrombolytic therapy, MRI, very low cerebral blood volume
Introduction
There is a need for validated, clinically useful, predictors of hemorrhagic transformation (HT) following stroke thrombolysis. A range of clinical and radiological variables have been found to increase the risk of post thrombolysis hemorrhage.1, 2 However with the exception of hypodensity on CT imaging,3 none of these variables are sufficiently reliable to justify withholding tissue plasminogen activator (tPA) from an otherwise eligible patient.
The mechanism of hemorrhagic transformation is thought to be endothelial injury and blood brain barrier disruption due to severe ischemia.4 Three key imaging parameters that have been associated with hemorrhage are diffusion lesion volume,5 very low cerebral blood volume (VLCBV) volume6 and severely delayed blood flow indicated by time to maximum (Tmax)>8sec volume.7–9 All reflect poor collateral blood flow with intense ischemia. However, there is uncertainty about the relationship between hemorrhagic transformation, recanalization and reperfusion. Although reperfusion of injured tissue has long been assumed to underlie hemorrhagic transformation,10 a meta-analysis of stroke studies, where recanalization was assessed, did not demonstrate a difference in symptomatic hemorrhage in patients with and without recanalization.11 However, other studies have suggested an association between recanalization and hemorrhagic transformation. It has been proposed that minor hemorrhagic infarction is more common with early recanalization and is not deleterious to clinical outcome.12, 13 In contrast, PH has been associated with worse clinical outcome.14–16 Reduced rates of symptomatic hemorrhage have been described in patients with early recanalization.12, 17–19 However, variable duration of follow-up for delayed recanalization has complicated the interpretation of whether PH is associated with later, or no, recanalization.
Severely reduced cerebral blood volume (CBV) was proposed as a predictor of hemorrhage risk in 2005.20 We subsequently showed that a measure we termed “very low cerebral blood volume” (VLCBV) was a powerful predictor of hemorrhage in the EPITHET trial where ischemic stroke patients 3–6 hours from onset were randomized to tPA or placebo. VLCBV was defined as CBV less than the 2.5th percentile of normal brain in the contralateral hemisphere. In a previous analysis, a threshold of >2mL VLCBV had excellent sensitivity for the prediction of parenchymal hematoma (PH).6
We therefore aimed to validate VLCBV as a predictor of hemorrhage following stroke thrombolysis in an independent cohort using data from the DEFUSE study.7 We then examined the ability of VLCBV to predict hemorrhage compared with Tmax>8sec perfusion lesion volume, diffusion lesion volume5 and clinical factors in the pooled data from EPITHET and DEFUSE. Finally, we tested the hypothesis that regional reperfusion of severely ischemic tissue in regions of VLCBV would increase the likelihood of PH after thrombolysis.
Methods
EPITHET and DEFUSE were prospective, multicenter trials of thrombolysis 3–6 hours after acute hemispheric ischemic stroke onset, and were conducted between 2001 and 2007. The studies were approved by institutional review boards at all centers and written informed consent was obtained in all cases. Methodological details have been reported previously.21 In brief, EPITHET randomized patients to IV tPA or placebo whereas all patients in DEFUSE received tPA. A baseline noncontrast CT scan was used to exclude patients with acute hemorrhage and major early ischemic change involving >1/3 MCA territory. Patients had MRI (including diffusion, perfusion and magnetic resonance angiography [MRA]) and clinical assessment with the National Institutes of Health Stroke Scale (NIHSS) performed before treatment. Subacute MRI was performed to assess recanalization and reperfusion at 3–6 hours after tPA in DEFUSE, or at day 3–5 in EPITHET. Final clinical outcome (modified Rankin scale mRS) was performed at day 90. In both studies treatment was given without knowledge of the MRI results, which were analyzed centrally prior to unblinding to determine the presence of perfusion-diffusion mismatch.
For this analysis, CBV maps were generated from perfusion source data by calculating the integral of the concentration-time curve. Images were manually bisected through the interhemispheric fissure. Subsequent procedures were automated using Matlab (v2009b, Mathworks, Natick). Smoothing (7 pixel/10.9mm diameter Gaussian kernel) was applied to suppress small isolated pixel clusters related to noise. The contralesional hemisphere was used to calculate percentile values of normal CBV. The previously determined optimal threshold of <2.5th percentile6 was used to define VLCBV. The threshold was applied to both grey and white matter as it falls below the normal range for any brain region. Relative Time to Peak (relTTP) maps were generated using normalization to the mean of the contralateral hemisphere. VLCBV was restricted to regions with sub-threshold CBV within an a priori region of interest (ROI) defined by relTTP>4sec. This ROI was generated by first applying the >4sec threshold and then performing morphological closure to fill in any “holes” due to undetectable contrast arrival (Figure 1). True regions of VLCBV can only occur in regions of abnormal perfusion, so restricting VLCBV to the relTTP>4sec ROI excluded obvious false positive voxels. To assess the interaction of VLCBV with reperfusion in more detail, regional reperfusion was defined using subacute relTTP coregistered to baseline relTTP. Regions without reperfusion (persistent relTTP>4sec) on the subacute imaging were removed from the acute perfusion lesion that was used to restrict VLCBV such that only regions of VLCBV that reperfused were considered for this subanalysis. Given the relatively delayed assessment of reperfusion in EPITHET, the analysis was repeated in the subgroup of patients who received tPA to exclude any effect of spontaneous reperfusion in placebo-treated patients.
Figure 1. Processing pathway to calculate very low cerebral blood volume (VLCBV).
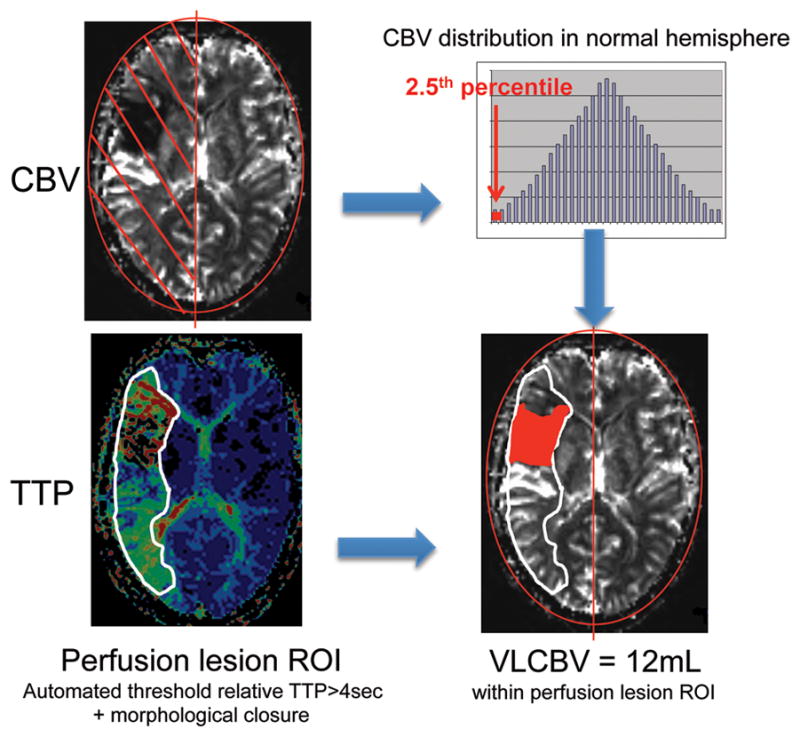
Cerebral blood volume (CBV) map = integral of concentration time curve Time to peak (TTP) map = time to peak concentration, normalized to mean of contralateral hemisphere. Smoothing using 7pixel diameter Gaussian kernel.
The diffusion lesion volume was calculated using the original manually drawn acute diffusion lesion ROIs from EPITHET and DEFUSE after review by a single operator (B.C.) to ensure consistency. To achieve uniform evaluation of Tmax, an automated software package was used to re-process images from both studies (RAPID, Stanford University, California).22 Automated Tmax segmentation ROIs were reviewed by a single stroke neurologist (D.A.D.), who manually excluded artifact from the ROI when indicated.23 Vessel occlusion was assessed using MRA and the original trial gradings were reviewed by two stroke neurologists (D.A.D. and J.M.O.) and condensed to “complete”, “partial” or “no” vessel obstruction.23 Recanalization was defined as a ≥1 grade improvement in this scale.
Grading of HT, using gradient echo imaging in the majority and CT in 7 cases where MRI was unavailable, was performed by consensus of 3 experienced neurologists without knowledge of the VLCBV results using the European Cooperative Acute Stroke Study (ECASS) classification24 of hemorrhagic infarct (HI: petechial HT) or parenchymal hematoma (PH: HT with mass effect – PH1 <30% of infarcted area, PH2 >30% of infarcted area). Symptomatic intracerebral hemorrhage (sICH) was defined using SITS criteria.25
Statistical analysis was performed using Stata (v12.1, Statacorp, College Station, Texas). The sensitivity, specificity, positive predictive value (PPV), negative predictive value (NPV) and likelihood ratios (LR) were calculated for the 2mL cut-point volume of VLCBV previously derived from receiver-operating-characteristic (ROC) analysis using the EPITHET data.6 Tmax lesion volume was analyzed using the previously proposed threshold of Tmax>8sec.8, 9 In addition, an ROC analysis was performed to determine the optimal Tmax threshold to predict PH. The data were then transformed (by the 5th root) to approximate normal distribution as judged by skewness, kurtosis and visual inspection. Multivariable binary logistic regression was used to analyze baseline VLCBV, diffusion and Tmax lesion volumes (as continuous variables) alongside established clinical prognostic factors (age, baseline NIHSS, tPA treatment, diabetes, atrial fibrillation) as predictors of PH. Bayesian information criterion (BIC)26 was used as a scalar measure to compare the overall goodness of fit for regression models using VLCBV, diffusion or Tmax lesion volume combined with clinical factors. Scalar measures of fit provide an index of a regression model’s adequacy and models with better overall goodness of fit are generally preferred. Differences in BIC of +2–6 are regarded as “positive”, 6–10 “strong” and greater than +10 “very strong”.26
Results
Baseline diffusion and perfusion imaging were analyzed for 163 of 174 patients in the pooled EPITHET and DEFUSE data. In DEFUSE, 3 patients were excluded due to failed contrast bolus, one had excessive motion and one had no perfusion data. In EPITHET, 4 patients were excluded due to failed contrast bolus and 2 patients died before repeat imaging could be performed. Forty two of 163 (26%) patients had HI and 23 (14%) had PH, including 9 (6%) with sICH. One patient with hemorrhage remote to the infarct, identified on imaging at 72hrs and attributed to therapeutic heparin, was not eligible for analysis due to lack of perfusion data. The VLCBV>2mL threshold validation cohort utilized 69 of 74 DEFUSE patients and included 9 patients with PH and 11 with HI. Clinical characteristics are listed in Table 1.
Table 1.
Clinical characteristics of patients
| DEFUSE | EPITHET | Pooled EPITHET-DEFUSE cohort
|
|||
|---|---|---|---|---|---|
| validation cohort | cohort | tPA | Placebo | p-value* | |
| Number | 69 | 94 | 117 | 46 | |
| Age (mean [sd], years) | 71.3 [14.7] | 71.8 [13.3] | 71.8 [14.0] | 71.0 [13.7] | 0.65 |
| Gender (number [%] male) | 30 [43%] | 51 [54.3%] | 58 [49%] | 23 [50%] | 0.99 |
| Hypertension (number [%]) | 43 [62%] | 65 [69%] | 80 [68%] | 28 [61%] | 0.36 |
| Diabetes (number [%]) | 19 [28%] | 22 [23%] | 30 [26%] | 11 [24%] | 0.99 |
| Smoking (number [%]) | 30 [43%] | 33 [35%] | 45 [38%] | 18 [39%] | 0.99 |
| Atrial fibrillation (number [%]) | 17 [25%] | 39 [41%] | 39 [33%] | 17 [37%] | 0.72 |
| Time to treatment (mean, [sd], min) | 324 [37] | 294 [47] | 313 [42] | NA | |
| Baseline NIHSS (median, IQR) | 11 [8–16] | 13 [8–17] | 12 [8–16.5] | 10.5 [8–17] | 0.83 |
| Acute DWI volume (mean, [sd] ml) | 29.4 [34.3] | 38.9 [47.2] | 28.9 [37.2] | 43.4 [53.3] | 0.06 |
| Parenchymal Hematoma** (number [%]) | 9 [13%] | 14 [15%] | 19 [16%] | 4 [8.7%] | 0.32 |
| Hemorrhagic Infarction** (number [%]) | 11 [16%] | 31 [33%] | 23 [20%] | 19 [41%] | 0.009 |
| Symptomatic hemorrhage*** (number [%]) | 4 [5.6%] | 4 [4.3%] | 8 [6.8%] | 0 [0%] | 0.11 |
p-value comparing pooled tPA vs placebo patients, Mann-Whitney or Fisher’s exact for categorical variables,
ECASS classification: parenchymal hematoma = blood clot with mass effect; hemorrhagic infarction = petechial hemorrhage without mass effect,
SITS definition
VLCBV and hemorrhage risk
In DEFUSE, VLCBV>2mL was present in 26 of 69 (38%) patients, including all 9 patients with subsequent PH. The diagnostic characteristics for both PH and sICH are presented in Table 2 along with those for the pooled EPITHET-DEFUSE data. The one patient with “false negative” low VLCBV in the pooled EPITHET and DEFUSE data had reperfusion of a basal ganglia diffusion lesion before baseline imaging, with subsequent symptomatic PH in that region after tPA. In all other cases, PH arose in the region of VLCBV (Figure 2). In the pooled data, the median VLCBV volume was higher in patients with PH (10.6mL, IQR 4.3–29mL) compared to those with HI (3.9mL, IQR 1.7–12mL, p<0.001) and no PH (0.1mL, IQR 0–2.5mL, p<0.001), Table 3.
Table 2.
Diagnostic accuracy of very low cerebral blood volume (VLCBV) for parenchymal hematoma (PH) and symptomatic intracerebral hemorrhage (sICH).
| PH | Sens | Spec | PPV | NPV | LR | AUC* |
|---|---|---|---|---|---|---|
| DEFUSE (n=69) | 100% (66–100%) | 72% (59–83%) | 35% (17–56%) | 100% (92–100%) | 3.5 (2.4–5.3) | 0.89 (0.80–0.97) |
| EPITHET-DEFUSE (all, n=163) | 96% (78–100%) | 61% (53–70%) | 29% (19–40%) | 99% (94–100%) | 2.5 (2.0–3.1) | 0.81 (0.74–0.88) |
| EPITHET-DEFUSE (excluding VLCBV regions that did not reperfuse n=144) | 100% (79–100%) | 78% (70–85%) | 36% (22–52%) | 100% (96–100%) | 4.6 (3.3–6.3) | 0.86 (0.80–0.93) |
| EPITHET-DEFUSE (excluding VLCBV regions that did not reperfuse in tPA group only n=101) | 100% (74–100%) | 83% (74–90% | 44% (25–65%) | 100% (95–100%) | 5.9 (3.7–9.4) | 0.90 (0.83–0.96) |
|
| ||||||
| sICH (SITS) | Sens | Spec | PPV | NPV | LR | AUC* |
|
| ||||||
| DEFUSE (n=69) | 100% (40–100%) | 66% (53–77%) | 15 (4.4–35%) | 100% (92–100%) | 3.0 (2.1–4.2) | 0.89 (0.77–1.0) |
| EPITHET-DEFUSE (all, n=163) | 88% (47–100% | 55% (47–63%) | 9.2% (3.8–18.1%) | 99% (94–100%) | 2.0 (1.4–2.7) | 0.75 (0.63–0.88) |
| EPITHET-DEFUSE (excluding VLCBV regions that did not reperfuse n=144) | 100% (29–100% | 71% (63–78%) | 6.8% (1.4–19%) | 100% (96–100%) | 3.4 (2.7–4.5) | 0.91 (0.83–0.99) |
| EPITHET-DEFUSE (excluding VLCBV regions that did not reperfuse in tPA group only n=101) | 100% (29–100%) | 76% (66–84%) | 11% (2.4–29%) | 100% (95–100%) | 4.1 (2.9–5.8) | 0.94 (0.88–1.0) |
Sens: Sensitivity, Spec: Specificity, PPV: Positive Predictive Value, NPV: Negative Predictive Value, LR: Likelihood ratio with 95% confidence intervals, using VLCBV>2mL dichotomy reported with 95% confidence interval, AUC: area under curve *using VLCBV as a continuous variable. sICH SITS definition (PH2 + ≥4 point NIHSS deterioration)
Figure 2. Baseline VLCBV, reperfusion status and subsequent imaging for hemorrhagic transformation.
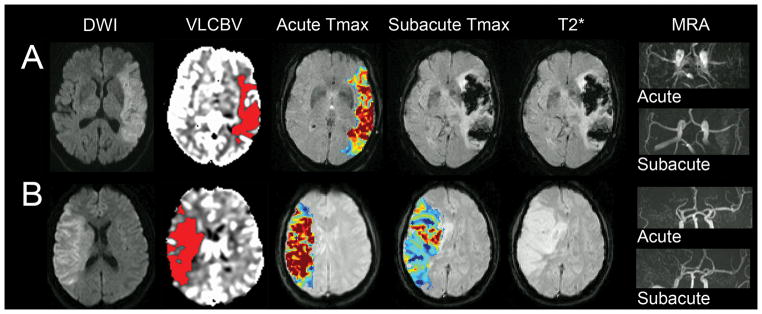
A) Large left MCA infarct with extensive VLCBV, reperfused and recanalized at subacute imaging and developed PH2.
B) A second patient also with extensive baseline VLCBV but without reperfusion, who did not develop PH.
Table 3.
Characteristics of patients by hemorrhagic transformation grade (pooled EPITHET-DEFUSE)
| no HT | HI | PH1 | PH2 | sICH SITS |
|
|---|---|---|---|---|---|
| Number | 98 | 42 | 14 | 9 | 8 |
| Age (mean [sd]) | 70.1 [14.5] | 73.8 [12.8] | 74.5 [14.2] | 72.6 [11.3] | 71.5 [14.0] |
| Gender (number [%] male) | 46 [47%] | 22 [52%] | 7 [50%] | 5 [56%] | 4 [50%] |
| Hypertension (number [%]) | 64 [65%] | 28 [67%] | 9 [64%] | 7 [78%] | 6 [75%] |
| Diabetes (number [%]) | 20 [20%] | 14 [33%] | 3 [21%] | 4 [44%] | 4 [50%] |
| Smoking (number [%]) | 38 [39%] | 14 [33%] | 5 [36%] | 6 [67%] | 5 [63%] |
| Atrial fibrillation (number [%]) | 27 [28%] | 16 [38%] | 9 [64%] | 4 [44%] | 3 [38%] |
| Received tPA (number [%]) | 75 [77%] | 23 [55%] | 10 [71%] | 9 [100%] | 8 [100%] |
| Time to treatment (mean, [sd], min) | 312 [43] | 303 [46] | 288 [56] | 292 [38] | 292 [41] |
| Baseline NIHSS (median, IQR) | 10.5 [8–16] | 15 [10–18] | 16 [12–17] | 12 [10–21] | 14 [9.5–22] |
| Acute DWI volume (mean, [sd] ml) | 9.70 [3.16–26.4] | 23.8 [13.4–65.4] | 50.2 [15.8–81.9] | 52.9 [31.6–128.2] | 46.3 [29.9–131.8] |
| Acute Tmax>8sec volume (median, [IQR] ml) | 8.25 [0–32.8] | 31.6 [7.5–72.1] | 36.7 [16.4–96.3] | 32.9 [7.5–93.8] | 27.8 [5.3–97.9] |
| Acute VLCBV volume (median, [IQR] ml) | 0.13 [0–1.88] | 3.85 [1.69–10.4] | 10.40 [4.70–21.5 | 10.57 [3.16–44.5] | 7.48 [2.93–31.69] |
VLCBV was a significant predictor of PH in multivariate binary logistic regression, which included tPA, age, baseline stroke severity, diabetes and atrial fibrillation (p<0.001). This model was superior in terms of goodness of fit to the model with clinical variables only and to models substituting diffusion lesion volume or Tmax>8sec lesion volume in place of VLCBV using Bayesian information criterion (BIC difference +17.7 for VLCBV vs clinical, +4.8 for VLCBV vs diffusion and +14.9 for VLCBV vs Tmax>8sec, differences +2–6 are regarded as “positive”, 6–10 “strong” and greater than +10 “very strong”26). Results followed a similar pattern using sICH as the outcome variable (BIC difference +2.7 for VLCBV vs clinical, +2.7 for VLCBV vs diffusion and +6.3 for VLCBV vs Tmax>8sec). Although elevated blood pressure and serum glucose have been associated with increased risk of hemorrhagic transformation in previous studies, neither factor was significant in this dataset. Time to treatment was also not associated with PH within this relatively confined 3–6hr treatment window.
In ROC analysis, the optimal Tmax threshold to predict PH was Tmax>14sec (AUC 0.73, non-significantly greater than Tmax>8sec AUC 0.69, p=0.16). Tmax>14sec (p=0.002) and Tmax>8sec lesion volume (p=0.024) both predicted PH independent of clinical factors. Of note, Tmax of 8–14sec, which on average comprised 55% of the Tmax>8sec volume, did not predict PH (p=0.10) in the same multivariate model. The model with VLCBV and clinical factors also exhibited better goodness of fit than that substituting Tmax>14sec for VLCBV (BIC +10.1).
Parenchymal hematoma was associated with death or dependency (mRS 3–6) at day 90 in 64% of patients with PH1 and in all patients with PH2. The association of PH with increased day 90 mRS was independent of age, baseline NIHSS, tPA, AF and diabetes (p=0.009) in ordinal logistic regression. This was chiefly due to the effect of PH2 and PH1 considered alone was not significant although power was reduced by having fewer cases. Notably, 11 of 23 (48%) PHs, including four of eight with sICH, occurred in patients with acute DWI lesion volumes of less than 50mL. These hemorrhages were all predicted by VLCBV>2mL (Figure 3), illustrating the advantage of VLCBV over DWI in predicting hemorrhage in small-moderate infarcts.
Figure 3. Illustration of the advantages of VLCBV over diffusion lesion volume in small-moderate infarcts.
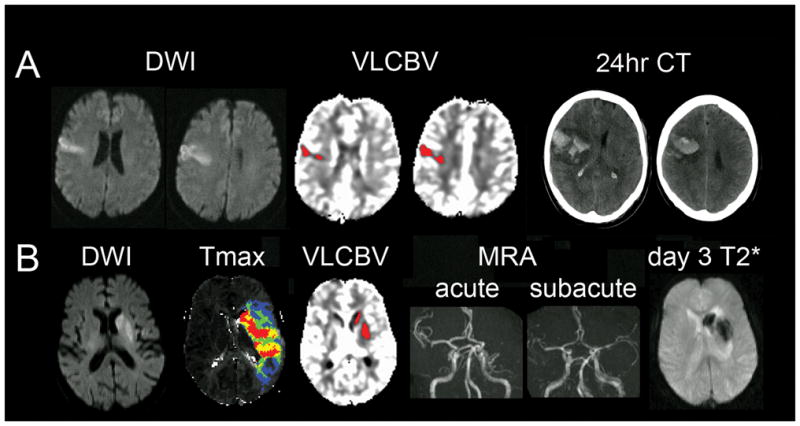
A) Very small cortical diffusion lesion but significant VLCBV occupying the majority of the diffusion lesion. Patient developed PH2 (symptomatic) after receiving tPA.
B) A second patient with a small region of basal ganglia diffusion restriction, mostly occupied by VLCBV, associated with a large MCA perfusion lesion. Patient developed PH in the region of VLCBV after tPA lead to MCA recanalization.
Recanalization and regional reperfusion
Recanalization was able to be assessed in 94 patients and occurred in 10 of 12 (83%) PH cases. Recanalization was an independent predictor of PH in multivariate logistic regression with VLCBV (p=0.01) and an interaction term between recanalization and VLCBV was significant (p=0.03). This analysis is conservative as the two patients with PH assessed as “not recanalized” did not develop the PH until later on, at which time the vessel status was uncertain. There were 147 patients with subacute perfusion imaging, at which time 19 (12.9%) had developed PH. Three patients without reperfusion or PH on subacute MRI were later found to have PH on CT. These patients were excluded from the subsequent analysis of VLCBV reperfusion as their reperfusion status at the time of PH was unknown. Table 2 illustrates the improvement in specificity and positive predictive value of VLCBV when reperfusion was considered. This was further improved by considering only tPA patients to exclude the effect of delayed spontaneous reperfusion in EPITHET placebo patients.
Discussion
In this, the largest systematic study of the effects of recanalization and reperfusion of severely ischemic brain after stroke thrombolysis, restoration of blood flow to regions of VLCBV was strongly associated with the development of PH. The high sensitivity and specificity of VLCBV for prediction of hemorrhage demonstrated in EPITHET6 has been confirmed in an independent dataset. In the larger pooled dataset, VLCBV was a better predictor of PH than diffusion or Tmax lesion volume. VLCBV was able to predict PH in patients with small to moderate diffusion lesions, which may otherwise have been deemed at low risk of hemorrhagic transformation, and also indicated the likely site of hemorrhagic transformation.
Tmax>8sec lesion volume was previously shown in this dataset to provide the optimal definition of “malignant profile” (patients who have poor clinical outcome after reperfusion) and PH was significantly more common in patients with the “malignant profile” who reperfused.9 The current analysis suggests that Tmax>14sec may have slightly better characteristics for predicting PH and that the milder Tmax 8–14sec lesion volume, which generally comprises a significant proportion of Tmax>8sec lesion volume, does not contribute to hemorrhage prediction. This may relate to Tmax>8sec representing a combination of delayed flow (predominantly in the 8–14sec range) and very low flow (including VLCBV). Delayed flow in the absence of VLCBV may not predict PH. Importantly, no Tmax-derived parameter performed as well as VLCBV in logistic regression modelling.
Parenchymal hematoma developed in almost half (44%) of patients treated with tPA who “successfully” reperfused regions of VLCBV. The development of PH signaled a poor prognosis with two thirds of those with PH1 and all of those with PH2 dead or dependent on others for activities of daily living by day 90. Whilst this implies that tPA was not of benefit to these patients, it was mainly PH2 that had an association with poor functional outcome independent of other clinical variables. Given that half the patients with VLCBV did not develop PH despite reperfusion, we do not suggest that VLCBV be used in isolation as a means to select patients for therapy. However, VLCBV does appear to provide risk stratification which could be valuable in conjunction with information on the volume and location of tissue at risk of infarction provided by, for example, perfusion-diffusion mismatch. The high negative predictive value of VLCBV may provide reassurance that the risk of hemorrhage is low in ~50% of stroke patients. Therefore VLCBV may have a role in therapeutic decision making regarding reperfusion therapies and further validation in large datasets should be pursued to confirm the clinical significance of VLCBV. Calculation of VLCBV can be automated and was recently incorporated in the fully automated perfusion processing software RAPID (Stanford University). VLCBV calculation adds only a few seconds to the standard perfusion processing pathway which totals <5mins.
There are some limitations of this study. Only patients with baseline imaging 3–6 hours after stroke onset were included in EPITHET and DEFUSE and the risk of hemorrhage associated with VLCBV may be different in patients presenting and imaged earlier. Breakdown of the blood-brain barrier as a result of severe ischemic injury underlies hemorrhagic transformation.4 However, this breakdown follows the phases of ionic and vasogenic edema which take some time and so very early reperfusion (within 3 hours) may carry a reduced risk of hemorrhage,12, 17 even in patients with significant regions of VLCBV. Time to thrombolysis was not significantly related to PH in our analysis. Even in a meta-analysis of tPA studies including patients treated 0–6 hours from onset, the observed trend towards increased sICH at later treatment times was not significant.27 However, this association may have been underestimated due to modest reperfusion success with tPA,28, 29 and the variable time interval that may exist between treatment and reperfusion should it occur.30 Another consideration when interpreting VLCBV is that the hemorrhage risk associated with partial spontaneous reperfusion prior to imaging is unknown. There was clearly one patient where reperfusion of basal ganglia infarction had occurred (with CBV normalization) prior to thrombolysis with subsequent development of PH. Spontaneous reperfusion in the EPITHET placebo patients at the relatively late reperfusion assessment (3–5 days) may also have had different implications for the risk of HT than early reperfusion induced by tPA. VLCBV specificity improved when these patients were excluded. However, the variation in reperfusion assessment time does not impact the observation that PH did not occur in the absence of reperfusion. The PH rate of 16% in this dataset is consistent with the published literature.31–33 This study focused on the prediction of hemorrhagic transformation within the ischemic region. However, hemorrhage remote to the infarct can occasionally occur (1/174 patients in EPITHET-DEFUSE) and could not be predicted by perfusion or diffusion MRI.
This study clearly establishes an association between reperfusion of severely ischemic tissue and the pathogenesis of HT. No patient with subacute reperfusion assessment developed PH without reperfusion of a region of VLCBV. Intravenous tPA undoubtedly increases reperfusion. However, increasing use of endovascular clot retrieval therapies with the promise of significantly greater reperfusion rates may heighten the exposure to reperfusion risks as well as benefits. The concept of futile recanalization is increasingly recognised34, 35 and further studies are warranted to examine the potential for VLCBV to assist selection of patients for intra-arterial reperfusion therapies.
Acknowledgments
The EPITHET study was supported by the National Health and Medical Research Council of Australia, National Stroke Foundation and National Heart Foundation of Australia.
The DEFUSE study was funded by National Institutes of Health (NIH) grants RO1 NS39325, Principal Investigator, Gregory W. Albers; K24 NS044848, Principal Investigator, Gregory W. Albers; and K23 NS051372, Principal Investigator Maarten G. Lansberg. tPA was supplied at no charge by Boehringer Ingelheim (Australia, New Zealand and European sites) and Genentech (U.S. and Canada sites). Neither Boehringer Ingelheim, Genentech nor the NIH played a role in the design and the conduct of the studies; collection, management, analysis, and interpretation of the data; or preparation or approval of the manuscript.
Dr. Campbell receives research support from the NHMRC of Australia (Early Career Fellowship 1035688), the Heart Foundation of Australia, a Cardiovascular Lipid (CVL) Australia grant and the Neuroscience Foundation of the Royal Melbourne Hospital. Roland Bammer receives support from NIH grant R01 EB002711.
Infrastructure support was received for these studies through the Victorian Government Operational Infrastructure Program to the Florey Institute of Neuroscience and Mental Health.
References
- 1.Lansberg MG, Albers GW, Wijman CA. Symptomatic intracerebral hemorrhage following thrombolytic therapy for acute ischemic stroke: a review of the risk factors. Cerebrovasc Dis. 2007;24:1–10. doi: 10.1159/000103110. [DOI] [PubMed] [Google Scholar]
- 2.Lou M, Safdar A, Mehdiratta M, et al. The HAT Score: a simple grading scale for predicting hemorrhage after thrombolysis. Neurology. 2008;71:1417–1423. doi: 10.1212/01.wnl.0000330297.58334.dd. [DOI] [PMC free article] [PubMed] [Google Scholar]
- 3.Tanne D, Kasner SE, Demchuk AM, et al. Markers of increased risk of intracerebral hemorrhage after intravenous recombinant tissue plasminogen activator therapy for acute ischemic stroke in clinical practice: the Multicenter rt-PA Stroke Survey. Circulation. 2002;105:1679–1685. doi: 10.1161/01.cir.0000012747.53592.6a. [DOI] [PubMed] [Google Scholar]
- 4.Simard JM, Kent TA, Chen M, et al. Brain oedema in focal ischaemia: molecular pathophysiology and theoretical implications. Lancet Neurol. 2007;6:258–268. doi: 10.1016/S1474-4422(07)70055-8. [DOI] [PMC free article] [PubMed] [Google Scholar]
- 5.Singer OC, Humpich MC, Fiehler J, et al. Risk for symptomatic intracerebral hemorrhage after thrombolysis assessed by diffusion-weighted magnetic resonance imaging. Ann Neurol. 2008;63:52–60. doi: 10.1002/ana.21222. [DOI] [PubMed] [Google Scholar]
- 6.Campbell BCV, Christensen S, Butcher KS, et al. Regional very low cerebral blood volume predicts hemorrhagic transformation better than diffusion-weighted imaging volume and thresholded apparent diffusion coefficient in acute ischemic stroke. Stroke. 2010;41:82–88. doi: 10.1161/STROKEAHA.109.562116. [DOI] [PubMed] [Google Scholar]
- 7.Albers GW, Thijs VN, Wechsler L, et al. Magnetic resonance imaging profiles predict clinical response to early reperfusion: the diffusion and perfusion imaging evaluation for understanding stroke evolution (DEFUSE) study. Ann Neurol. 2006;60:508–517. doi: 10.1002/ana.20976. [DOI] [PubMed] [Google Scholar]
- 8.Kim JH, Bang OY, Liebeskind DS, et al. Impact of baseline tissue status (diffusion-weighted imaging lesion) versus perfusion status (severity of hypoperfusion) on hemorrhagic transformation. Stroke. 2010;41:e135–142. doi: 10.1161/STROKEAHA.109.563122. [DOI] [PubMed] [Google Scholar]
- 9.Mlynash M, Lansberg MG, De Silva DA, et al. Refining the definition of the malignant profile: insights from the DEFUSE-EPITHET pooled data set. Stroke. 2011;42:1270–1275. doi: 10.1161/STROKEAHA.110.601609. [DOI] [PMC free article] [PubMed] [Google Scholar]
- 10.Fisher M, Adams RD. Observations on brain embolism with special reference to the mechanism of hemorrhagic infarction. J Neuropathol Exp Neurol. 1951;10:92–94. [PubMed] [Google Scholar]
- 11.Rha JH, Saver JL. The impact of recanalization on ischemic stroke outcome: a meta-analysis. Stroke. 2007;38:967–973. doi: 10.1161/01.STR.0000258112.14918.24. [DOI] [PubMed] [Google Scholar]
- 12.Molina CA, Alvarez-Sabin J, Montaner J, et al. Thrombolysis-related hemorrhagic infarction: a marker of early reperfusion, reduced infarct size, and improved outcome in patients with proximal middle cerebral artery occlusion. Stroke. 2002;33:1551–1556. doi: 10.1161/01.str.0000016323.13456.e5. [DOI] [PubMed] [Google Scholar]
- 13.Fiehler J, Remmele C, Kucinski T, et al. Reperfusion after severe local perfusion deficit precedes hemorrhagic transformation: an MRI study in acute stroke patients. Cerebrovasc Dis. 2005;19:117–124. doi: 10.1159/000083180. [DOI] [PubMed] [Google Scholar]
- 14.Paciaroni M, Agnelli G, Corea F, et al. Early hemorrhagic transformation of brain infarction: rate, predictive factors, and influence on clinical outcome: results of a prospective multicenter study. Stroke. 2008;39:2249–2256. doi: 10.1161/STROKEAHA.107.510321. [DOI] [PubMed] [Google Scholar]
- 15.Larrue V, von Kummer RR, Muller A, Bluhmki E. Risk factors for severe hemorrhagic transformation in ischemic stroke patients treated with recombinant tissue plasminogen activator: a secondary analysis of the European-Australasian Acute Stroke Study (ECASS II) Stroke. 2001;32:438–441. doi: 10.1161/01.str.32.2.438. [DOI] [PubMed] [Google Scholar]
- 16.Thomalla G, Sobesky J, Kohrmann M, et al. Two tales: hemorrhagic transformation but not parenchymal hemorrhage after thrombolysis is related to severity and duration of ischemia: MRI study of acute stroke patients treated with intravenous tissue plasminogen activator within 6 hours. Stroke. 2007;38:313–318. doi: 10.1161/01.STR.0000254565.51807.22. [DOI] [PubMed] [Google Scholar]
- 17.Saqqur M, Tsivgoulis G, Molina CA, et al. Symptomatic intracerebral hemorrhage and recanalization after IV rt-PA: a multicenter study. Neurology. 2008;71:1304–1312. doi: 10.1212/01.wnl.0000313936.15842.0d. [DOI] [PubMed] [Google Scholar]
- 18.Dinia L, Rubiera M, Ribo M, et al. Reperfusion after stroke sonothrombolysis with microbubbles may predict intracranial bleeding. Neurology. 2009;73:775–780. doi: 10.1212/WNL.0b013e3181b6bb45. [DOI] [PubMed] [Google Scholar]
- 19.Molina CA, Montaner J, Abilleira S, et al. Timing of spontaneous recanalization and risk of hemorrhagic transformation in acute cardioembolic stroke. Stroke. 2001;32:1079–1084. doi: 10.1161/01.str.32.5.1079. [DOI] [PubMed] [Google Scholar]
- 20.Alsop DC, Makovetskaya E, Kumar S, et al. Markedly reduced apparent blood volume on bolus contrast magnetic resonance imaging as a predictor of hemorrhage after thrombolytic therapy for acute ischemic stroke. Stroke. 2005;36:746–750. doi: 10.1161/01.STR.0000158913.91058.93. [DOI] [PubMed] [Google Scholar]
- 21.Davis SM, Donnan GA, Parsons MW, et al. Effects of alteplase beyond 3 h after stroke in the Echoplanar Imaging Thrombolytic Evaluation Trial (EPITHET): a placebo-controlled randomised trial. Lancet Neurol. 2008;7:299–309. doi: 10.1016/S1474-4422(08)70044-9. [DOI] [PubMed] [Google Scholar]
- 22.Straka M, Albers GW, Bammer R. Real-time diffusion-perfusion mismatch analysis in acute stroke. J Magn Reson Imaging. 2010;32:1024–1037. doi: 10.1002/jmri.22338. [DOI] [PMC free article] [PubMed] [Google Scholar]
- 23.Lansberg MG, Lee J, Christensen S, et al. RAPID Automated Patient Selection for Reperfusion Therapy: A Pooled Analysis of the Echoplanar Imaging Thrombolytic Evaluation Trial (EPITHET) and the Diffusion and Perfusion Imaging Evaluation for Understanding Stroke Evolution (DEFUSE) Study. Stroke. 2011;42:1608–1614. doi: 10.1161/STROKEAHA.110.609008. [DOI] [PMC free article] [PubMed] [Google Scholar]
- 24.Hacke W, Kaste M, Fieschi C, et al. Randomised double-blind placebo-controlled trial of thrombolytic therapy with intravenous alteplase in acute ischaemic stroke (ECASS II). Second European-Australasian Acute Stroke Study Investigators. Lancet. 1998;352:1245–1251. doi: 10.1016/s0140-6736(98)08020-9. [DOI] [PubMed] [Google Scholar]
- 25.Wahlgren N, Ahmed N, Davalos A, et al. Thrombolysis with alteplase for acute ischaemic stroke in the Safe Implementation of Thrombolysis in Stroke-Monitoring Study (SITS-MOST): an observational study. Lancet. 2007;369:275–282. doi: 10.1016/S0140-6736(07)60149-4. [DOI] [PubMed] [Google Scholar]
- 26.Raftery AE. Bayesian Model Selection in Social Research. In: Marsden PV, editor. Sociological Methodology. Vol. 26. Oxford: Blackwell; 1996. pp. 111–163. [Google Scholar]
- 27.Lees KR, Bluhmki E, von Kummer R, et al. Time to treatment with intravenous alteplase and outcome in stroke: an updated pooled analysis of ECASS, ATLANTIS, NINDS, and EPITHET trials. Lancet. 2010;375:1695–1703. doi: 10.1016/S0140-6736(10)60491-6. [DOI] [PubMed] [Google Scholar]
- 28.Bhatia R, Hill MD, Shobha N, et al. Low Rates of Acute Recanalization With Intravenous Recombinant Tissue Plasminogen Activator in Ischemic Stroke. Real-World Experience and a Call for Action. Stroke. 2010;41:2254–2258. doi: 10.1161/STROKEAHA.110.592535. [DOI] [PubMed] [Google Scholar]
- 29.Saqqur M, Uchino K, Demchuk AM, et al. Site of arterial occlusion identified by transcranial Doppler predicts the response to intravenous thrombolysis for stroke. Stroke. 2007;38:948–954. doi: 10.1161/01.STR.0000257304.21967.ba. [DOI] [PubMed] [Google Scholar]
- 30.Alexandrov AV, Grotta JC. Arterial reocclusion in stroke patients treated with intravenous tissue plasminogen activator. Neurology. 2002;59:862–867. doi: 10.1212/wnl.59.6.862. [DOI] [PubMed] [Google Scholar]
- 31.Hacke W, Kaste M, Bluhmki E, et al. Thrombolysis with alteplase 3 to 4.5 hours after acute ischemic stroke. N Engl J Med. 2008;359:1317–1329. doi: 10.1056/NEJMoa0804656. [DOI] [PubMed] [Google Scholar]
- 32.Hacke W, Kaste M, Fieschi C, et al. Intravenous thrombolysis with recombinant tissue plasminogen activator for acute hemispheric stroke. The European Cooperative Acute Stroke Study (ECASS) JAMA. 1995;274:1017–1025. [PubMed] [Google Scholar]
- 33.Parsons M, Spratt N, Bivard A, et al. A randomized trial of tenecteplase versus alteplase for acute ischemic stroke. N Engl J Med. 2012;366:1099–1107. doi: 10.1056/NEJMoa1109842. [DOI] [PubMed] [Google Scholar]
- 34.Yoo AJ, Verduzco LA, Schaefer PW, et al. MRI-based selection for intra-arterial stroke therapy: value of pretreatment diffusion-weighted imaging lesion volume in selecting patients with acute stroke who will benefit from early recanalization. Stroke. 2009;40:2046–2054. doi: 10.1161/STROKEAHA.108.541656. [DOI] [PMC free article] [PubMed] [Google Scholar]
- 35.Costalat V, Machi P, Lobotesis K, et al. Rescue, Combined, and Stand-Alone Thrombectomy in the Management of Large Vessel Occlusion Stroke Using the Solitaire Device: A Prospective 50-Patient Single-Center Study: Timing, Safety, and Efficacy. Stroke. 2011 doi: 10.1161/STROKEAHA.110.608976. [DOI] [PubMed] [Google Scholar]