

Abstract
Background & Aims
Hepatitis C virus (HCV) infection is a leading cause of end-stage liver disease. Interferon (IFN)-α is an important component of anti-HCV therapy; it upregulates transcription of IFN-stimulated genes (ISGs)—many of which have been investigated for their anti-viral effects. However, all the genes required for the anti-viral function of IFN-α (IFN effector genes, IEGs) are not known. IEGs include not only ISGs, but other non-transcriptionally induced genes that are required for the anti-viral effect of IFN-α. In contrast to candidate approaches based on analyses mRNA expression, identification of IEGs requires a broad functional approach.
Methods
We performed an unbiased genome-wide small-interfering (si)RNA screen to identify IEGs that inhibit HCV. Huh7.5.1 hepatoma cells were transfected with siRNAs, incubated with IFN-α, and then infected with JFH1 HCV. Cells were stained using HCV core antibody, imaged, and analyzed to determine the percent infection. Candidate IEGs detected in the screen were validated and analyzed further.
Results
The screen identified 120 previously unreported IEGs. From these, we more fully evaluated 9 (ALG10, BCHE, DPP4, GCKR, GUCY1B3, MYST1, PPP3CB, PDIP1, SLC27A2) and demonstrated that they enabled IFN-α–mediated suppression of HCV at multiple steps of its lifecycle. Expression of these genes had more potent effects against flaviviridae, because a subset were required for IFN-α to suppress dengue virus but not influenza A virus. Furthermore, many of the host genes detected in this screen (92%) were not transcriptionally stimulated by IFN-α; these genes represent a heretofore unknown class of non-ISG IEGs.
Conclusion
We performed a whole-genome loss-of-function screen to identify genes that mediate the effects of IFN-α against human pathogenic viruses. We found that IFN-α restricts HCV via actions of general and specific IEGs.
Keywords: treatment, gene regulation, virology, mechanism
Introduction
Therapies directed against viral targets have enabled either cure or control of many viral illnesses, including HCV1, 2. However, a major concern remains the selection of resistance to these pathogen-directed therapies3. One of the most potent innate antiviral agents that has activity against resistant HCV variants is IFN-α4. However, IFN-α induces hundreds of genes that contribute to prevalent side effects. Alternative therapeutics such as those directed toward specific genes that enhance the endogenous IFN-α response may be useful. Previous work to identify IEGs has primarily focused on IFN stimulated genes (ISGs), a group of genes that is transcriptionally activated by IFN-α5–8. However, it is foreseeable that ISGs are regulated and/or work in conjunction with genes whose expression is constitutive or IFN-α-insensitive. We postulated that an unbiased loss-of-function strategy would expand the compendium of IEGs by identifying both IFN-stimulated and IFN-inert genes. Therefore we completed a whole genome siRNA screen to find host genes required for IFN-α’s inhibition of HCV infection (HCV-IEGs) using a fully infectious HCV system.
Materials and Methods
Screen Assay is described in detail in Supplemental Methods.
Lifecycle Assays are described in detail in Supplemental Methods. Entry, replication, RNA production, and egress were assessed using pseudoparticles, the OR6(GT1b) replicon, JFH1 qRT-PCR and supernatant transfer assays, respectively.
Stable shRNA knockdown cells are described in Supplemental Methods.
Overexpression is described in Supplemental Methods.
Statistical analyses
All data are expressed as mean ± standard error of mean for at least three independent experiments. Student’s t test was used to compare experimental conditions and controls; P value <0.05 was considered significant and is indicated by star(*).
Results
A genetic screen identifies 120 candidate HCV-IEGs
To identify HCV-IEGs, we designed an image-based screen in which knockdown of a candidate IEG would rescue viral replication from IFN-α-mediated suppression (Fig. 1a, b). IFN-α was titrated to suppress HCV replication to levels below 5% of those seen with untreated infection. siRNA-transfected Huh7.5.1 human hepatoma cells were infected with fully infectious HCV JFH1 genotype 2a virus for 48h,a timeframe that encompasses the HCV viral lifecycle through infectious virion egress and an additional round of infection (Fig. S1a–e). Cells were fixed and stained for HCV core protein expression and cellular DNA (nuclei). Images were collected for two emission wavelengths, FITC for HCV core and DAPI for host cell nuclei. A customized image analysis program based on cell shape was then used to compute the percentage of HCV-infected cells per well through detection of nuclei surrounded by positive signal in the FITC channel. Optical filters were also used to identify and remove artifacts that would otherwise be scored as infected cells (Fig. S2). This analysis enhanced the screen’s accuracy because it eliminated imaging artifacts observed in the FITC channel, permitting accurate detection of infected cells.
Figure 1. A Functional Genomic Screen Identifies 120 HCV-IEGs.
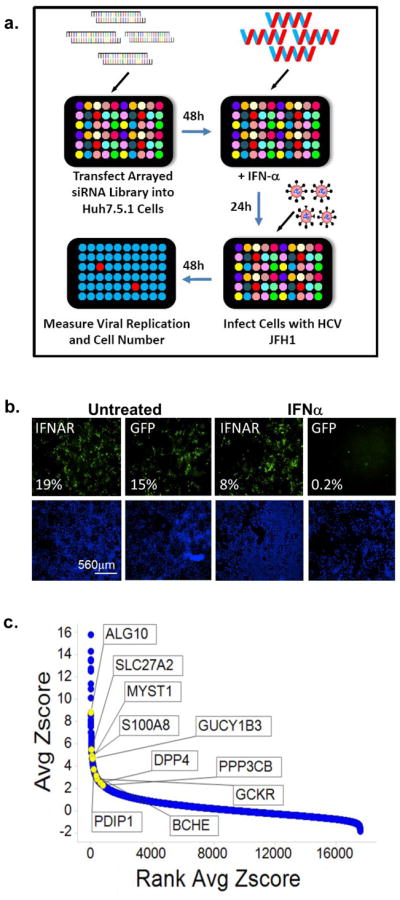
(A) Huh7.5.1 cells were transfected with siRNA followed 48h later by IFN-α treatment (100IU/ml) then 24h later by infection with JFH1 HCV. 48h post infection cells were fixed, permeabilized, and stained with HCV core Ab and Hoechst 33342 DNA stain, then imaged and analyzed for percent HCV infection.
(B) Huh7.5.1 cells were transfected with positive (IFNAR1) and negative (green fluorescent protein (GFP)) control siRNA, treated with IFN-α or buffer alone, then infected with JFH1 HCV. Cells were then stained for HCV core (green) and host cell DNA (blue). Both controls exhibit similar levels of HCV infection in the absence of IFN-α treatment (left). In the presence of IFN-α (right), HCV infection is suppressed in negative control cells, and rescued by IFNAR knockdown.
(C) HCV-IEG rank plot. The average Z score for all genes screened is displayed; genes are ranked according to Z score. Select HCV-IEGs are highlighted.
Knockdown of the IFN-α receptor 1 (IFNAR-1) provided a positive control and rescued HCV infection to levels five-fold or greater than cells transfected with negative control non-targeting siRNA against jellyfish green fluorescence protein (GFP, Fig. 1b). Comparable results were obtained using two additional negative control siRNAs, non-targeting 2 (NT2), and NT3 (data not shown). Using these conditions, a whole-genome siRNA screen was performed in triplicate using siRNA pools composed of four distinct siRNA duplexes for each gene (Dharmacon siGenome, Table S1, Fig. 1c). Two criteria were used to define HCV rescue: (1) a percent infected value of three-times or greater than plate median absolute deviation; and (2) a high quality image on visual inspection. Using this method, 524 siRNA pools were found to rescue HCV from IFN-α. In addition, 325 genes (1.6%) were excluded due to cytotoxicity or poor image quality (Table S2). Notably, genes which we had previously found to be required for HCV replication9, were not detected using this current format because of the suppressive dose of IFN-α (Table S3). For the 524 genes whose knockdown led to rescue from IFN-α, we then tested each of the individual siRNAs for their respective ability to rescue HCV infection. For 120 of 524 siRNAs tested (23%), 2 or more siRNAs reproduced the HCV rescue phenotype, suggesting that they are less likely to be the result of false-positive events (Table S410). Among the remaining 404 pools, 157 had a single siRNA that reproduced the HCV rescue phenotype, yielding a 52.8% overall confirmation rate for the 524 first round candidates. These 157 genes likely represent a mixture of false positive and true positive events. For example, the bona fide IEG, STAT1, scored with only one siRNA. Exploring the relevance of this subset will be informative but was not a focus of this work.
As expected, bioinformatic analysis of the 120 HCV-IEG candidates using Ingenuity analysis software11 revealed significant enrichment for genes involved in the IFN/JAK/STAT/IRF signaling pathways, including IFNAR1 and 2, IFNGR1, IRF7, IRF9, JAK1, STAT2, and TYK2, confirming both the validity and technical strengths of this approach (Table S4, S5)11. A non-exhaustive overview of known connections between these genes, IFN-α, and viruses is provided, and revealed that 7.5% had been identified in past screens for HCV-IEGs5, 6, 12, and 23% had been previously related to IFN-α in the literature (Table S4, S6–7). From these 120 genes we next selected 10 HCV-IEG candidates: ALG10, BCHE, DPP4, GCKR, GUCY1B3, MYST1, PPP3CB, PDIP1, S100A8 and SLC27A2, based on four criteria: 1) potential biological interest, 2) level of HCV rescue, 3) the number of individual siRNAs out of four tested that provided HCV rescue and 4) hepatic expression reported in NIH databases (Fig. 2a, b). For these 10 HCV-IEGs, individual siRNAs were retested for confirmation of the HCV rescue phenotype observed during high-throughput screening. All candidate HCV-IEGs except S100A8 confirmed rescue of HCV infection with two or more unique siRNAs (Fig 2a). Interestingly, in the absence of IFN-α, knockdown of these HCV-IEGs did not increase viral replication (Fig. S3a). When IFN-α was given after JFH1, instead of before, the majority of HCV-IEG knockdowns maintained rescue of HCV from IFN-α, albeit with a less robust phenotype (Fig. S3b). Subsequent studies focused on the nine confirmed HCV-IEGs
Figure 2. HCV-IEG Validations: Comparison of Knockdown to Phenotype.

(A) Rescue phenotype analyses were repeated to confirm rescue of HCV infection from IFN-α (100IU/ml) by IEG knockdown. Y axis values represent mean fold rescue of HCV above levels in cells transfected with non-targeting siRNA, X axis values indicate target gene and individual siRNA duplex. Values represent mean +/− SEM; n≥3 throughout; * p < 0.05. Results were analyzed by paired t tests.
(B) Huh7.5.1 cells were transfected with indicated siRNA, treated with IFN-α 100 IU/ml, then infected with JFH1 HCV, followed by staining for HCV core (green) and host cell DNA (blue). Sample images for top siRNAs scoring for HCV rescue from IFN-α (100IU/ml) are presented alongside positive (IFNAR) and negative (GFP, NT2) controls. siRNA and percent infection are indicated.
(C) mRNA knockdown efficiency for each of 4 individual siRNAs per gene is calculated by comparison to target gene expression levels in cells transfected with non-targeting siRNA; values were normalized using GAPDH. siRNA was transfected into Huh7.5.1 cells, followed 48h later by IFN-α (100IU/ml) treatment for 24h, then qRT-PCR for target gene expression. Y axes indicate relative mRNA expression; X axes indicate transfected siRNA. Values represent the mean +/− SEM; n≥3 throughout.
(D) Huh7.5.1 cells were transfected with target gene siRNA for 48h then treated with IFN-α (100IU/ml) for 24h followed by protein extraction for western blot.
A useful strategy to validate siRNA screening candidates is to determine whether the level of siRNA-mediated depletion of mRNA or protein is proportional to the phenotype observed. Therefore, we compared the HCV rescue phenotype against the level of knockdown of either mRNA, for all nine IEGs, or protein, for eight genes (Fig. 2c, d). To evaluate mRNA depletion we used quantitative PCR (qRT-PCR) with primer sets that did not display any concentration dependent behavior on efficiency curve testing (Table S8). For these candidate HCV-IEGs, siRNA transfection led to mRNA decreases to below 40% of baseline for all duplexes for each gene (Fig. 2c). Importantly the relative level of knockdown of either mRNA or protein was proportional to the extent of HCV rescue, strongly suggesting the observed phenotypes were the result of siRNA-directed depletion of the intended gene (Table S9). An example of this correlation is illustrated by PDIP1 siRNA3, which displays the weakest rescue phenotype and also the lowest mRNA and protein knockdown among PDIP1 siRNAs (Fig. 2a, c, d, Table S9). In summary, siRNAs targeting each of nine HCV-IEGs reproducibly knocked down target gene products and rescued HCV from IFN-α, without affecting HCV levels under IFN-α-free conditions.
PDIP1 enables IFN-α’s inhibition of HCV replication
Of the nine select HCV-IEGs, we next chose PDIP1 for further validation based on its strong rescue phenotype (8 fold mean rescue for 4/4 siRNA duplexes, (Fig. 2a)), its described interactions with the interferon activated protein, ISG15, and its association with a B-cell autoimmune disease locus13, 14. To further investigate PDIP1, we stably transduced Huh7.5.1 cells with one of four short hairpin RNA (shRNA) lentiviruses, or empty vector control (APM) (Fig. 3a, b). Each of the PDIP1 shRNAs and siRNAs used in this experiment and the ones above targets a distinct region of PDIP1 resulting in an extended level of reagent redundancy10. Knockdown of PDIP1’s mRNA and protein was confirmed by qRT-PCR and western blot, respectively, for all four shRNA-transduced cell lines (Fig. 3c, d). Moreover, IFN-α’s antiviral effects were diminished in all four PDIP1 shRNA cell lines (Fig. 3b, e, f). Interestingly, the IFN-α rescue phenotype became more pronounced with increasing concentrations of IFN-α up to 1600IU/ml, suggesting that PDIP1 is critical for a maximal IFN-α anti-HCV response (Fig. 3b, e). Exogenous expression of the ISG PDIP1 was not in and of itself antiviral, nor was expression of the non-ISG IEG, BCHE (Fig. S4,a–d).
Figure 3. PDIP1 Depletion Rescues HCV from IFN-α.

(A) Schematic of PDIP1 and target sites of PDIP1 shRNAs. shRNAs 89, 91 and 88 target coding sequence, while 85 targets 3′UTR. Nucleotide (nt) binding sites of each shRNA to PDIP1 (NCBI NM 001037335.2) are indicated.
(B) Stable PDIP1 knockdown cell lines were made by transducing Huh7.5.1 cells with lentiviral particles carrying indicated shRNAs. APM control vector contains shRNA against luciferase. Cells were treated with indicated concentration of IFN-α for 24h, followed by infection with JFH1. 48h post-infection, cells were fixed, stained for HCV core and DNA, then analyzed as above. Cells were scored for percent HCV infection using HCV core Ab (green) and DNA stain (blue). Cell line, percent infection are indicated. Top and bottom cells were treated with 1600 and 100 IU/ml IFN-α, respectively.
(C) Stable cell lines were assessed for PDIP1 mRNA knockdown through qRT-PCR and normalized to control APM cell line.
(D) Western blot for cells in (C), kDa = kilodalton.
(E) Correlate data for images in (B). Phenotypic analysis of PDIP1 knockdown cells (88, 89, 91 and 85) compared to vector cells (APM).
(F) PDIP1 knockdown cells were treated with IFN-α 1600 IU/ml for 24h, followed by JFH1 infection for 48h, then intracellular RNA isolation for JFH1 qRT-PCR. Values for (C), (E) and (F) represent mean ±SEM for 3 independent experiments.
HCV-IEGs restrict multiple steps of the HCV viral lifecycle
We next evaluated where in the viral lifecycle these nine HCV-IEGS assisted IFN-α in halting HCV infection. siRNA transfections were paired with assays investigating the following steps of the viral lifecycle: entry, genome replication, core protein production, RNA production and infectious virion production and release. To simplify interpretation of these results (fold-rescue values for 4 siRNA duplexes per gene for nine genes), a scoring system was established (Table S10, Supplemental Methods). Lifecycle rescue scores greater than or equal to four were scored positive, because this represents an average of 2-fold or greater rescue for 2 or more siRNA, the criteria used during the validation round screening.
Entry was assessed by infecting cells with lentiviral pseudoparticles (pp) displaying the JFH1-strain’s HCV envelope glycoproteins (E1 and E2) and containing a zoanthus species green fluorescence reporter gene (ZSG15). HCVpp susceptibility to IFN-α was confirmed (Fig. S5). IFNAR1 knockdown rescued HCVpp entry from IFN-α (Fig. 4a, b). This rescue was modest (~two to three fold) compared to rescue of fully infectious HCV JFH1 (≥10 fold) (Fig. 2a). Nonetheless, entry scores above four were detected for 4 of the HCV-IEGs: DPP4, MYST1, PPP3CB, and SLC27A2, with the highest overall rescue scores observed for DPP4(7) and SLC27A2(6.8) (Fig. 4b, Table S10). These four genes enabling IFN-mediated suppression of HCV entry will be referred to as an entry effector group.
Figure 4. HCV-IEGs are Required for IFN-α-mediated Suppression of Viral Entry and Viral RNA Replication.

For each candidate HCV-IEG, 4 distinct siRNAs were tested. For Huh7.5.1 cell studies, cells were transfected with indicated siRNAs then treated with IFN-α followed 24h later by indicated intervention. Y axes indicates mean fold rescue above control. X axes indicates siRNA.
(A) Cells were infected with pseudoparticles (pp) for 48h. Top row images show GFP positive HCVpp, with corresponding cell nuclei (DNA stained) below.
(B) HCV-IEG knockdown was assessed for rescue of HCV entry from IFN-α suppression.
(C) HCV-IEG knockdown was assessed for rescue of HCV replication from IFN-α in OR6 replicon cells. Replicon cells were transfected with indicated siRNAs, then 48h later cells were treated with 6IU/ml of IFN-α for 24h followed by evaluation of Renilla Luciferase or ATP (cell titer glo) levels. OR6 Renilla Luciferase levels for each transfection were normalized to ATP levels. Normalized OR6 signals for each IEG knockdown were compared to corresponding control to calculate fold rescue.
(D) HCV-IEG knockdown rescues HCV RNA production from IFN-α. Cells were infected with JFH1 for 48h, followed by isolation of intracellular RNA and performance of qRT-PCR to quantify JFH1 RNA. All values were normalized to GAPDH.
For all lifecycle assays, values represent mean +/− SEM; n≥3 throughout; * p < 0.05. Results were analyzed by paired t tests.
Next, the effect of IEG knockdown on HCV genome replication was assessed using the HCV full genome OR6 replicon (Fig. 4c, Table S10). These experiments revealed that ALG10, DPP4, PPP3CB and PDIP1 knockdowns rescued the replicon from IFN-α. We assessed the intracellular production of HCV core protein using the immunostaining assay from the high throughput screen (Fig. 2a, Table S10). All nine IEGs increased viral core levels, with rescue scores ranging from 8.4, for GCKR, to 36.1, for PDIP1. Production of intracellular HCV RNA was assessed using qRT-PCR, and leading to identification of an RNA production effector group. Knockdown of ALG10B, MYST1, PDIP1 and SLC27A2 rescued HCV RNA production from IFN-α suppression, with rescue scores ranging from 6 (SLC27A2) to 18 (PDIP1) (Fig. 4d, Table S10).
To determine the role of IEGs during IFN-α-mediated suppression of HCV infectious virion production and release, we performed viral supernatant transfer experiments9 (Fig. 5a). This assay enabled quantification of the amount of infectious virus assembled and released in the presence of IFN-α. Supernatant from positive control (IFNAR-depleted cells) was significantly more infectious than supernatant from cells transfected with non-targeting siRNA (Fig. 5b). Viral supernatant collected from cells depleted of ALG10, MYST1, or PDIP1 was also more infectious after transfer, with rescue scores of 10.0, 5.1, and 4.7 respectively (Fig. 5b, Table S10). Therefore, a discrete egress effector group, ALG10/MYST1/PDIP1, enables IFN-α to decrease the levels of active HCV particles secreted by infected cells, with the most substantial effect exerted by ALG10 (Fig. 5a,b, Table S10). A synopsis and schematic of the siRNA duplexes that scored significantly for each IEG, in each lifecycle assay, is included (Fig. 5c, Fig. S6). In summary, viral lifecycle assays reveal that discrete sets of HCV-IEGs enable IFN-α to suppress HCV during each phase of the HCV lifecycle. Most IEGs appear to work at more than one stage, suggesting they regulate multiple downstream effectors.
Figure 5. IFN-α’s Block of Infectious Virion Production Requires HCV-IEGs.

(A) HCV-IEG knockdown was assessed for rescue of HCV infectious virion production from IFN-α. Cells were infected with JFH1 HCV, then after 48h viral supernatant was transferred in a well-by-well manner to destination plates. Destination plates were incubated for 48h, then scored for percent infection as in original screen. Top row shows source plate and the bottom row shows destination plate.
(B) HCV-IEG knockdown was assessed for rescue of HCV infectious virion production from IFN-α suppression. Y axis indicates mean fold rescue above control. X axis indicates siRNA.
(C) Summary of lifecycle assay results per siRNA duplex are presented. Each colored bar indicates that a given siRNA scored positive (p<0.05 compared to control) for indicated lifecycle assay (X axis). Red, yellow, green, blue represent siRNA duplexes 1,2,3,4 respectively. Target genes and lifecycle stage are indicated.
The Majority of HCV-IEGs are not ISGs
To define the relationship between IFN-α and these selected HCV-IEGs, we tested the effect of IFN-α on IEG transcription. Interestingly, IFN-α at the concentration used during the screen (100 IU/ml) did not enhance mRNA levels at either 4 or 24 hours for any of the select HCV-IEGs except PDIP1, the latter as previously noted (Fig. 6a, Tables S4, S6)16–18. Similar results were obtained using stimulation with IFN-λ, which induces ISGs in a pattern comparable to but not identical to type I IFNs (Fig. 6b). Consistent with published results, IFNAR1, a classical IEG, was not transcriptionally upregulated by IFN-α whereas levels of known hepatic ISGs, MX1 and OAS, were elevated after IFN-α treatment (Fig 6a, Table S616–19). We also reviewed available microarray datasets describing transcriptional changes upon IFN-α stimulation of primary hepatocytes and also other cell types (Tables S4, S6). Among the 120 total HCV-IEGs, ANKFY1, CCRL1, IQGAP2, IRF7, ITGB1, JAK1, PDIP1, RAB4B, STAT2, and SULT1E1 have been reported to be transcriptionally upregulated in primary hepatocytes in response to IFN-α16–18. Thus only 10 of 120 HCV-IEGs (8%) have been described as hepatocyte ISGs, and 48% of the candidates have no prior link to IFN-α signaling or anti-viral activity (Table S4).
Figure 6. The Majority of HCV-IEGs are not ISGs.
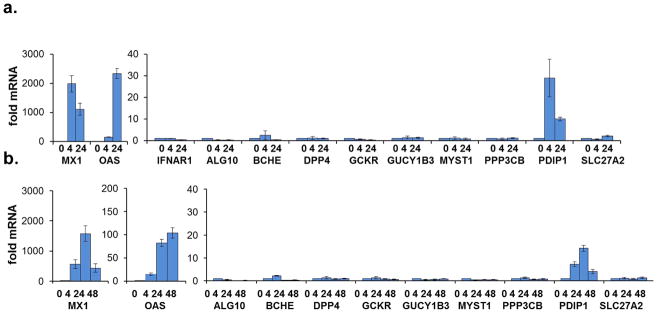
Top candidate HCV-IEGs were evaluated for increase in mRNA level upon IFN-α stimulation.
(A) Huh7.5.1 cells were stimulated with IFN-α (100 IU/ml) for 4h or 24h, as indicated on X axis, followed by RNA isolation and qRT-PCR for target gene quantitation. Y axes indicate relative mRNA expression normalized using GAPDH.
(B) Experiment was performed as in (A), but IFN-λ (542 IU/ml) replaced IFNα. Values for (A) and (B) represent mean ±SEM for 3 separate experiments.
HCV-IEGs are needed for the IFN-α-mediated suppression of DENV but not IAV
IFN-α restricts multiple viruses but the specific actions of each IEG are still under investigation. To examine the specificity of the select HCV-IEGs, we tested how their depletion impacted IFN-α’s effect on two other viruses, dengue virus (DENV), a flaviviridae family member, and the orthomyxovirus, influenza A virus (IAV) (Fig. 7). For these experiments we used a similar image-based readout for viral replication (hemagluttinin (HA) for IAV, or envelope protein (E1E2) for DENV) after knockdown of the respective HCV-IEGs. These experiments demonstrated both general and specific IEG actions. Rescue scores for MYST1 and ALG10 ranked among the top 4 IEGs for all three viruses, and PDIP1 ranked among the top 3 IEGs for DENV and HCV, suggesting these genes more broadly contribute to the IFN response. Among the nine IEGs tested, only the protein phosphatase PPP3CB rescued IAV from IFN-α, while it ranked sixth in being needed for IFN-α’s inhibition of HCV (Fig. 7a, b, Table S11). In contrast, all nine HCV-IEGs tested rescued DENV from IFN-α, with comparable effects to those observed for HCV (Fig. 7c,d, Table S11). We conclude that the majority of select HCV-IEGs enable IFN-α mediated suppression of DENV with a more limited number having a role in counteracting IAV.
Figure 7. HCV-IEGs are Needed for IFN-α’s Restriction of DENV but Not IAV.

(A) HeLa MAGI cells were transfected with indicated siRNA, followed by IFN-α treatment then influenza A virus (IAV) infection followed by staining for anti-HA 29 (green) and DNA (blue), imaging, and scoring for percent infection. siRNA and percent infection are indicated.
(B) Corresponding data for (A). X axis indicates mean fold rescue above non-targeting siRNA and Y axis indicates siRNA transfected, where 4 distinct siRNAs were used for each IEG.
(C) HeLa MAGI cells were transfected with indicated siRNA, followed by IFN-α treatment then dengue virus (DENV) infection followed by staining for DENV core (green) and DNA (blue), imaging, and scoring for percent infection. siRNA and percent infection are indicated.
(D) Corresponding data for (C). X axis indicates mean fold rescue above non-targeting siRNA and Y axis indicates siRNA transfected, where 4 distinct siRNAs were used for each IEG.
Values for (B) and (D) represent mean ± SEM for 3 separate experiments.
Discussion
Identifying the host factors that mediate IFN-α’s antiviral actions has been a longstanding focus of the virology research community5–8, 12, 16–20. The rationale underlying these investigations is that an in-depth knowledge of this defense mechanism will help identify therapeutic targets that will aid in the treatment and cure of viral infections. Towards this goal, we have undertaken a large scale genetic screen to find host factors that contribute to the anti-HCV effects of IFN-α. Of note, this work represents the first whole-genome loss-of-function screen to identify genes important for IFN’s antagonism of a human pathogen. The screen successfully identified a large set of IEGs required for HCV containment. Collectively the results presented in this work both improve our understanding of the IFN response and reveal potential anti-viral target pathways.
Overlap of this effort with other recent investigations of IEGs was modest, perhaps reflecting a difference in screening strategies (unbiased vs. selected ISG candidates, overexpression vs. loss-of-function), as well as the general experiences emerging from large scale genomic functional characterizations; specifically that there exists a high degree of false positives and false negatives using any of these powerful, albeit limited, technologies. Due to the suppressive IFN dose used in our screen, IEGs that either block HCV entry or block viral protein translation will be more likely to be detected, compared to late acting IEGs21, because their loss will allow the greatest levels of rescue to occur. Furthermore, use of core-protein immunostaining as a readout also increased the likelihood of our detecting the loss of IEGs that modulate translation. Alternative screening strategies designed to detect changes in infectious virion production, or inhibition of an established viral infection, may prove valuable in future efforts. Moreover while the Huh7.5.1 cell line can uniquely support HCV replication in vitro, it fulfills this role because it is deficient in the RIG-I/MDA5 pathway22. Use of RIG-I deficient cells decreased our likelihood of identifying genes involved in IFN-α production, but allowed us to preferentially identify downstream host genes required for antiviral efficacy of IFN-α. Ultimately, understanding both the IFN-α production and IFN-α effector pathways is essential for complete description of host antiviral response. To address the concern that RIG-I disruption may impede the IFN pathway more globally, we performed a validation round which stratified 120 candidate HCV-IEGs based on the number of individual siRNAs that reconfirmed the phenotype seen in the primary screen. Of these 120 candidate genes, using bioinformatics we detected an enrichment for proteins known to play a role in IFN-α response, confirming validity of this screening strategy (p=1.88E-09). In addition, using a literature search, among the 120 IEGs, nearly one quarter had some previously described association with the IFN-α response. The screen also enriched for known IFN-α signaling components and recovered our positive control, the IFN-α receptor, IFNAR1; this enrichment is in keeping with a lack of redundancy in the IFN-α signaling pathway found by elegant somatic cell genetic studies23.
From the set of 120 HCV-IEG candidates, we chose a subset of what we deemed to be high interest proteins, the select HCV-IEGs, for further evaluation. Validation experiments revealed that individual siRNA-mediated knockdown of target mRNAs and proteins (reagents permitting) was consistent with the observed phenotype for this subset, thereby increasing the likelihood that these candidates represent true positives. We next evaluated the role of each of the select HCV-IEGs using viral lifecycle assays. These experiments identified distinct effector classes of IEGs that contributed to IFN’s antagonism of each step of the HCV lifecycle5, 24.
These viral lifecycle studies also showed that the screen identified several HCV-IEGs (ALG10, MYST1, PDIP1) that were required for IFN-α’s antiviral effect across 4–5 of the lifecycle steps tested. Consistent with their broad effects, the depletion of ALG10, PDIP1 and MYST1 produced the greatest degree of HCV rescue from IFN-α. We postulate that modulation of host gene expression by MYST1 and PDIP1 may underlie their respective roles in the IFN response. MYST1 is a histone acetyltransferase and therefore contributes to the regulation of multiple genes25. Of note, MYST1 has been described to activate ataxia-telangiectasia-mutated protein (ATM), a protein whose inactivation is associated with severely impaired IFN production26.
Similar to MYST1, PDIP1 (PPARγ DBD-interacting protein 1) plays a role in modulating gene expression via its interactions with the nuclear receptors PPAR-α/γ27, 28. PPARs are expressed widely including in hepatocytes and regulate both immune responses and IFNγ production 29. Interestingly, an informatics analysis also found components of the PPARα/RXRα activation pathway (HSP90AA1, HSP90AB1, MAP2K4, PDIP1, TGFBR1, SMAD3) to be enriched in the HCV-IEGs detected in this screen (p= 9.11E-04). Detection of both TGFBR1 and SMAD3 as HCV-IEGs supports recent findings of positive crosstalk between the IFN-α and TGF-β signaling pathways30. Moreover, PDIP1 has been recognized as an ISG in multiple cell types, interacts with the interferon stimulated protein, ISG15, and has recently been implicated in autoimmune disease, but its role in viral infection is unclear5, 13, 14, 17. Our finding that exogenous expression of PDIP1 alone was not antiviral is consistent with its regulating and/or being a part of a larger complex that modulates infection.
The majority of the select HCV-IEGs were found to play a role in IFN-α’s suppression of a related flavivirus, DENV, with a much smaller set involved in the modulating the replication of IAV, an orthomyxovirus. Although it is not unexpected that a similar set of IEGs is involved in the restriction of the two more closely related viruses (HCV and DENV), it nonetheless suggests that specialized networks exist within the much broader anti-pathogenic response elicited by IFN-α. Determining if such pathogen-centric IEG clusters are coordinately controlled could be useful in defining therapeutic targets. With this in mind, we find this screen’s identification of two gene expression regulators, i.e. MYST1 and PDIP1, to be of particular interest.
To determine the relationship between IFN-α and the HCV-IEGs functionally identified in the screen, we assessed whether their mRNAs were increased in response to IFN-α. Interestingly, a large number of the 120 total HCV-IEGs (92%) detected by the screen were not transcriptionally induced by IFN-α,based on available microarray databases16– 19. Thus, our use of a large unbiased genetic strategy shows that previously identified ISGs include only a subset of the full compendium of genes required for an IFN-α response. Earlier successful work to functionally explore the mechanism of IFN-α’s antiviral effects have focused on ISGs, enabling the stratification of strong versus weak antiviral ISGs5, 6, 8, 21. In contrast, our unbiased loss-of-function approach found that many IEGs are not transcriptionally up-regulated by IFN-α, yet nonetheless are needed for IFN-α’s full antiviral effects. While it is wholly expected that ISGs would work in concert with IFN-α-insensitive host cell factors, we deem it of significant value to know their identities because it increases our understanding of how IFN-α exerts its antiviral effects and may also identify new targets for therapy i.e. the PPAR pathway. Indeed, by revealing a large set of transcriptionally silent HCV-IEGs, this work positions the ISG network within the context of a greater IFN-α effector network thereby revealing avenues for future investigation. In addition, these HCV-IEGs represent a distinct class of targets for the design of focused host-directed antiviral therapies for HCV.
Supplementary Material
Acknowledgments
Grant Support
This work was supported by NIH U19 AI082630 (R.T.C., A.L.B., and D.N.F.). D.N.F. is grateful for support from a Clinical and Translational Research Award from the American Association for the Study of Liver Disease. SC is grateful for support from ANRS (French National Agency for Research on AIDS and Viral Hepatitis) and Gilead. A.L.B. is grateful to the Charles H. Hood Foundation, the Bill and Melinda Gates Foundation, the Phillip T. and Susan M. Ragon Foundation, the University of Massachusetts Medical School Center for AIDS Research, and the N.I.H. (1R01AI091786) for their generous support.
We thank the ICCB-L: C. Shamu, J. Smith, S. Chiang, S. Rudnicki, S. Johnston, K. Rudnicki, J. Nale, D. Wrobel, and D. Flood for invaluable help during the siRNA screening and data evaluation. We would like to thank S. Elledge, X. Tan, B. Molinie, and T. Pertel for advice and assistance and N. Kato, S. Elledge, F.L. Cosset, J. Luban, T. Satoh, and R. Chilukuri for providing reagents.
Abbreviations
- HCV
hepatitis C virus
- IFN-α
interferon alpha
- IEG
interferon effector gene
- ISG
interferon stimulated gene
- ALG10
asparagine-linked glycosylation 10 homolog (yeast, alpha-1,2-glucosyltransferase)
- BCHE
butyrylcholinesterase
- DPP4
dipeptidyl-peptidase 4 (CD26, adenosine deaminase complexing protein 2)
- GCKR
glucokinase (hexokinase 4) regulator
- GUCY1B3
guanylate cyclase 1, soluble, beta 3
- MYST1
MYST histone acetyltransferase 1
- PDIP1
PPARgamma-DBD-interacting protein 1
- PRIC285
PPAR alpha-interacting cofactor 285
- HELZ2
helicase with zinc finger 2, transcriptional coactivator
- PPP3CB
protein phosphatase 3 (formerly 2B), catalytic subunit, beta isoform
- SLC27A2
solute carrier family 27 (fatty acid transporter), member 2
- IFNAR1 and 2
interferon alpha receptor 1 and 2
- IFNGR1
interferon gamma receptor
- IRF7
interferon regulatory factor 7
- IRF9
interferon regulatory factor 9
- JAK1
Janus kinase 1
- STAT2
signal transducer and activator of transcription
- TYK2
tyrosine kinase 2
- ANKFY1
ankyrin repeat and FYVE domain containing 1
- C-C motif
chemokine
- CCRL1
receptor-like 1
- IQGAP2
IQ motif containing GTPase activating protein 2
- ITGB1
(integrin, beta 1 (fibronectin receptor, beta polypeptide, antigen CD29 includes MDF2, MSK12)
- RAB4B
RAB4B, member RAS oncogene family
- SULT1E1
and sulfotransferase family 1E, estrogen-preferring, member 1
- ISG15
IFN stimulated protein 15 kDa
Footnotes
Disclosures
The authors have no conflicts of interest to declare.
Publisher's Disclaimer: This is a PDF file of an unedited manuscript that has been accepted for publication. As a service to our customers we are providing this early version of the manuscript. The manuscript will undergo copyediting, typesetting, and review of the resulting proof before it is published in its final citable form. Please note that during the production process errors may be discovered which could affect the content, and all legal disclaimers that apply to the journal pertain.
Contributor Information
Dahlene N. Fusco, Email: dnfusco@partners.org, Gastrointestinal Unit, Massachusetts General Hospital, 55 Fruit Street Boston MA 02114
Cynthia Brisac, Email: cbrisac@partners.org, Gastrointestinal Unit, Massachusetts General Hospital, 55 Fruit Street Boston MA 02114.
Sinu P. John, Email: sinupjohn@yahoo.com, Laboratory of Systems Biology, NIAID/NIH, Bethesda, MD.
Yi-Wen Huang, Email: ywhuang@cgh.org.tw, Department of Internal Medicine, National Taiwan University College of, Medicine and Hospital, Liver Center, Cathay General Hospital Medical Center &, School of Medicine, Taipei Medical University, No. 280, Sec. 4, Jen-Ai Road, Taipei-10630, Taiwan.
Christopher R. Chin, Email: Christopher.Chin@Umassmed.edu, Department of Microbiology and Physiological Systems, University of Massachusetts Medical School, 55 Lake Avenue North, Worcester MA 01605
Tiao Xie, Email: Tiao_Xie@hms.harvard.edu, Harvard Medical School Image and Data Analysis Core, 240 Longwood Avenue, Boston, MA 02115.
Hong Zhao, Email: minmin2001@gmail.com, Department of Infectious Diseases, Peking University First Hospital, Beijing, China, 100034.
Leiliang Zhang, Email: armzhang@hotmail.com, MOH Key Laboratory of Systems Biology of Pathogens; Institute of Pathogen Biology; Chinese Academy of Medical Sciences & Peking Union Medical College; Beijing, China.
Stephane Chevalier, Email: stephane.chevaliez@hmn.aphp.fr, Hospital University Henri Mondor, Department of Virology, Université Paris-Est, Créteil, France, Gastrointestinal Unit, Massachusetts General Hospital, 55 Fruit Street Boston MA 02114.
Daniel Wambua, Email: wambua@fas.harvard.edu, Gastrointestinal Unit, Massachusetts General Hospital, 55 Fruit Street Boston MA 02114.
Wenyu Lin, Email: wlin1@partners.org, Gastrointestinal Unit, Massachusetts General Hospital, 55 Fruit Street Boston MA 02114.
Lee Peng, Email: lpeng@partners.org, Gastrointestinal Unit, Massachusetts General Hospital, 55 Fruit Street Boston MA 02114.
Raymond T. Chung, Email: rtchung@partners.org, Gastrointestinal Unit, Massachusetts General Hospital, 55 Fruit Street Boston MA 02114.
Abraham L. Brass, Email: Abraham.Brass@umassmed.edu, Ragon Institute, 149 13th Street Charlestown, MA 02129, Current Address: Department of Microbiology and Physiological Systems, University of Massachusetts Medical School, 55 Lake Avenue North, Worcester MA 01605.
References
- 1.Razonable RR. Antiviral drugs for viruses other than human immunodeficiency virus. Mayo Clin Proc. 2011;86:1009–26. doi: 10.4065/mcp.2011.0309. [DOI] [PMC free article] [PubMed] [Google Scholar]
- 2.Leyssen P, De Clercq E, Neyts J. Molecular strategies to inhibit the replication of RNA viruses. Antiviral Res. 2008;78:9–25. doi: 10.1016/j.antiviral.2008.01.004. [DOI] [PMC free article] [PubMed] [Google Scholar]
- 3.De Clercq E. Ten paths to the discovery of antivirally active nucleoside and nucleotide analogues. Nucleosides Nucleotides Nucleic Acids. 2012;31:339–52. doi: 10.1080/15257770.2012.657383. [DOI] [PubMed] [Google Scholar]
- 4.Isaacs A, Lindenmann J. Virus interference. I. The interferon. Proc R Soc Lond B Biol Sci. 1957;147:258–67. [PubMed] [Google Scholar]
- 5.Schoggins JW, Wilson SJ, Panis M, et al. A diverse range of gene products are effectors of the type I interferon antiviral response. Nature. 2011;472:481–5. doi: 10.1038/nature09907. [DOI] [PMC free article] [PubMed] [Google Scholar]
- 6.Metz P, Dazert E, Ruggieri A, et al. Identification of type I and type II interferon-induced effectors controlling hepatitis C virus replication. Hepatology. 2012 doi: 10.1002/hep.25908. [DOI] [PubMed] [Google Scholar]
- 7.Liu SY, Sanchez DJ, Aliyari R, et al. Systematic identification of type I and type II interferon-induced antiviral factors. Proc Natl Acad Sci U S A. 2012;109:4239–44. doi: 10.1073/pnas.1114981109. [DOI] [PMC free article] [PubMed] [Google Scholar]
- 8.Liu SY, Aliyari R, Chikere K, et al. Interferon-Inducible Cholesterol-25-Hydroxylase Broadly Inhibits Viral Entry by Production of 25-Hydroxycholesterol. Immunity. 2012 doi: 10.1016/j.immuni.2012.11.005. [DOI] [PMC free article] [PubMed] [Google Scholar]
- 9.Li Q, Brass AL, Ng A, et al. A genome-wide genetic screen for host factors required for hepatitis C virus propagation. Proc Natl Acad Sci U S A. 2009;106:16410–5. doi: 10.1073/pnas.0907439106. [DOI] [PMC free article] [PubMed] [Google Scholar]
- 10.Echeverri CJ, Beachy PA, Baum B, et al. Minimizing the risk of reporting false positives in large-scale RNAi screens. Nat Methods. 2006;3:777–9. doi: 10.1038/nmeth1006-777. [DOI] [PubMed] [Google Scholar]
- 11.Ingenuity Analyses. 2012. [Google Scholar]
- 12.Zhao H, Lin W, Kumthip K, et al. A functional genomic screen reveals novel host genes that mediate interferon-alpha’s effects against hepatitis C virus. J Hepatol. 2012;56:326–33. doi: 10.1016/j.jhep.2011.07.026. [DOI] [PMC free article] [PubMed] [Google Scholar]
- 13.Fairfax BP, Makino S, Radhakrishnan J, et al. Genetics of gene expression in primary immune cells identifies cell type-specific master regulators and roles of HLA alleles. Nat Genet. 2012;44:502–10. doi: 10.1038/ng.2205. [DOI] [PMC free article] [PubMed] [Google Scholar]
- 14.Zhao C, Denison C, Huibregtse JM, et al. Human ISG15 conjugation targets both IFN-induced and constitutively expressed proteins functioning in diverse cellular pathways. Proc Natl Acad Sci U S A. 2005;102:10200–5. doi: 10.1073/pnas.0504754102. [DOI] [PMC free article] [PubMed] [Google Scholar]
- 15.Bartosch B, Dubuisson J, Cosset FL. Infectious hepatitis C virus pseudo-particles containing functional E1-E2 envelope protein complexes. J Exp Med. 2003;197:633–42. doi: 10.1084/jem.20021756. [DOI] [PMC free article] [PubMed] [Google Scholar]
- 16.Sarasin-Filipowicz M, Oakeley EJ, Duong FH, et al. Interferon signaling and treatment outcome in chronic hepatitis C. Proc Natl Acad Sci U S A. 2008;105:7034–9. doi: 10.1073/pnas.0707882105. [DOI] [PMC free article] [PubMed] [Google Scholar]
- 17.Feld JJ, Nanda S, Huang Y, et al. Hepatic gene expression during treatment with peginterferon and ribavirin: Identifying molecular pathways for treatment response. Hepatology. 2007;46:1548–63. doi: 10.1002/hep.21853. [DOI] [PMC free article] [PubMed] [Google Scholar]
- 18.He XS, Nanda S, Ji X, et al. Differential transcriptional responses to interferon-alpha and interferon-gamma in primary human hepatocytes. J Interferon Cytokine Res. 2010;30:311–20. doi: 10.1089/jir.2009.0082. [DOI] [PMC free article] [PubMed] [Google Scholar]
- 19.Lanford RE, Guerra B, Lee H, et al. Genomic response to interferon-alpha in chimpanzees: implications of rapid downregulation for hepatitis C kinetics. Hepatology. 2006;43:961–72. doi: 10.1002/hep.21167. [DOI] [PubMed] [Google Scholar]
- 20.He XS, Ji X, Hale MB, et al. Global transcriptional response to interferon is a determinant of HCV treatment outcome and is modified by race. Hepatology. 2006;44:352–9. doi: 10.1002/hep.21267. [DOI] [PubMed] [Google Scholar]
- 21.Garaigorta U, Heim MH, Boyd B, et al. Hepatitis C virus (HCV) induces formation of stress granules whose proteins regulate HCV RNA replication and virus assembly and egress. J Virol. 2012;86:11043–56. doi: 10.1128/JVI.07101-11. [DOI] [PMC free article] [PubMed] [Google Scholar]
- 22.Sumpter R, Jr, Loo YM, Foy E, et al. Regulating intracellular antiviral defense and permissiveness to hepatitis C virus RNA replication through a cellular RNA helicase, RIG-I. J Virol. 2005;79:2689–99. doi: 10.1128/JVI.79.5.2689-2699.2005. [DOI] [PMC free article] [PubMed] [Google Scholar]
- 23.Darnell JE, Jr, Kerr IM, Stark GR. Jak-STAT pathways and transcriptional activation in response to IFNs and other extracellular signaling proteins. Science. 1994;264:1415–21. doi: 10.1126/science.8197455. [DOI] [PubMed] [Google Scholar]
- 24.Schoggins JW, Rice CM. Interferon-stimulated genes and their antiviral effector functions. Curr Opin Virol. 2011;1:519–25. doi: 10.1016/j.coviro.2011.10.008. [DOI] [PMC free article] [PubMed] [Google Scholar]
- 25.Dmitriev RI, Shakhparonov MI, Pestov NB. Structure and function of MYST1 histone acetyltransferase in the interactome of animal cells. Biochemistry (Mosc) 2008;73:839–52. doi: 10.1134/s0006297908080014. [DOI] [PubMed] [Google Scholar]
- 26.Reichenbach J, Schubert R, Feinberg J, et al. Impaired interferon-gamma production in response to live bacteria and Toll-like receptor agonists in patients with ataxia telangiectasia. Clin Exp Immunol. 2006;146:381–9. doi: 10.1111/j.1365-2249.2006.03221.x. [DOI] [PMC free article] [PubMed] [Google Scholar]
- 27.Tomaru T, Satoh T, Yoshino S, et al. Isolation and characterization of a transcriptional cofactor and its novel isoform that bind the deoxyribonucleic acid-binding domain of peroxisome proliferator-activated receptor-gamma. Endocrinology. 2006;147:377–88. doi: 10.1210/en.2005-0450. [DOI] [PubMed] [Google Scholar]
- 28.Surapureddi S, Yu S, Bu H, et al. Identification of a transcriptionally active peroxisome proliferator-activated receptor alpha -interacting cofactor complex in rat liver and characterization of PRIC285 as a coactivator. Proc Natl Acad Sci U S A. 2002;99:11836–41. doi: 10.1073/pnas.182426699. [DOI] [PMC free article] [PubMed] [Google Scholar]
- 29.Antonelli A, Ferrari SM, Mancusi C, et al. Interferon-alpha, -beta and -gamma induce CXCL11 secretion in human thyrocytes: Modulation by peroxisome proliferator-activated receptor gamma agonists. Immunobiology. 2012 doi: 10.1016/j.imbio.2012.08.267. [DOI] [PubMed] [Google Scholar]
- 30.de Alvarez ML, Quiroga AD, Parody JP, et al. Cross-talk between IFN-alpha and TGF-beta1 signaling pathways in preneoplastic rat liver. Growth Factors. 2009;27:1–11. doi: 10.1080/08977190802547357. [DOI] [PubMed] [Google Scholar]
- 31.Basu M, Maitra RK, Xiang Y, Bose S, et al. Inhibition of vesicular stomatitis virus infection in epithelial cells by alpha interferon-induced soluble secreted proteins. J Gen Virol. 2006;87:2653–62. doi: 10.1099/vir.0.82039-0. [DOI] [PubMed] [Google Scholar]
Associated Data
This section collects any data citations, data availability statements, or supplementary materials included in this article.