Abstract
Purpose
To evaluate retinal and choroidal blood flow (BF) using high-resolution magnetic resonance imaging (MRI) as well as visual function measured by the electroretinogram (ERG) in patients with retinitis pigmentosa (RP).
Methods
MRI studies were performed in 6 RP patients (29-67 years) and 5 healthy volunteers (29-64 years) on a 3-Tesla scanner with a custom-made surface coil. Quantitative BF was measured using the pseudo-continuous arterial-spin-labeling technique at 0.5x0.8x6.0mm. Full-field ERGs of all patients were recorded. Amplitudes and implicit times of standard ERGs were analyzed.
Results
Basal BF in the posterior retinal-choroid was 142±16 ml/100ml/min (or 1.14±0.13 μl/mm2/min) in the control group and was 70±19 ml/100ml/min (or 0.56±0.15 μl/mm2/min) in the RP group. Retinal-choroidal BF was significantly reduced by 52±8% in RP patients compared to controls (P<0.05). ERG a- and b-wave amplitudes of RP patients were reduced and b-wave implicit times were delayed. There were statistically significant correlations between a-wave amplitude and BF value (r=0.9, P<0.05) but not between b-wave amplitude and BF value (r =0.7, P=0.2).
Conclusions
This study demonstrates a novel non-invasive MRI approach to measure quantitative retinal and choroidal BF in RP patients. We found that retinal-choroidal BF was markedly reduced and significantly correlated with reduced amplitudes of the a-wave of the standard combined ERG.
Keywords: Retinal Diseases, Magnetic Resonance Imaging, Electroretinography, retinal degeneration
INTRODUCTION
Retinitis pigmentosa (RP) is a heterogeneous hereditary disease causing photoreceptor degeneration characterized by intraretinal pigment deposits and attenuation of retinal vessels. RP is one of the leading causes of inherited blindness or visual handicap in the developed world, with a worldwide prevalence of 1 in 4000 [1]. Most RP patients experience night blindness and loss of mid-peripheral visual field in the early stage, gradually lose peripheral visual field and develop tunnel vision, and eventually lose central vision. This classic pattern of visual symptoms reflects the characteristic course of anatomical changes in RP retinae: an initial loss of rod photoreceptors usually begins in the mid-peripheral retina, spreads to peripheral retina, with eventual degeneration of cone photoreceptors and some inner retinal neurons, as well as circulatory alteration and atrophy of the optic nerve head. RP is genetically heterogeneous, with 43 genes identified so far (https://sph.uth.tmc.edu/retnet/sum-dis.htm) accounting for half of all cases. The genetic type is one of the most significant factors determining the onset of the visual symptoms and the disease severity.
Clinical assessment of RP includes psychophysical exams (dark adaption threshold, visual field, visual acuity, and color vision) and objective measurements such as electroretinogram (ERG) and optical coherence tomography (OCT). OCT is a very powerful tool to examine the laminar architecture of the retina, especially in the macular area [2], but provides little physiological information. Among these tests, the ERG has been used frequently to provide an accurate diagnosis of RP, objectively measure the retinal function [3], and longitudinally monitor disease progression [4]. The ERG amplitude of the RP retina declines exponentially with annual rates varying from 8.7% to 18.5% [5,3], depending on the mutation types and environmental factors. A significant relationship between ERG parameters and photoreceptor counts was found in the P23H rhodopsin transgenic rat model [6] as well as the rho−/− mouse model [7] in which changes in the scotopic a- and/or b-wave amplitudes were proportional to cell loss in the outer nuclear layer.
Although progressive loss of photoreceptors is the primary pathology, the RP retina also undergoes extensive vascular and neural remodeling throughout the course of the disease [8]. Retinal blood vessels are attenuated and the caliber of blood vessels are correlated with visual field area [9]. Early studies with fluorescein angiography showed the retinal vasculature to be consistently abnormal, including prolonged transit time, narrowed vessels and lower concentration of dye [10]. Retinal circulation assessed by laser Doppler velocimetry [11], color Doppler imaging [12] and retinal functional imaging [13] showed significantly decreased blood velocity and narrowed blood vessels in RP patients. Changes within the choroidal vasculature have been revealed both in the early [14] and late stages [15] of RP. Subfoveal choroidal blood flow (BF) assessed by laser Doppler Flowmetry (LDF) was found to be significantly reduced in RP, with a possible link between choroidal BF alteration and the RP-associated central cone-mediated dysfunction [16]. The pulsatile component of total retinal-choroidal BF, as measured indirectly by pneumotonometry, was significantly reduced in relatively advanced stages of RP [17,18]. Taken together these findings indicate that there are circulatory changes accompanying retinal degeneration. However, the lack of quantitative depth-resolved imaging techniques has limited the investigation of the physiological and vascular changes in RP and their temporal progression in vivo. A better understanding of the role of the vascular system in RP is an important consideration for therapies based on photoreceptor rescue or restoration.
Previous studies demonstrated the feasibility of MRI to measure quantitative BF in the human retina under baseline [19,20], hypercapnia [20] and isometric exercise [21]. Though the current spatiotemporal resolution of BF MRI is inferior compared to many optical-based imaging techniques, BF MRI provides unique advantages in that it yields tissue perfusion in the quantitative and classical units of ml of blood flow per min per ml of tissue without the need for visualizing individual vessels, allowing direct comparison among different subjects, and longitudinal studies within individual subjects. BF MRI also provides a large field of view and depth resolution.
The goal of this study was to explore a novel application of MRI to study retinal-choroidal BF in patients with retinitis pigmentosa, and to determine whether BF change is associated with visual dysfunction in the same RP patients. To improve the sensitivity and minimize susceptibility artifacts of BF measurement, pseudo-continuous arterial spin-labeling technique (pCASL) with static tissue suppression and single-shot turbo-spin-echo (TSE) acquisition was implemented [20]. A custom-made receive-only eye coil was used on a 3-Tesla clinical MRI scanner to improve signal-to-noise ratio. The full-field ERG provided an objective measurement of retinal function. We tested the null hypothesis that retinal-choroidal BF in patients with retinitis pigmentosa is not significantly different from that of age-matched controls.
METHODS
Subjects
Six patients with a diagnosis of RP and five age- and gender-matched healthy volunteers were recruited in this study with Institutional Review Board approval. The patients were referred for evaluation of visual function by ophthalmologists with a specialty in retina from our Department of Ophthalmology and from the community. One patient had the diagnosis of unilateral RP who served as her own control [22]. This patient had been followed by an ophthalmologist from the community for several years and vascular, traumatic, inflammatory and infectious etiologies had been excluded. Informed consent was obtained from each subject. All procedures followed the tenets of the Declaration of Helsinki. Standard ophthalmologic examination findings were obtained from RP patients and healthy volunteers. In summary, RP patients presented typical symptoms including decreased night vision and peripheral visual field loss, and narrowed retinal vessels and pigmentary changes or pigmentary migration on fundus examination. All patients had normal intra-ocular pressure (IOP) and were capable of maintaining stable central fixation. Age-matched healthy volunteers had no ophthalmic diseases based on standard eye exams with dilation as examined by an ophthalmologist (SC) (note that one subject had early diabetes but normal ophthalmic exams)
Magnetic Resonance Imaging
MRI was performed on a 3 Tesla Philips whole body clinical scanner (Achieva, Philips Healthcare, Best, Netherlands) using the commercial body coil for transmission and a custom-built single-loop surface coil for reception (oval shape, 7x5 cm in diameter) [23]. A single axial slice roughly bisecting the optic nerve head (ONH) of a single eye was imaged. The right eye of most subjects was imaged except for a unilateral RP patient, in which both eyes were imaged. To minimize eye motion during MRI scans, subjects were instructed to blink, if needed, immediately after the data acquisition (which generated distinct sounds as cue) but otherwise maintained fixation on a point with both eyes. This method had been demonstrated to achieve eye fixation stability within 100 μm at the posterior retina [24].
MRI BF measurements were made under ambient light without dark adaptation in a supine position. BF was imaged using the pCASL technique with single-shot TSE sequence as imaging acquisition [20]. pCASL utilized Hanning-shaped radiofrequency pulses with tip angle = 18°, duration = 0.5 ms and a balanced gradient scheme with average labeling gradient = 0.6 mT/m and ratio of peak-to-average gradient =10. pCASL labeling duration = 2000 ms, post-labeling delay = 1500 ms and a labeling plane 7 cm inferior to the imaging plane. Background suppression was employed to minimize signal contamination from vitreous and sclera. TSE acquisition had TR=4600 ms, TE=30 ms, slice thickness = 6 mm, FOV = 50x43 mm, and matrix = 100x53 (resolution of 0.5x0.8mm). The higher spatial resolution was placed along the readout direction, perpendicular to the posterior retina. M0 for quantitative BF calculation was acquired on a separate TSE scan with long TR = 15 s without labeling module and background suppression module. The safety monitor on the scanner reported SAR (specific absorption rate) of 2.9 W/kg for pCASL, which was below the FDA-recommended limit.
MRI Analysis
All MRI images from each scan were first co-registered using a custom algorithm written in Matlab (MathWorks Inc, Natick, MA), as previously described in detail [20]. Quantitative BF maps in units of ml/100ml/min were calculated using the following equation [25]: , where ΔMASL is the difference of the control and label images. λ is the water content of blood in milliliter water per milliliter arterial blood (0.85). [26] Blood T1,blood and T2,blood are 1700 and 275 ms [27,28], α was the arterial spin-labeling efficiency and was assumed to be 0.85 [29]. αinv was 0.83 which corrected for the loss of perfusion signal due to the two background suppression pulses [30]. TI is the post-labeling delay time and M0 is the equilibrium signal intensity of the vitreous calculated from the reference scan corrected for scaling factors and amplification differences with the ASL sequences. The equilibrium signal intensity of the vitreous was used as an intensity reference for pure water, avoiding the use of unknown retina-blood partition coefficient in the quantitative BF calculation.
To objectively quantify BF spatial distribution and minimize the partial-volume effect (PVE), automated profile analysis was performed [31]. The retina-choroid on the TSE image was first detected using an edge-detection technique. Radial projections perpendicular to the vitreous-retina boundary were then obtained with 3 times the spatial interpolation on BF maps. BF profiles were then plotted across the thickness of the retina-choroid complex and along the length of the retina, where the values were taken at the peaks of the projection. The location of the ONH was visualized in the M0 image, and the location of foveal region was defined as 4.9 mm temporal to the ONH [32]. A region of interest (ROI) centered on the fovea with the size of 0.8±0.1 mm (mean±SD) across the retinal and choroidal thickness and 9±1 mm (mean±SD) along the retina was used to obtain the averaged BF values. Area BF in units of μl/mm2/min is readily converted from volume BF ml/100ml/min by multiplying the anterior-posterior thickness of the BF ROI, i.e. BF (μl/mm2/min) = BF (ml/100ml/min)×0.8mm/100.
Electrophysiological Measurements
Full-field ERG was recorded in accordance with the International Society for Clinical Electrophysiology of Vision Standards [32] using the Espion E2 electrophysiology system with ColorDome stimulator (Diagnosys LLC, Lowell, MA). ERGs were recorded with Burian-Allen-Lawwill contact lens electrodes (Hansen Ophthalmic Development Lab, Coralville, IA). The standard ERGs recorded included: single flash cone, 30-Hz flicker, and, after 20 minutes of dark adaptation, rod and standard combined ERGs.
Statistical Analysis
A two-tailed Mann-Whitney test was used to compare BF values from RP patients and age and gender-matched control subjects. Correlation between the individual BF value and each ERG parameter (a-wave amplitude, b-wave amplitude and b-wave implicit time) were evaluated by nonparametric Spearman’s rank correlation. P values < 0.05 were considered statistically significant. All reported values and error bars on graphs were in mean ± standard error of the mean (SEM).
RESULTS
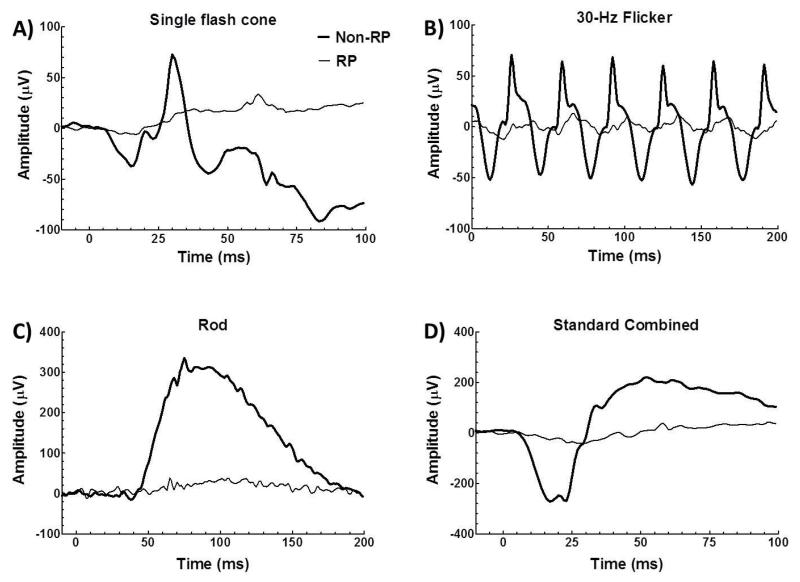
The full-field ERGs from RP (thin trace) and non-RP eyes (thick trace) of the unilateral RP patient are seen in Figure 1. ERGs of the RP eye were subnormal and the b-waves of the ERGs were prolonged. There was no detectable rod ERG.
Figure 1.
Full-field ERGs from RP (thin trace) and non-RP eyes (thick trace) of the unilateral RP patient. ERG includes single flash cone (A), 30-Hz flicker (B), rod (C) and standard combined (D).
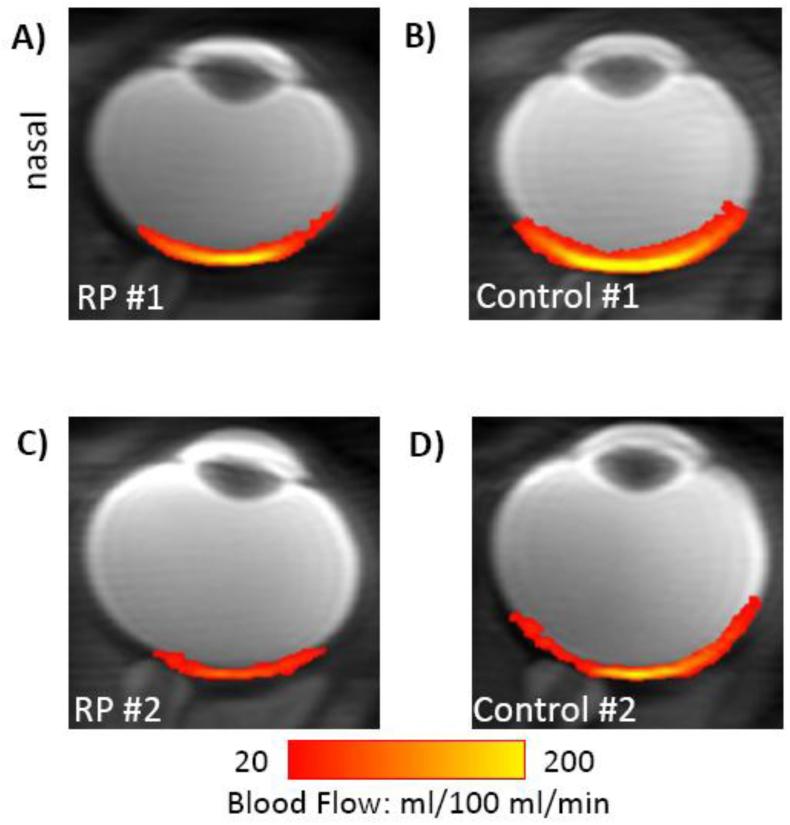
Cross-sectional quantitative BF images in ml/100ml/min under basal conditions from two representative RP eyes (Figure 2A and C) and their matched control eyes (Figure 2B and D). BF images showed minimal distortion. BF peaked at the posterior pole of the retina and dropped significantly at the distal edges of the retina. In addition, BF values in the macular region were lower in RP retinae than those in control retinae.
Figure 2.
Basal BF (in color) overlaid on scout images from two representative RP eyes (A,C) and their matched control eyes (B,D). (A) and (B) were from the RP and non-RP eyes of the same RP patient.
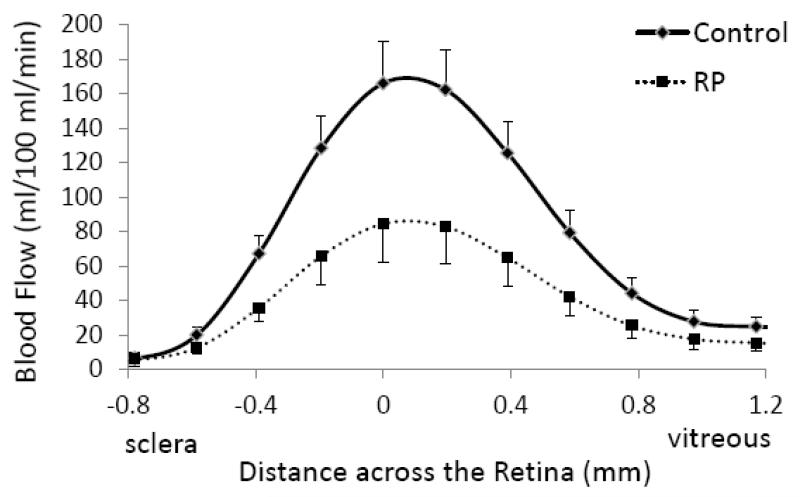
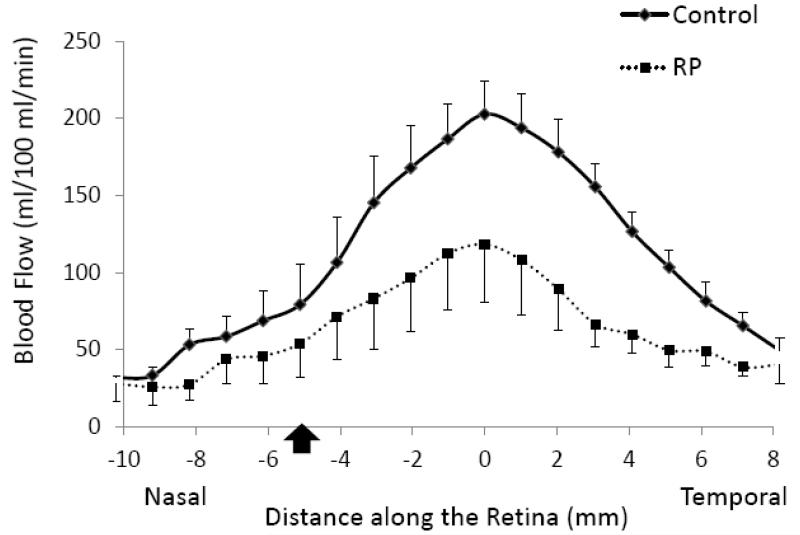
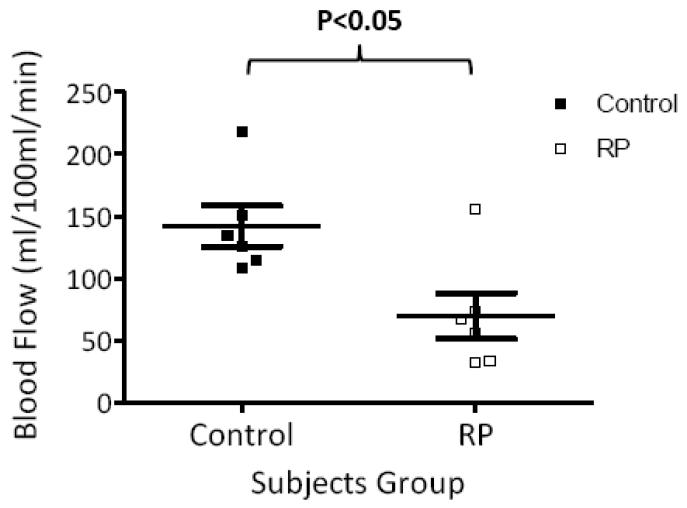
Group-averaged BF profiles were analyzed across the thickness of the retinal-choroidal complex from the sclera to the vitreous (Figure 3). BF in the retinal-choroidal complex was significantly lower in RP retinae compared to control retinae, albeit without differentiating the retinal and choroidal vasculatures due to limited spatial resolution. BF profiles were also analyzed along the length of the retina from the nasal to the temporal side of the fovea (Figure 4). While BF peaked near the fovea in both RP and control groups, BFs in RP retinae were lower than those in control retinae at all locations. Figure 5 shows the scatterplot of each individual BF for RP patients and control subjects. Averaged BF was 70±19 ml/100ml/min (or 0.56±0.15 μl/mm2/min) in RP retinae and was 142±16 ml/100ml/min (or 1.14±0.13 μl/mm2/min) in control retinae, a reduction of 52±8% in RP (P<0.05).
Figure 3.
Blood flow profiles from RP patients (dashed line) and control subjects (solid line) across the retinal-choroidal thickness from the sclera to the vitreous as shown in the inset. Error bars are standard errors of the mean (SEM).
Figure 4.
Blood flow profile from RP patients (dash line) and control subjects (solid line) along the length of the retina from the nasal to the temporal side of fovea as shown in the inset. Error bars are SEM. Black arrow indicates the location of optic nerve head.
Figure 5.
Scatterplot of individual BF values from RP patients (open square) and control subjects (solid square). The bars indicate the mean and SEM.
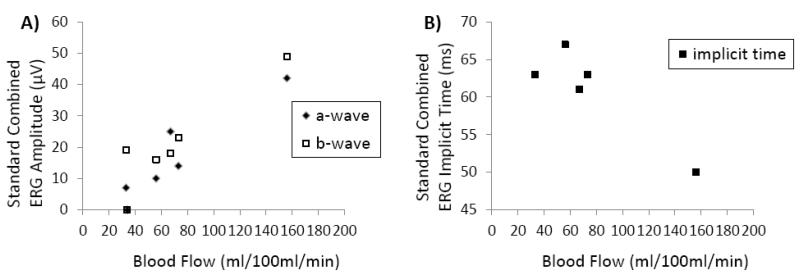
All RP retinae had unrecordable rod ERGs. Cone-mediated single flash and 30-Hz flicker responses from all RP retinae had significantly reduced a- and b-wave amplitude and prolonged b-wave implicit time (larger than 2.5 standard deviations from the normal mean). Figure 6 shows the Spearman’s rank correlation between standard combined ERG parameters and BF of individual RP patients. The a-wave amplitude of the standard combined ERG was positively correlated with corresponding BF values (r=0.9, P<0.05). A weak, but non-significant, positive correlation was also observed between ERG b-wave amplitude and BF values (r =0.7, P=0.2). ERG b-wave implicit time had a negative correlation with BF values (r =−0.7, P=0.2) in RP retinae.
Figure 6.
Scatterplots of standard combined ERG amplitudes (A) and ERG implicit time (B) from each RP patient as a function of retinal-choroidal BF for the same patient.
DISCUSSION
This study reports a novel MRI application to non-invasively examine basal BF changes in unanesthetized human retina with RP. Synchronized eye fixation with cued blinks minimized the potential eye movement and was comfortable for all subjects [24]. Basal BF of the posterior retinal-choroidal complex was 142±16 ml/100 ml/min in normal subjects. This basal BF value was similar to our previously reported value under rest condition from a separate group of healthy volunteers [21]. Basal BF peaked near the fovea and dropped significantly towards the distal edges of the retina. Since there is no retinal vasculature in the fovea, our BF distribution suggests that the MRI BF signal at the current resolution is dominated by choroidal BF as expected because choroidal BF is about an order of magnitude higher than retinal BF [33].
Blood Flow Changes in Retinitis Pigmentosa
The present study shows that BF from a posterior retinal-choroidal complex was significantly reduced in RP patients compared with age- and gender-matched control subjects. Reduced BF is consistent with the fundus observation of attenuated retinal vessels in the same RP patients. Our result is also in agreement with previous studies indicating that ocular blood circulation is altered in RP (see the Introduction). Percentage BF reduction in RP retinae has been reported to range from 26% in subfoveal choroidal vasculature [16], 50% in total pulsatile BF [17] to 76% in retinal vasculature [11]. Our report of 52±8% BF reduction in RP retinae was within the above range. The relatively wide range of BF reduction in RP retinae could be due to different stages of disease being studied, different regions of the retina being analyzed, as well as methodological differences.
Comparing BF measurements among different techniques is never trivial due to different signal sources, different techniques and data analysis having different shortcomings. Volumetric BF is derived on most optical imaging techniques with an arbitrary unit, while MRI measures tissue perfusion in a quantitative manner without visualizing individual vessels. MRI measures BF in the supine position whereas most other methods measure BF in the sitting position. Posture could affect blood pressure gradients and thus blood flow. Caution needs to be exercised when comparing quantitative BF among different techniques. PVE in MRI has the potential to underestimate BF in the retina [34,35]. There could be differences in retinal thicknesses (and thus PVE) between the RP and control groups. The averaged RP retinal thickness in our study was reduced but did not reach statistical significance and thus should not affect our overall conclusion on BF differences between the two groups. There could also be a difference in PVE between central and peripheral retina. Identical analysis was performed between RP patients and controls and thus we do not expect PVE due to the small differences in thickness between central and peripheral retina would affect our overall conclusions. Future studies will need to improve spatial resolution to minimize PVE. With improvement in spatial resolution, BF MRI has the unique potential to provide layer-specific, quantitative assessment of hemodynamic changes in RP retinae.
MRI has been previously applied to study BF changes in animal models of retinal degeneration. Significantly reduced retinal-choroidal BF was reported in the RCS rat model with spontaneous retinal degeneration [36]. Another study in rd10 mice showed significant retinal BF reduction but no changes in choroidal BF up to 60 days [37]. The apparent discrepancy between the current human study and the rd10 mice study is likely due to the different pathology and pathophysiology of retinal degeneration in different species or differences in duration after the onset of retinal degeneration. In humans, retinal pigment epithelium (RPE) disturbances have been reported consistently in the early stages and delayed choriocapillaris filling in a later stage of RP by fluorescein angiography [10]. RPE and choriocapillaris in rd10 mice showed no morphological changes whereas the inner and outer segments of the photoreceptors were almost completely degenerated in 3-week-old animals [38]. Debris from photoreceptor degeneration builds up in RCS rats and rd10 mice but not in most human forms of RP [39]. In a cat model of RP, retinal BF was compromised while choroidal microcirculation was not significantly affected [40], which has been suggested to be due to a protective role of tapetal cells for the choriocapillaris and RPE during the degeneration process in this specific animal model [41].
Correlation between Blood Flow and ERG
The second aim in our study was to determine whether BF deficiency in RP was related to their impaired retinal function as assessed by full-field ERG. In all RP patients, there was no recordable rod ERG. The amplitude of the standard combined ERG a-wave was significantly correlated with retinal-choroidal BF. ERG amplitudes have been shown to correlate with remaining photoreceptor counts in P23H rhodopsin transgenic rats (the P23H mutation of opsin is a common mutation causing RP in humans) and in Rho−/− mice (see the introduction). Changes in the scotopic a- and b-wave amplitudes in these rats were proportional to cell loss in the outer nuclear layer [6]. Because the a-wave of the standard combined ERG arises mainly in the photoreceptors, while the b-wave of the standard combined ERG arises mainly in the on-bipolar cells [3], it is reasonable to suggest that the correlations between BF and ERG amplitudes found in this present study reflect pathological changes in vasculature systems associated with photoreceptor degeneration.
Indeed, several previous studies demonstrated similar correlations between circulatory parameters and visual function. Subfoveal choroidal BF alteration was linked to RP-associated central cone-mediated dysfunction as assessed by focal ERG [16]. Ocular pulse amplitude, an indirect measure of choroidal perfusion, was significantly correlated with visual-field area measured by Goldmann perimetry in RP patients [18]. Interestingly, both ERG and Goldmann visual field tests were shown to be good measures of the remaining functioning retina irrespective of inheritance models and dystrophic pattern ERG and visual field area were also significantly correlated with each other [42,43].
RP has a complex pathophysiology and genetic type plays a critical role in determining the disease severity and retinal dysfunction measured by ERG [7]. Similarly, gene-specific disease mechanisms may also influence the role of ocular hemodynamics in the degenerative progression. In addition, retinal and choroidal vasculatures may undergo different alterations in light of their dramatic differences in healthy retina. Future studies are needed to improve sensitivity and spatiotemporal resolution so that vascular-specific changes can be evaluated. Incorporating three-dimensional BF measurement and multi-focal ERG may also provide a better understanding of the relationship between BF and visual function because the degeneration in RP is regionally heterogeneous [2,44].
The patient with unilateral RP
Unilateral RP is exceedingly rare. The ERG and BF data of the two eyes from the patient with unilateral RP warrant further discussion as these data are outliers in both Figure 5 and 6. This patient had less reduction in standard combined ERG a-wave amplitude, b-wave amplitude and retinal-choroidal BF, and the b-wave implicit time of the standard combined ERG was within normal range, suggesting a less severe or less advanced form of RP than other patients. Indeed, this unilateral RP patient (29 years old) was also much younger than the other patients (42 to 68 years old). Differences between unilateral and bilateral RP and ages might have contributed to differences in disease stage and severity which could account the ERG and BF data being the outliners.
In addition to BF MRI, anatomical MRI has also been applied to study the retina using a variety of contrasts, such as T1 [45,46], T2 [45-47], balanced steady state free precession [48], diffusion [45,47], and manganese-enhanced [49-51], chromium-enhanced [52], microangiographic [53] MRI. Functional MRI based on BOLD [54,55,46], blood-volume [56,57], manganese-enhanced [58,50], balanced steady-state free precession [48], and diffusion [59] contrasts have also been demonstrated. These approaches, although mostly demonstrated on animal models to date, have the potential to be applied to study RP and other retinal diseases in humans.
CONCLUSIONS
Retinal-choroidal BF was significantly reduced in RP patients compared with age-matched controls and significantly correlated with a-wave amplitude, suggesting a link between hemodynamic dysfunction and progressive photoreceptor degeneration. BF MRI offers the advantages of quantitative tissue perfusion with a large field of view and unambiguous depth resolution. In addition to BF, MRI could also provide anatomical, oxygen tension and functional data in the same setting. Future studies will need to improve spatial resolution to visualize retinal and choroidal BF, include three-dimensional BF MRI and functional MRI. MRI has the potential to provide unique, clinically relevant, and depth-resolved information for early detection, disease staging and testing novel therapeutic strategies in RP and other retinal diseases.
ACKNOWLEDGEMENT
This work was supported by a Clinical Translational Science Award Pilot Grant and a Translational Technology Resource grant (parent grant UL1TR000149), NIH/NEI (R01 EY014211 and EY018855), and Department of Veterans Affairs MERIT awards to TQD.
REFERECES
- 1.Hartong DT, Berson EL, Dryja TP. Retinitis pigmentosa. The Lancet. 2006;368:1795–1809. doi: 10.1016/S0140-6736(06)69740-7. [DOI] [PubMed] [Google Scholar]
- 2.Vámos R, Tátrai E, Németh J, Holder GE, DeBuc DC, Somfai GM. The Structure and Function of the Macula in Patients with Advanced Retinitis Pigmentosa. Invest Ophthalmol Vis Sci. 2011;52:8425–8432. doi: 10.1167/iovs.11-7780. [DOI] [PMC free article] [PubMed] [Google Scholar]
- 3.Gundogan F, Tas A, Sobaci G. Belusic G, editor. Electroretinogram in Hereditary Retinal Disorders. Electroretinograms. 2011 doi:10.5772/21704. [Google Scholar]
- 4.Berson EL, Rosner B, Sandberg MA, Hayes KC, Nicholson BW, Weigel-DiFranco C, Willett W. A randomized trial of vitamin A and vitamin E supplementation for retinitis pigmentosa. Arch Ophthalmol. 1993;111:761–772. doi: 10.1001/archopht.1993.01090060049022. [DOI] [PubMed] [Google Scholar]
- 5.Herscovitch P, Markham J, Raichle ME. Brain blood flow measured with intravenous H2(15)O. I. Theory and error analysis. J Nucl Med. 1983;24:782–789. [PubMed] [Google Scholar]
- 6.Machida S, Kondo M, Jamison JA, Khan NW, Kononen LT, Sugawara T, Bush RA, Sieving PA. P23H rhodopsin transgenic rat: correlation of retinal function with histopathology. Invest Ophthalmol Vis Sci. 2000;41:3200–3209. [PubMed] [Google Scholar]
- 7.Wang R, Jiang C, Ma J, Young MJ. Monitoring Morphological Changes in the Retina of Rhodopsin−/− Mice with Spectral Domain Optical Coherence Tomography. Invest Ophthalmol Vis Sci. 2012;53:3967–3972. doi: 10.1167/iovs.12-9716. [DOI] [PubMed] [Google Scholar]
- 8.Marc RE, Jones BW, Watt CB, Strettoi E. Neural remodeling in retinal degeneration. Prog Retin Eye Res. 2003;22:607–655. doi: 10.1016/s1350-9462(03)00039-9. [DOI] [PubMed] [Google Scholar]
- 9.Ma Y, Kawasaki R, Dobson LP, Ruddle JB, Kearns LS, Wong TY, Mackey DA. Quantitative Analysis of Retinal Vessel Attenuation in Eyes with Retinitis Pigmentosa. Invest Ophthalmol Vis Sci. 2012;53:4306–4314. doi: 10.1167/iovs.11-8596. [DOI] [PubMed] [Google Scholar]
- 10.Merin S, Auerbach E. Retinitis pigmentosa. Surv Ophthalmol. 1976;20:303–346. doi: 10.1016/s0039-6257(96)90001-6. [DOI] [PubMed] [Google Scholar]
- 11.Grunwald JE, Maguire AM, Dupont J. Retinal hemodynamics in retinitis pigmentosa. Am J Ophthalmol. 1996;122:502–508. doi: 10.1016/s0002-9394(14)72109-9. [DOI] [PubMed] [Google Scholar]
- 12.Akyol N, Kukner S, Celiker U, Koyu H, Luleci C. Decreased retinal blood flow in retinitis pigmentosa. Can J Ophthalmol. 1995;30:28–32. [PubMed] [Google Scholar]
- 13.Beutelspacher S, Serbecic N, Barash H, Burgansky-Eliash Z, Grinvald A, Krastel H, Jonas J. Retinal blood flow velocity measured by retinal function imaging in retinitis pigmentosa. Graefe’s Archive for Clinical and Experimental Ophthalmology. 2011;249:1855–1858. doi: 10.1007/s00417-011-1757-y. [DOI] [PubMed] [Google Scholar]
- 14.Best M, Galin MA, Blumenthal M, Toyofuku H. Fluorescein angiography during induced ocular hypertension in retinitis pigmentosa. Am J Ophthalmol. 1971;71:1226–1230. doi: 10.1016/0002-9394(71)90967-6. [DOI] [PubMed] [Google Scholar]
- 15.Best M, Toyofuku H, Galin MA. Ocular hemodynamics in retinitis pigmentosa. Arch Ophthalmol. 1972;88:123–130. doi: 10.1001/archopht.1972.01000030125001. [DOI] [PubMed] [Google Scholar]
- 16.Falsini B, Anselmi GM, Marangoni D, D’Esposito F, Fadda A, Di Renzo A, Campos EC, Riva CE. Subfoveal choroidal blood flow and central retinal function in retinitis pigmentosa. Invest Ophthalmol Vis Sci. 2011;52:1064. doi: 10.1167/iovs.10-5964. [DOI] [PubMed] [Google Scholar]
- 17.Langham ME, Kramer T. Decreased choroidal blood flow associated with retinitis pigmentosa. Eye (Lond) 1990;4(Pt 2):374–381. doi: 10.1038/eye.1990.50. [DOI] [PubMed] [Google Scholar]
- 18.Schmidt KG, Pillunat LE, Kohler K, Flammer J. Ocular pulse amplitude is reduced in patients with advanced retinitis pigmentosa. Br J Ophthalmol. 2001;85:678–682. doi: 10.1136/bjo.85.6.678. [DOI] [PMC free article] [PubMed] [Google Scholar]
- 19.Maleki N, Dai W, Alsop DC. Blood flow quantification of the human retina with MRI. NMR Biomed. 2011;24:104–111. doi: 10.1002/nbm.1564. [DOI] [PubMed] [Google Scholar]
- 20.Peng Q, Zhang Y, Nateras OS, van Osch MJ, Duong TQ. MRI of Blood Flow of the Human Retina. Magn Reson Med. 2011;65:1768–1775. doi: 10.1002/mrm.22763. [DOI] [PMC free article] [PubMed] [Google Scholar]
- 21.Zhang Y, Nateras OSE, Peng Q, Rosende CA, Duong TQ. Blood Flow MRI of the Human Retina/Choroid during Rest and Isometric Exercise. Invest Ophthalmol Vis Sci. 2012;53:4299–4305. doi: 10.1167/iovs.11-9384. [DOI] [PMC free article] [PubMed] [Google Scholar]
- 22.Potsidis E, Berson EL, Sandberg MA. Disease Course of Patients with Unilateral Pigmentary Retinopathy. Invest Ophthalmol Vis Sci. 2011;52:9244–9249. doi: 10.1167/iovs.11-7892. [DOI] [PMC free article] [PubMed] [Google Scholar]
- 23.Zhang Y, Peng Q, Kiel JW, Rosende CA, Duong TQ. Magnetic resonance imaging of vascular oxygenation changes during hyperoxia and carbogen challenges in the human retina. Invest Ophthalmol Vis Sci. 2011;52:286–291. doi: 10.1167/iovs.10-6108. [DOI] [PMC free article] [PubMed] [Google Scholar]
- 24.Zhang Y, Nateras OS, Peng Q, Kuranov RV, Harrison JM, Milner TE, Duong TQ. Lamina-specific anatomic magnetic resonance imaging of the human retina. Invest Ophthalmol Vis Sci. 2011;52:7232–7237. doi: 10.1167/iovs.11-7623. [DOI] [PMC free article] [PubMed] [Google Scholar]
- 25.Chalela JA, Alsop DC, Gonzalez-Atavales JB, Maldjian JA, Kasner SE, Detre JA. Magnetic resonance perfusion imaging in acute ischemic stroke using continuous arterial spin labeling. Stroke. 2000;31:680–687. doi: 10.1161/01.str.31.3.680. [DOI] [PubMed] [Google Scholar]
- 26.Herscovitch P, Raichle ME. What is the correct value for the brain--blood partition coefficient for water? J Cereb Blood Flow Metab. 1985;5:65–69. doi: 10.1038/jcbfm.1985.9. [DOI] [PubMed] [Google Scholar]
- 27.Lu H, Clingman C, Golay X, van Zijl PC. Determining the longitudinal relaxation time (T1) of blood at 3.0 Tesla. Magn Reson Med. 2004;52:679–682. doi: 10.1002/mrm.20178. [DOI] [PubMed] [Google Scholar]
- 28.Stanisz GJ, Odrobina EE, Pun J, Escaravage M, Graham SJ, Bronskill MJ, Henkelman RM. T1, T2 relaxation and magnetization transfer in tissue at 3T. Magn Reson Med. 2005;54:507–512. doi: 10.1002/mrm.20605. [DOI] [PubMed] [Google Scholar]
- 29.Wu WC, Fernandez-Seara M, Detre JA, Wehrli FW, Wang J. A theoretical and experimental investigation of the tagging efficiency of pseudocontinuous arterial spin labeling. Magn Reson Med. 2007;58:1020–1027. doi: 10.1002/mrm.21403. [DOI] [PubMed] [Google Scholar]
- 30.Garcia DM, Duhamel G, Alsop DC. Efficiency of inversion pulses for background suppressed arterial spin labeling. Magn Reson Med. 2005;54:366–372. doi: 10.1002/mrm.20556. [DOI] [PubMed] [Google Scholar]
- 31.Cheng H, Nair G, Walker TA, Kim MK, Pardue MT, Thule PM, Olson DE, Duong TQ. Structural and functional MRI reveals multiple retinal layers. Proc Natl Acad Sci U S A. 2006;103:17525–17530. doi: 10.1073/pnas.0605790103. [DOI] [PMC free article] [PubMed] [Google Scholar]
- 32.Marmor M, Fulton A, Holder G, Miyake Y, Brigell M, Bach M. ISCEV Standard for full-field clinical electroretinography (2008 update) Doc Ophthalmol. 2009;118:69–77. doi: 10.1007/s10633-008-9155-4. [DOI] [PubMed] [Google Scholar]
- 33.Bill A. Circulation in the eye. In: Renkin EM, Michel CC, editors. Handbook of Physiology: Cardiovascular. American Physiological Society; Bethesda, MD: 1984. [Google Scholar]
- 34.Duong TQ, Pardue MT, Thule PM, Olson DE, Cheng H, Nair G, Li Y, Kim M, Zhang X, Shen Q. Layer-specific anatomical, physiological and functional MRI of the retina NMR Biomed. 2008;21:978–996. doi: 10.1002/nbm.1311. [DOI] [PMC free article] [PubMed] [Google Scholar]
- 35.Duong TQ, Muir ER. Magnetic resonance imaging of the retina. Jpn J Ophthalmol. 2009;53:352–367. doi: 10.1007/s10384-009-0688-1. [DOI] [PMC free article] [PubMed] [Google Scholar]
- 36.Li Y, Cheng H, Shen Q, Kim M, Thule PM, Olson DE, Pardue MT, Duong TQ. Blood flow magnetic resonance imaging of retinal degeneration. Invest Ophthalmol Vis Sci. 2009;50:1824. doi: 10.1167/iovs.08-2188. [DOI] [PMC free article] [PubMed] [Google Scholar]
- 37.Muir ER, De La Garza B, Duong TQ. Blood flow and anatomical MRI in a mouse model of retinitis pigmentosa. Magn Reson Med. 2012 doi: 10.1002/mrm.24232. [DOI] [PMC free article] [PubMed] [Google Scholar]
- 38.Neuhardt T, May CA, Wilsch C, Eichhorn M, Lutjen-Drecoll E. Morphological changes of retinal pigment epithelium and choroid in rd-mice. Exp Eye Res. 1999;68:75–83. doi: 10.1006/exer.1998.0589. [DOI] [PubMed] [Google Scholar]
- 39.Flannery JG, Farber D, Bird AC, Bok D. Degenerative changes in a retina affected with autosomal dominant retinitis pigmentosa. Invest Ophthalmol Vis Sci. 1989;30:191–211. [PubMed] [Google Scholar]
- 40.Nilsson SFE, Mäepea O, Alm A, Narfström K. Ocular blood flow and retinal metabolism in Abyssinian cats with hereditary retinal degeneration. Invest Ophthalmol Vis Sci. 2001;42:1038–1044. [PubMed] [Google Scholar]
- 41.May CA, Narfstrom K. Choroidal microcirculation in Abyssinian cats with hereditary rod-cone degeneration. Exp Eye Res. 2008;86:537–540. doi: 10.1016/j.exer.2007.12.011. [DOI] [PubMed] [Google Scholar]
- 42.Ben-Zion I, Harris A, Weizman Y, Ehrlich R, Rechtman E. [An updated review of methods for human retinal oximetry measurements and current applications] Harefuah. 2008;147:812–817. 836. [PubMed] [Google Scholar]
- 43.Harris A, Dinn RB, Kagemann L, Rechtman E. A review of methods for human retinal oximetry. Ophthalmic Surg Lasers Imaging. 2003;34:152–164. [PubMed] [Google Scholar]
- 44.Jacobson SG, Roman AJ, Aleman TS, Sumaroka A, Herrera W, Windsor EA, Atkinson LA, Schwartz SB, Steinberg JD, Cideciyan AV. Normal central retinal function and structure preserved in retinitis pigmentosa. Invest Ophthalmol Vis Sci. 2010;51:1079–1085. doi: 10.1167/iovs.09-4372. [DOI] [PubMed] [Google Scholar]
- 45.Shen Q, Cheng H, Pardue MT, Chang TF, Nair G, Vo VT, Shonat RD, Duong TQ. Magnetic resonance imaging of tissue and vascular layers in the cat retina. J Magn Reson Imaging. 2006;23:465–472. doi: 10.1002/jmri.20549. [DOI] [PMC free article] [PubMed] [Google Scholar]
- 46.Cheng H, Nair G, Walker TA, Kim MK, Pardue MT, Thule PM, Olson DE, Duong TQ. Structural and functional MRI reveals multiple retinal layers. Proc Natl Acad Sci USA. 2006;103:17525–17530. doi: 10.1073/pnas.0605790103. [DOI] [PMC free article] [PubMed] [Google Scholar]
- 47.Chen J, Wang Q, Zhang H, Yang X, Wang J, Berkowitz BA, Wickline SA, Song SK. In vivo quantification of T(1), T(2), and apparent diffusion coefficient in the mouse retina at 11.74T. Magn Reson Med. 2008;59:731–738. doi: 10.1002/mrm.21570. [DOI] [PubMed] [Google Scholar]
- 48.Muir ER, Duong TQ. Layer-Specific Functional and Anatomical MRI of the Retina with Passband Balanced SSFP. Magn reson Med. 2011;66:1416–1421. doi: 10.1002/mrm.22935. [DOI] [PMC free article] [PubMed] [Google Scholar]
- 49.Berkowitz BA, Roberts R, Luan H, Bissig D, Bui BV, Gradianu M, Calkins DJ, Vingrys AJ. Manganese-enhanced MRI studies of alterations of intraretinal ion demand in models of ocular injury. Invest Ophthalmol Vis Sci. 2007;48:3796–3804. doi: 10.1167/iovs.06-1278. [DOI] [PMC free article] [PubMed] [Google Scholar]
- 50.De La Garza BH, Li G, Shih YY, Duong TQ. Layer-specific manganese-enhanced MRI of the retina in light and dark adaptation. Invest Ophthalmol Vis Sci. 2012;53:4352–4358. doi: 10.1167/iovs.11-8826. [DOI] [PMC free article] [PubMed] [Google Scholar]
- 51.Nair G, Kim M, Pardue MT, Duong TQ. Manganese-Enhanced MRI Reveals Multiple Cellular and Vascular Layers. J Magn Reson Imag. 2011;34:1422–1429. doi: 10.1002/jmri.22719. [DOI] [PMC free article] [PubMed] [Google Scholar]
- 52.Chan KC, Fan SJ, Zhou IY, Wu EX. In vivo chromium-enhanced MRI of the retina. Magn Reson Med. 2012;68:1202–1210. doi: 10.1002/mrm.24123. [DOI] [PubMed] [Google Scholar]
- 53.Shih YY, Muir ER, Li G, De La Garza BH, Duong TQ. High-Resolution 3D MR Microangiography of the Rat Ocular Circulation. Radiology. 2012;264:234–241. doi: 10.1148/radiol.12112033. [DOI] [PMC free article] [PubMed] [Google Scholar]
- 54.Duong TQ, Ngan S-C, Ugurbil K, Kim S-G. Functional Magnetic Resonance Imaging of the Retina. Invest Ophthalmol Vis Sci. 2002;43:1176–1181. [PMC free article] [PubMed] [Google Scholar]
- 55.De La Garza BH, Muir ER, Li G, Shih YY, Duong TQ. Blood oxygenation level-dependent (BOLD) functional MRI of visual stimulation in the rat retina at 11.7 T. NMR Biomed. 2011;24:188–193. doi: 10.1002/nbm.1571. [DOI] [PMC free article] [PubMed] [Google Scholar]
- 56.Nair G, Tanaka Y, Kim M, Olson DE, Thule PM, Pardue MT, Duong TQ. MRI reveals differential regulation of retinal and choroidal blood volumes in rat retina. Neuroimage. 2011;54:1063–1069. doi: 10.1016/j.neuroimage.2010.09.020. [DOI] [PMC free article] [PubMed] [Google Scholar]
- 57.Shih YY, De la Garza BH, Muir ER, Rogers WE, Harrison JM, Kiel JW, Duong TQ. Lamina-specific functional MRI of retinal and choroidal responses to visual stimuli. Invest Ophthalmol Vis Sci. 2011;52:5303–5310. doi: 10.1167/iovs.10-6438. [DOI] [PMC free article] [PubMed] [Google Scholar]
- 58.Bissig D, Berkowitz BA. Same-session functional assessment of rat retina and brain with manganese-enhanced MRI. Neuroimage. 2011;58:749–760. doi: 10.1016/j.neuroimage.2011.06.062. [DOI] [PMC free article] [PubMed] [Google Scholar]
- 59.Bissig D, Berkowitz BA. Light-dependent changes in outer retinal water diffusion in rats in vivo. Mol Vis. 2012;18:2561–2577. [PMC free article] [PubMed] [Google Scholar]


