Abstract
Solid-state properties of tolfenamic acid (TA) and its complexes with chitosan (CT) have been studied. Effect of medium pH, molecular weight of polymer and its different concentrations on these TA–CT complexes were studied in detail. Low and medium molecular weight CT have been used in different ratios at pH ranging from 4 to 6 and freeze-drying technique has been employed to modify the appearance of crystalline TA. Physical properties of the formed complexes have been studied by employing X-ray diffraction, differential scanning calorimetry and scanning electron microscopy; chemical structure has been studied using Fourier transform infrared spectroscopy. The results showed that both forms of the polymer exhibited complete conversion in 1:8 ratio at pH 4, 1:4 at pH 5 and 1:1 at pH 6 indicating a marked effect of pH on drug–polymer complexation. The percent crystallinity calculations indicated low molecular weight CT slightly more effective than the other form. No changes in the complexes have been observed during the 12 week storage under controlled conditions. Both forms of CT at different pH values indicated retardation of recrystallization in TA during cooling of the melt from 1:1 ratios exhibiting formation of strong intermolecular hydrogen bonding between the drug and the polymer.
KEY WORDS: amorphous, chitosan, effect of pH and molecular weight, freeze-drying, recrystallization, tolfenamic acid
INTRODUCTION
Tolfenamic acid (2-[(3-chloro-2-methylphenyl)amino]benzoic acid) is a cyclo-oxygenase inhibitor and belongs to the family of NSAIDs (Fig. 1a). Due to its anti-inflammatory and analgesic properties, it has been used in the treatment of migraine, dysmenorrhoea, rheumatoid arthritis, osteoarthritis, etc. (1,2). Recently, it has been discovered that tolfenamic acid can also be used as a novel anticancer therapeutic agent against different types of cancers (3–8) and is currently under clinical trials on cancer patients (5). It has also shown some therapeutic intervention in slowing down the progression of Alzheimer’s disease (9,10) as well as excellent in vitro antibacterial activity against Helicobacter pylori after complexation with bismuth (III) (11).
Fig. 1.
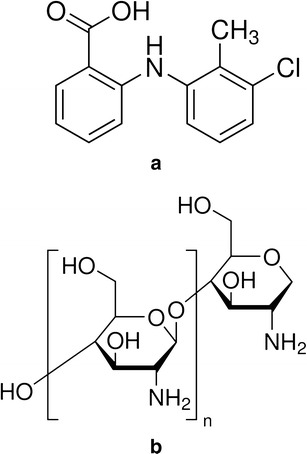
Structures of tolfenamic acid a and chitosan b
Tolfenamic acid (TA) is a white or slightly yellow crystalline powder and is practically insoluble in water (2,12). Aqueous insolubility of drugs is a major problem in developing formulations with enhanced bioavailability and efficacy (13,14). It has been reported that formulation of a drug with some new approaches may result in changes in plasma concentration profile after oral administration due to improve drug solubility and dissolution characteristics (13,15). Several workers have used different methods of drug modification to change its solid-state properties, such as, particle size reduction, alteration in crystal structure, salt formation, drug–polymer complexation, formulation of drug with lipophilic bases, formation of solid dispersions, etc. These are some of the approaches that have been employed to enhance therapeutic activity of drugs (13,16).
The mechanism of drug–polymer complexation is often attributed to higher amounts of the polymer required to convert and stabilize the drug into its amorphous form. This conversion and its stability are dependent upon the formation of strong intermolecular hydrogen bonds that decreases the mobility of high-energy amorphous molecules. However, the increased amount of these hydrophilic polymers and their ability of enhanced uptake of moisture lead to recrystallization of the amorphous drug molecule (13,17,18). Similarly, techniques like freeze-drying, spray drying, milling, etc. also favour the formation of amorphous character (16–18). Sometimes combination of techniques such as freeze-drying and complexation with polymers may result in better modifications of solid-state properties (18). Similarly, the effect of pH has also been considered as an important parameter in evaluating drug complexation (19–21). Another important parameter
Although studies reported on the complexation of TA with polymers are limited in numbers, but the interest and understanding has increased over the years, as a number of papers are available in literature regarding its clinical uses, indicating the importance of this drug that has been realized both by clinicians and physical scientists. Interactions and complexation of TA with polymers like cyclodextrins (22–24), polyvinylpyrrolidone (13), and poloxamer-407 (14) have been studied previously that resulted in improved aqueous solubility of the drug.
Chitosan (CT) is a cationic polymer (Fig. 1b) having good biocompatibility, biodegradability and bioactivity (25,26). It has been used in a variety of cosmetic and pharmaceutical preparations due to its improved performance and is also involved in a number of drug delivery studies (25–27). CT is insoluble in water, organic solvents and is precipitated in alkaline solutions. In dilute aqueous acidic solutions of pH < 6.5, its glucosamine units are protonated to form R–NH3+, thus making it soluble (25,27,28). A number of workers have previously employed CT to complex with different classes of drugs such as anticancer (29,30) and anti-inflammatory drugs (31–33), calcium channel blockers (34), antibiotics (35,36), corticosteroids (37,38), etc. and have studied the effect of drug–polymer complexation for improved drug delivery applications.
The above mentioned properties and ability of CT to protonate makes it an ideal candidate to be studied with TA for intermolecular interactions. Different drug–polymer ratios with increasing polymer concentrations have been employed to identify the optimum concentration of CT required to obtain TA into its amorphous form after freeze-drying. The study also aims to evaluate the effect of molecular weight of the polymer at different pH values on the complexation behaviour, which is a novel combination and has not been reported in literature to date.
MATERIALS AND METHODS
Materials
TA (99.97%) and CT (75–85% deacetylated, low and medium molecular weight) were purchased from Sigma-Aldrich Company Ltd. (Dorset, UK). All other chemicals and solvents used in this study were of analytical grade.
Preparation of Drug and Polymer Solutions
A 1% solution of TA was prepared in ethanol. Similarly 1% solutions of CT of both low (LMW) and medium molecular weight (MMW), respectively, were prepared in 0.05 M solution of acetic acid and stirred for 24 h, protected from light. All solutions were homogenous and transparent in appearance.
Preparation of Samples for Freeze-Drying
Drug–polymer solutions for freeze-drying were prepared in different ratios: 1:1, 1:2, 1:4, 1:8 and 1:16 (both for low and medium molecular weights), respectively. The pH of the samples was found ∼5. The solutions were thoroughly mixed and subjected to freeze-drying (Epsilon 1–4, Christ, Germany) on 0.1 mbar pressure at −50°C for 24 h. After freeze-drying the samples were stored at room temperature in a desiccator containing silica gel, protected from light. The initial analysis was carried out within 2 days at room temperature and the stored samples were further characterized weekly for 12 weeks to monitor any changes that may result during storage.
Characterization Studies
X-ray Diffractometry
The pure and freeze-dried samples were subjected to X-ray diffractometry (XRD) analysis and the diffraction patterns were recorded at room temperature with a STOE STADI-P high-resolution diffractometer (Darmstadt, Germany) using Cu K-alpha1 radiation (wavelength = 1.54051 Å) operated at 40 kV and 35 mA. Each data was collected over the 2θ range 5–60° for 60 min by using proprietary STOE WinXPOW software.
Differential Scanning Calorimetry
Differential scanning calorimetry (DSC) analysis was carried out to study the thermal behaviour of the pure and freeze-dried samples in triplicate by using DSC 6 (PerkinElmer, USA). The DSC was purged with nitrogen gas with a flow rate of 20 ml/min whereas calibration of the instrument was carried using standard indium and zinc. Samples in triplicate were accurately weighed (3 ± 0.1 mg) in pin hole aluminium pans which were then covered with aluminium lids and heated from 30 to 250°C at a heating rate of 10°C/min. For the recrystallization studies, the samples were heated in the similar conditions and cooled down at a rate of 20°C/min. The thermograms were analyzed using Pyris 7.0 software.
Scanning Electron Microscopy
Scanning electron microscopy (SEM) of pure and freeze-dried samples was carried out using Inspect™ F (FEI, Holland) microscope with an accelerating voltage of 5 kV. Prior to examination, the samples were mounted on 0.5-in. aluminium stubs by the help of double sided carbon adhesive tabs (Agar Scientific, UK) and made electrically conductive by performing carbon coating using Speedivac carbon coating unit (Model 12E6/1598). The magnification selected was sufficient for observing the detailed morphology of the samples under study.
Fourier Transform Infrared Spectrometry
Fourier transform infrared spectrometry (FTIR) spectra were obtained with a Nicolet Nexus FTIR spectrophotometer (Thermo Fisher Scientific Inc., USA), within a spectral range of 4,000–400 cm−1 at a resolution of 4 cm−1 with 64 scans and the spectral data processed using Omnic 7.4 software.
pH Measurement
The pH of each set of solutions for drug–polymer complexation was adjusted to one pH unit, below (∼4) and one unit above (∼6), the actual pH of the solutions (i.e. ∼5), with a few drops of either 1 M solution of acetic acid or sodium hydroxide with a calibrated pH meter (model pH 209, Hanna instruments, UK) using a combination electrode. The samples were then subjected to freeze-drying, storage and analysis under the same conditions as described in the above sections.
RESULTS
Appearance of the Freeze-Dried Samples
The polymer solutions alone and in combination with the drug in different ratios were obtained as thin white/off-white films after freeze-drying. These films were then subjected to characterization studies to confirm the degree of conversion of crystalline state of TA into its amorphous form.
XRD Analysis
Crystallinity of TA in the polymer matrix of different ratios was evaluated using XRD. The pure crystalline TA showed characteristic diffraction lines at 2θ values of 5.21°, 11.58°, 15.72°, 18.70°, 19.77°, 24.90°, 25.32°, 25.90°, and 26.81° respectively, whereas no lines were observed in the pure polymers due to their amorphous nature. The diffraction patterns of TA and freeze-dried samples of both LMW and MMW CT are shown in Fig. 2. The XRD data clearly show a marked decrease in the diffraction intensity of TA when combined with either form of the CT and no lines has been observed from 1:4 ratios and onwards. Further confirmation of XRD results was made by performing DSC, FTIR and SEM.
Fig. 2.
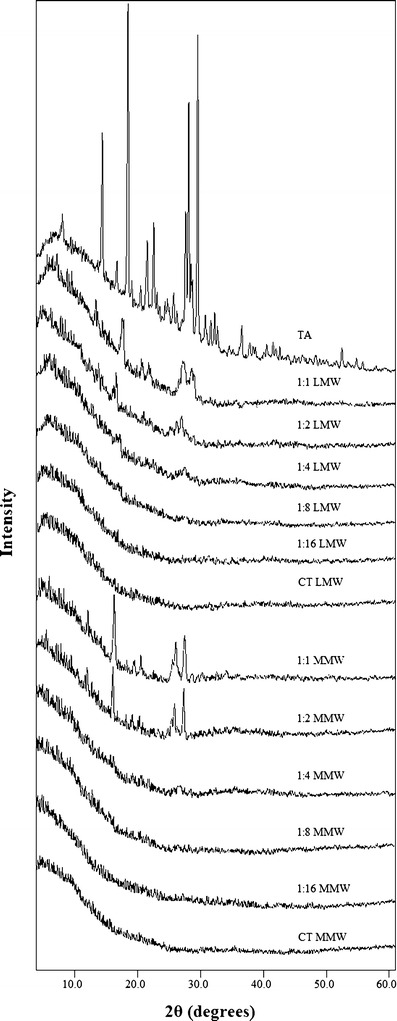
XRD patterns of TA, LMW CT, MMW CT and their freeze-dried samples (1:1–1:16)
DSC Studies
The thermal behaviour of TA in the pure and freeze-dried samples was studied through DSC. The melting peak of crystalline TA was observed at ∼214°C, which is close to the values stated in the literature (12,13,39) and in addition, the same region was also nearly consistent with the values of the freeze-dried samples (Table I). Figure 3 shows the DSC plots of pure TA and freeze-dried samples of LMW CT ratios from 1 to 16. No peak was observed for 1:4 and onwards drug–polymer ratios and similar pattern has also been observed in the case of MMW CT suggesting the conversion of crystalline TA into the amorphous form. The amorphicity of a drug can is usually characterized by a loss of the melting peak (26,40,41).
Table I.
Thermodynamic Parameters of Pure TA and Freeze-Dried TA–CT Samples at pH ∼5
| Type of sample | Temperature of melting (°C) | Peak area (mJ) | Enthalpy of melting (ΔH m) (J/g) | Degree of crystallinity (X c) (%) |
|---|---|---|---|---|
| Pure TA | 214.31 | 322.69 | 108.64 | 100 |
| LMW | ||||
| 1:1 | 214.72 | 82.24 | 27.41 | 25.23 |
| 1:2 | 214.54 | 26.84 | 8.94 | 8.23 |
| 1:4 | NPD | 0 | 0 | 0 |
| 1:8 | NPD | 0 | 0 | 0 |
| 1:16 | NPD | 0 | 0 | 0 |
| MMW | ||||
| 1:1 | 214.24 | 98.36 | 32.79 | 30.18 |
| 1:2 | 213.84 | 39.78 | 12.83 | 11.81 |
| 1:4 | NPD | 0 | 0 | 0 |
| 1:8 | NPD | 0 | 0 | 0 |
| 1:16 | NPD | 0 | 0 | 0 |
Values expressed as a mean of three to five determinations
Pure TA tolfenamic acid as purchased from the supplier, LMW low molecular weight chitosan, MMW medium molecular weight chitosan, NPD no peak detected
Fig. 3.
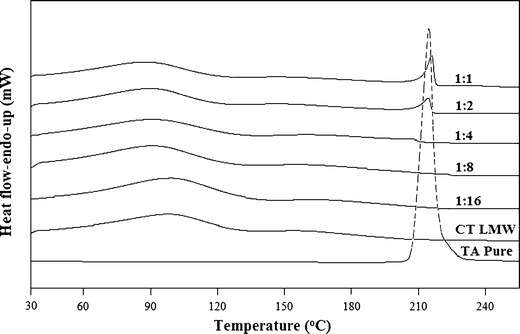
DSC plots of TA, LMW CT and their freeze-dried samples (1:1–1:16)
SEM Analysis
SEM was used to evaluate the effect of freeze-drying on the morphology of drug–polymer particles. The images showed pure TA (Fig. 4a) as large crystalline particles of irregular shape and size, whereas, small and homogenous amorphous particles in the case of pure LMW and MMW CT were observed (Fig. 4b and c). Both forms of the polymer formed a porous network after freeze-drying which was completely different from the original morphology of the raw materials (Fig. 4d and e). The presence of partially crystalline TA particles in the polymer matrix can be observed in the images of 1:1 ratio of TA–CT samples for both forms of the polymer (Fig. 4f and h). However, a complete change in the morphology of TA particles can be seen in the case of 1:4 complexes of both LMW and MMW CT, where the appearance of smooth reduced size particles indicate complete conversion of TA into its amorphous form (Fig. 4g and i).
Fig. 4.
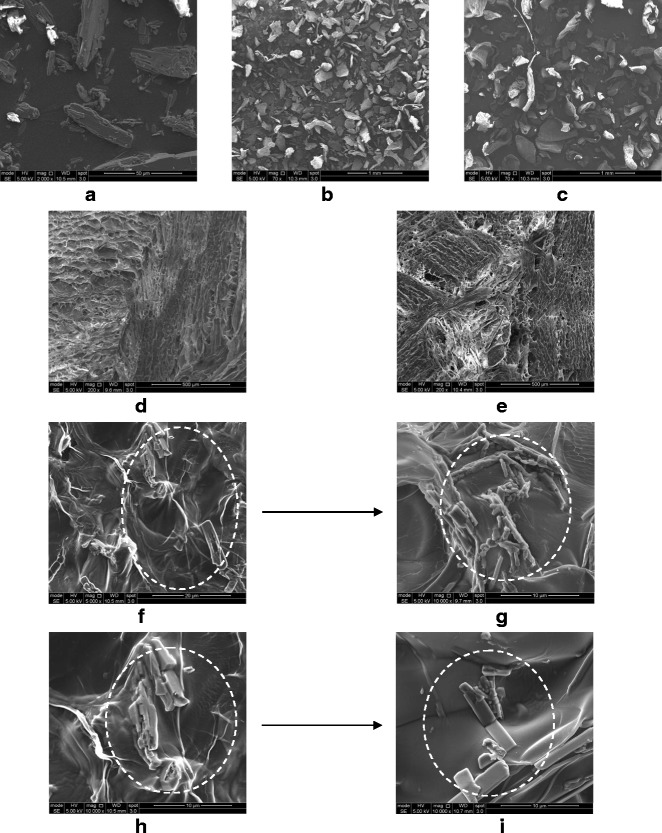
SEM images of a TA, b LMW CT, c MMW CT as purchased from the supplier; d freeze-dried LMW CT e freeze-dried MMW CT f 1:1 TA-LMW CT g 1:4 TA-LMW CT h 1:1 TA-MMW CT i 1:4 TA-MMW CT. The arrows are indicating the transformation in TA particles from partial crystalline to complete amorphous state
FTIR Studies
The FTIR spectra of the pure and freeze-dried samples of TA and CT, alone and in combination are shown in Fig. 5. In pure crystalline form, TA shows N–H stretching vibrations at around 3,342–3,340 cm−1 while one of its other polymorphic forms is reported to give the similar stretching vibrations at 3,324–3,315 cm−1. Therefore, the spectral features for the change in the crystalline forms of TA can be studied within the spectral range of 3,350–3,300 cm−1 (13,42,43). Our findings are also in agreement with other workers as N–H stretching band for TA either alone or in combination with CT after freeze-drying is observed at 3,340 cm−1 (Fig. 5). The effect of polymer concentration can also be noticed in the same region as with an increase in concentration there is a marked decrease in the stretching vibrations of N–H group of TA and no band has been observed from 1:4 and onwards ratios for both forms of the polymer (Fig. 5). The other specific absorption bands for pure TA could be observed at 1,661 cm−1 for the stretching vibrations of C═O of carboxylic moiety, 1,600–1,560 cm−1 for C–N stretching bands and ∼1,500 cm−1 for N–H bending vibrations.
Fig. 5.
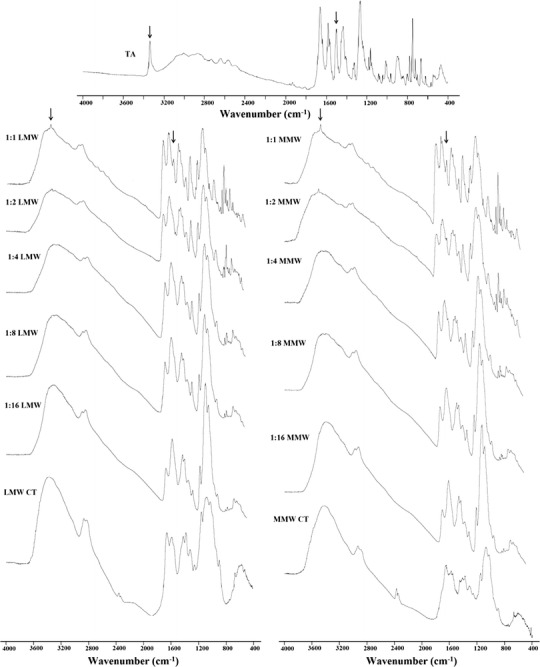
FTIR spectra of TA, LMW CT, MMW CT and their freeze-dried samples (1:1–1:16). The arrows indicate the NH-stretching vibration at the region 3,340 cm−1 and bending vibrations at around 1,500 cm−1 indicating intermolecular hydrogen bonding between TA and CT
Effect of pH
In order to observe the effect of pH on drug–polymer complexation, all the ratios for both forms of CT were further analyzed at pH ∼4 and ∼6. The samples at pH ∼5 showed complete conversion of TA into its amorphous form from 1:4 and onwards ratios. The characterization of the samples at pH ∼4 and ∼6 showed a marked effect of pH on the complexation of TA with CT. The samples adjusted to pH ∼6 exhibited a greater degree of complexation as no peak for TA was observed from 1:1 ratio and onwards for both LMW and MMW CT by XRD and DSC studies. In the case of samples adjusted to pH ∼4, complete absence of peaks from 1:8 and onwards ratios has been noted for both forms of CT thus indicating that an increase in pH value decreases the concentration of polymer required to convert crystalline TA into its amorphous form.
Recrystallization Studies of the Freeze-Dried Samples
The characterization of the samples showed no signs of changes during storage of 12 weeks in desiccator at room temperature thus indicating the formation of stable TA–CT complexes. Since in this study the 1:4 drug–polymer ratio at pH ∼5 has been found effective to completely transform crystalline TA into its amorphous form but no recrystallization in TA during cooling of the melt has been observed from 1:1 TA–CT ratios and onwards for both forms of the polymer (Fig. 6). These results indicate a formation of strong intermolecular hydrogen bonding between the drug and the polymer. Similarly no recrystallization during cooling of the melts has been observed for samples at around pH 4 and 6 from 1:1 ratios and onwards during the 12 weeks storage period.
Fig. 6.
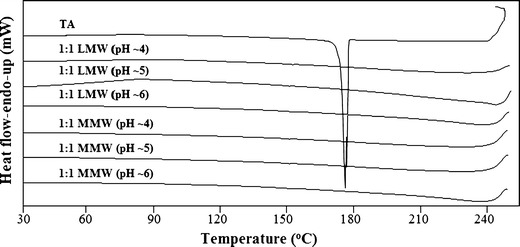
DSC plots showing cooling of the melts of pure TA and its freeze-dried samples with LMW and MMW CT at pH ∼4–6. The recrystallization peak in pure TA can be observed at ∼180°C whereas no recrystallization occurred during cooling in the presence of both forms of the polymer
The Tg of pure TA is reported to be 63°C (39). Our results showed a slight increase in the Tg of the drug–polymer blends with a midpoint value of 70 ± 2°C for both forms of CT at all studied pH values.
Effect of Polymer Molecular Weight
Although both forms of the polymer showed the same ratio to be effective in converting crystalline TA into the amorphous form but still the effect of molecular weight can be predicted by calculating the difference between the enthalpy of melting from the DSC plots (Table I). The estimation of the thermodynamic parameters and percent crystallinity of the samples was made by the following formula (41,44):
 |
where Xc is the degree of crystallinity of TA in the measured sample, ΔHm is the enthalpy of melting of the studied sample and ΔHm100% is the enthalpy of melting of pure crystalline material i.e. 100%.
DISCUSSION
Physical state properties of the pure TA and its freeze-dried complexes have been studied by employing XRD, DSC and SEM. The loss of crystalline drug peaks in the complexes by XRD (Fig. 2) and DSC (Fig. 3) indicates the transformation of the drug to its amorphous state. This decrease is consistent with increasing polymer concentration and no peak has been observed from 1:4 and onwards ratios for both forms of CT (Figs. 2 and 3). Previously, Gong et al. (26) reported the same ratio of CT to be effective in converting the crystalline indomethacin to its amorphous form. Similarly, in support of XRD and DSC results, the SEM images (Fig. 4) reveals a partial crystalline appearance for 1:1 and 1:2 TA–CT complexes. This could be due to the fact that around 70% of the drug is already being converted into the amorphous form which is also evident from the values of Xc of only 25.65 and 30.18% for LMW and MMW CT, respectively (Table I).
The complexation of a drug and a polyelectrolyte often produces several changes in their FTIR spectra as compared to the pure sample. These interactions may lead to the shifting or alteration of the band intensity and area of the corresponding vibrations of the pure materials (13,26). The structural study of TA reveals the fact that the two potential electron-accepting sites are present in TA, i.e. a hydrogen atom bonded to nitrogen atom and the other hydrogen, strongly acidic proton from COOH group (Fig. 1a). The polysaccharide structure of CT consists of copolymers of glucosamine and N-acetyl glucosamine contains electron-donating centres (CO group and the N–H from amino group) and therefore capable of forming hydrogen bond (Fig. 1b). The difference in the bands intensity with increasing polymer concentration in the region of 1,661 and ∼1,500 cm−1 (Fig. 5) suggests the involvement of H-atom from COOH and N–H group of TA to form hydrogen bonds with CT representing strong complex formation between the two moieties. However, a complete loss of the absorption bands at 3,340 and 1,500 cm−1 from 1:4 and onwards ratios for both forms of the polymer indicate complete transformation of crystalline TA to its amorphous form (Fig. 5). Such type of intermolecular hydrogen bonding between the drug and polymer leading to modifications in solid-state properties of drug is also reported by several other workers (13,18,45–47). The peaks at around 1,270 and 750 cm−1 are also characteristic bands for C–H and C–N deformation, respectively (43) but the reduction in their intensity is more a concentration rather than transformation effect as these can be observed for 1:4 and higher ratios in both forms of the polymer (Fig. 5). The FTIR data supports the results obtained from XRD, DSC and SEM thus confirming the conversion of crystalline TA into its amorphous state.
The complexation between TA and CT can further be explained on the basis of medium pH. A graph plotted between pH and CT ratios shows a slight curve relationship (Fig. 7) which could be interpreted on the basis of drug–polymer ionization and degree of complexation between TA and CT. It has been reported that TA complexation with the polymer is weaker in acidic pH particularly below its pKa value, i.e. 3.7–4.3 (22,23,48), probably due to the presence of a greater amount of non-ionized –COOH group. CT undergoes optimum complexation around its pKa of 6.2–6.5 (49,50). This could be due to the availability of free amino groups in CT to form a complex. An interesting phenomenon observed during the characterization of the complexes at pH ∼6 is the formation of a peak at 58°C that increases with the increasing polymer concentration (Fig. 8). This peak has been identified as the trihydrate form of sodium acetate due to its specific melting peak in DSC plots (27,51). Although the interaction of TA–CT to form amorphous TA is not affected, but trihydrate sodium acetate formation is only due to the excess amount of sodium hydroxide added to adjust the pH value at ∼6 (Fig. 8).
Fig. 7.
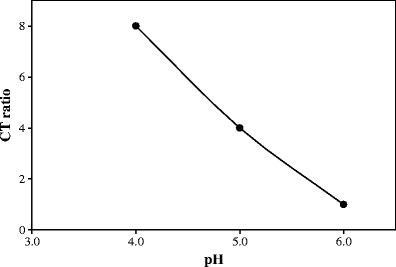
Plot of pH versus CT ratios for freeze-dried TA–CT samples. The points indicate the values that showed complete conversion of crystalline TA into its amorphous form after freeze-drying
Fig. 8.
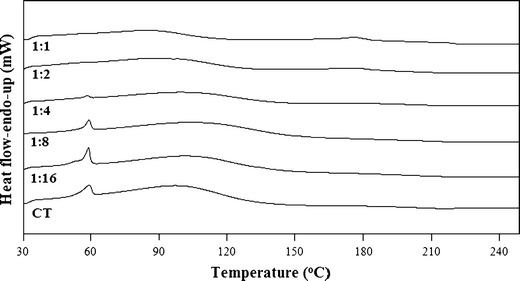
DSC plots of freeze-dried samples of TA with MMW CT at pH ∼6 showing the formation of sodium acetate trihydrate at 58°C
It is a known fact that some drugs, including TA, recrystallize upon cooling after melting (17,18,39). A classification system has been reported by Baird et al. (39) in which substances crystallizing during cooling of the melt are categorized as class I. On the other hand, polymers are known to inhibit recrystallization in drugs, which may occur during storage due to crystal growth and nucleation. The choice of suitable polymer to stabilize the drug against recrystallization depends not only on the amount of the polymer but also on the chemistry of the drug (13,18,47). Hence, the use of optimum amount of a polymer capable of forming hydrogen bond with the drug results in better stabilization with lesser chances of recrystallization (18,47). However, water or moisture absorption can break these bonds and the drug may recrystallize again (16–18). In this study, it has been found that the amount of CT required for the prevention of recrystallization of TA, during cooling of the melt, is much lower than the amount needed for complete amorphicity. No appearance of recrystallization peak during cooling of the melt from 1:1 ratios at all the studied pH values for both forms of CT indicates a strong complexation between TA and the polymer (Fig. 6). Moreover, polymers are also known to improve the stability of amorphous solid dispersions to crystallization by increasing their glass transition temperature (Tg) and storage of amorphous solids below the Tg usually improve their stability (13,16,18). The observed close range of Tg (70 ± 2°C) for all the studied samples indicate that the TA–CT complexes are miscible across the entire concentration range.
In addition to the pH of the medium and concentration of the polymer, the effect of its molecular weight was also studied. The values of ΔHm and Xc indicate that LMW is comparatively more effective than MMW CT in converting crystalline TA to the amorphous form (Table I). This may be due to the absence of any unbounded component of LMW CT in the complex. Similar results are reported by Volodko et al. (52) observing that LMW CT is more effective as compared to higher molecular weight polymer in the case of CT-carrageenan complex. This effect can also be seen in the XRD patterns (Fig. 2) where a marked difference in the peak height of TA in 1:1 and 1:2 ratios can be observed, thus proving LMW CT to be more effective for complexation.
CONCLUSIONS
The initial characterization of the samples by XRD, DSC and SEM confirms the conversion of crystalline TA into its amorphous form from 1:4 and onwards ratios for both forms of the polymer. The results obtained by all these techniques support and complement each other on the amorphous nature of the active drug. The presence of TA on the surface of the complex is clearly visible in the SEM images. Similarly, the molecular interaction between the two entities is confirmed by FTIR, which shows some major peaks of TA in all the complexes that are not present in pure CT as well as formation of hydrogen bonding between the drug–polymer complexes. In addition, a pronounced pH effect on the complexation process revealed that the probability of drug ionization and complexation is markedly increased at a pH value (∼6) above its pKa of 3.7–4.3. Similarly, the effect of molecular weight is also noted for CT as LMW form was comparatively more effective than MMW in converting crystalline TA to the amorphous form as observed by the difference in enthalpy of melting calculated from DSC plots. Furthermore, recrystallization of freeze-dried samples during cooling of the melt was not observed for ratios of 1:1 and above for all the pH values studied indicating a formation of strong intermolecular hydrogen bonding between the drug and the polymer.
This study highlights the effect of pH of the medium, molecular weight and optimum concentration of the polymer that may help to prepare stable formulations with amorphous tolfenamic acid since no dosage form other than tablet is currently available for clinical use. This change in the solid-state properties of the drug is of enormous value as it will help in the clinical management of a number of disease conditions, including cancer.
ACKNOWLEDGMENTS
The authors are highly grateful to Mr. Paul Bennett and Mr. Chris Truman of Centre for Food Innovation, Sheffield Hallam University for providing the freeze-drying facilities. The authors are also thankful to Ms. Beverly Lane, Ms. Joanna, Dr. Nik Reeves-McLaren and Dr. Le Ma for providing analytical facilities.
Conflicts of Interest
The authors declare no conflicts of interest.
REFERENCES
- 1.British National Formulary 57. London: BMJ and RPS; 2009. p. 244.
- 2.Sweetman SC. Martindale: the complete drug reference. 36. London: Pharmaceutical Press; 2009. [Google Scholar]
- 3.Liu X, Abdelrahim M, Abudayyeh A, Lei P, Safe S. The nonsteroidal anti-inflammatory drug tolfenamic acid inhibits BT474 and SKBR3 breast cancer cell and tumor growth by repressing erbB2 expression. Mol Cancer Ther. 2009;8:1207–1217. doi: 10.1158/1535-7163.MCT-08-1097. [DOI] [PMC free article] [PubMed] [Google Scholar]
- 4.Kim JH, Jung JY, Shim JH, Kim J, Choi KH, Shin JA, et al. Apoptotic effect of tolfenamic acid in kb human oral cancer cells: possible involvement of the p38 MAPK pathway. J Clin Biochem Nutr. 2010;47:74–80. doi: 10.3164/jcbn.10-02. [DOI] [PMC free article] [PubMed] [Google Scholar]
- 5.Colon J, Basha MR, Madero-Visbal R, Konduri S, Baker CH, Herrera LJ, et al. Tolfenamic acid decreases c-Met expression through Sp proteins degradation and inhibits lung cancer cells growth and tumor formation in orthotopic mice. Investig New Drugs. 2011;29:41–51. doi: 10.1007/s10637-009-9331-8. [DOI] [PubMed] [Google Scholar]
- 6.Eslin D, Sankpal UT, Lee C, Sutphin RM, Maliakal P, Currier E, et al. Tolfenamic acid inhibits neuroblastoma cell proliferation and induces apoptosis: A novel therapeutic agent for neuroblastoma. Mol Carcinog. 2013;52:377–386. doi: 10.1002/mc.21866. [DOI] [PubMed] [Google Scholar]
- 7.Shim JH, Shin JA, Jung JY, Choi KH, Choi ES, Cho NP, et al. Chemopreventive effect of tolfenamic acid on KB human cervical cancer cells and tumor xenograft by downregulating specificity protein 1. Eur J Cancer Prev. 2011;20:102–111. doi: 10.1097/CEJ.0b013e328341e38f. [DOI] [PubMed] [Google Scholar]
- 8.Kang SU, Shin YS, Hwang HS, Baek SJ, Lee SH, Kim CH. Tolfenamic acid induces apoptosis and growth inhibition in head and neck cancer: involvement of NAG-1 expression. PLoS One. 2012;7:e34988. doi: 10.1371/journal.pone.0034988. [DOI] [PMC free article] [PubMed] [Google Scholar]
- 9.Adwan LI, Basha R, Abdelrahim M, Subaiea GM, Zawia NH. Tolfenamic acid interrupts the de novo synthesis of the β-amyloid precursor protein and lowers amyloid beta via a transcriptional pathway. Curr Alzheimer Res. 2011;8:385–392. doi: 10.2174/156720511795745285. [DOI] [PubMed] [Google Scholar]
- 10.Subaiea GM, Alansi BH, Serra DA, Alwan M, Zawia NH. The ability of tolfenamic acid to penetrate the brain: a model for testing the brain disposition of candidate Alzheimer’s drugs using multiple platforms. Curr Alzheimer Res. 2011;8:860–867. doi: 10.2174/156720511798192691. [DOI] [PubMed] [Google Scholar]
- 11.Andrews PC, Ferrero RL, Junk PC, Kumar I, Luu Q, Nguyen K, et al. Bismuth(III) complexes derived from non-steroidal anti-inflammatory drugs and their activity against Helicobacter pylori. Dalton Trans. 2010;39:2861–2868. doi: 10.1039/c000164c. [DOI] [PubMed] [Google Scholar]
- 12.British Pharmacopoeia. London: Her Majesty’s Stationary Office; 2009. Electronic version.
- 13.Thybo P, Kristensen J, Hovgaard L. Characterization and physical stability of tolfenamic acid-PVP K30 solid dispersions. Pharm Dev Technol. 2007;12:43–53. doi: 10.1080/10837450601166577. [DOI] [PubMed] [Google Scholar]
- 14.Cafaggi S, Russo E, Caviglioli G, Parodi B, Stefani R, Sillo G, et al. Poloxamer 407 as a solubilising agent for tolfenamic acid and as a base for a gel formulation. Eur J Pharm Sci. 2008;35:19–29. doi: 10.1016/j.ejps.2008.05.010. [DOI] [PubMed] [Google Scholar]
- 15.Pedersen SB. Biopharmaceutical aspects of tolfenamic acid. Pharmacol Toxicol. 1994;75:22–32. doi: 10.1111/j.1600-0773.1994.tb01992.x. [DOI] [PubMed] [Google Scholar]
- 16.Jondhale S, Bhise S, Pore Y. Physicochemical investigations and stability studies of amorphous gliclazide. AAPS PharmSciTech. 2012;13:448–459. doi: 10.1208/s12249-012-9760-0. [DOI] [PMC free article] [PubMed] [Google Scholar]
- 17.Hancock BC, Zografi G. Characteristics and significance of the amorphous state in pharmaceutical systems. J Pharm Sci. 1997;86:1–12. doi: 10.1021/js9601896. [DOI] [PubMed] [Google Scholar]
- 18.Trasi NS, Taylor LS. Effect of polymers on nucleation and crystal growth of amorphous acetaminophen. CrstEngComm. 2012;14:5188–5197. doi: 10.1039/c2ce25374g. [DOI] [Google Scholar]
- 19.Ahmad I, Ahmed S, Sheraz MA, Vaid FHM. Effect of borate buffer on the photolysis of riboflavin in aqueous solution. J Photochem Photobiol B Biol. 2008;93:82–87. doi: 10.1016/j.jphotobiol.2008.07.005. [DOI] [PubMed] [Google Scholar]
- 20.Ahmad I, Ahmed S, Sheraz MA, Aminuddin M, Vaid FHM. Effect of caffeine complexation on the photolysis of riboflavin in aqueous solution: a kinetic study. Chem Pharm Bull. 2009;57:1363–1370. doi: 10.1248/cpb.57.1363. [DOI] [PubMed] [Google Scholar]
- 21.Ahmad I, Ahmed S, Sheraz MA, Vaid FH, Ansari IA. Effect of divalent anions on photodegradation kinetics and pathways of riboflavin in aqueous solution. Int J Pharm. 2010;390:174–182. doi: 10.1016/j.ijpharm.2010.01.042. [DOI] [PubMed] [Google Scholar]
- 22.Rozou S, Antoniadou-Vyza E. An improved HPLC method overcoming Beer’s law deviations arising from supramolecular interactions in tolfenamic acid and cyclodextrins complexes. J Pharm Biomed Anal. 1998;18:899–905. doi: 10.1016/S0731-7085(98)00227-1. [DOI] [PubMed] [Google Scholar]
- 23.Rozou S, Michaleas S, Antoniadou-Vyza E. Supramolecular interactions between tolfenamic acid and various cyclodextrins: effects of complexation on physicochemical and spectroscopic data. Pharm Pharmacol Commun. 1999;5:79–84. doi: 10.1211/146080899128734497. [DOI] [Google Scholar]
- 24.Vavia PR, Adhage NA. Freeze-dried inclusion complexes of tolfenamic acid with β-cyclodextrins. Pharm Dev Technol. 2000;5:571–574. doi: 10.1081/PDT-100102040. [DOI] [PubMed] [Google Scholar]
- 25.Sinha VR, Singla AK, Wadhawan S, Kaushik R, Kumria R, Bansal K, et al. Chitosan microspheres as a potential carrier for drugs. Int J Pharm. 2004;274:1–33. doi: 10.1016/j.ijpharm.2003.12.026. [DOI] [PubMed] [Google Scholar]
- 26.Gong K, Darr JA, Rehman IU. Supercritical fluid assisted impregnation of indomethacin into chitosan thermosets for controlled release applications. Int J Pharm. 2006;315:93–98. doi: 10.1016/j.ijpharm.2006.02.030. [DOI] [PubMed] [Google Scholar]
- 27.Rowe RC, Sheskey PJ, Quinn ME. Handbook of pharmaceutical excipients. 4. London: Pharmaceutical Press; 2009. pp. 159–161. [Google Scholar]
- 28.Chandy T, Sharma CP. Chitosan—as a biomaterial. Biomater Artif Cells Artif Organs. 1990;18:1–24. doi: 10.3109/10731199009117286. [DOI] [PubMed] [Google Scholar]
- 29.Chandy T, Das GS, Rao GH. 5-Fluorouracil-loaded chitosan coated polylactic acid microspheres as biodegradable drug carriers for cerebral tumours. J Microencapsul. 2000;17:625–638. doi: 10.1080/026520400417676. [DOI] [PubMed] [Google Scholar]
- 30.Chandy T, Rao GH, Wilson RF, Das GS. Development of poly(lactic acid)/chitosan co-matrix microspheres: controlled release of taxol–heparin for preventing restenosis. Drug Deliv. 2001;8:77–86. doi: 10.1080/107175401750177025. [DOI] [PubMed] [Google Scholar]
- 31.Aggarwal A, Kaur S, Tiwary AK, Gupta S. Chitosan microspheres prepared by an aqueous process: release of indomethacin. J Microencapsul. 2001;18:819–823. doi: 10.1080/02652040110065495. [DOI] [PubMed] [Google Scholar]
- 32.Gonzalez-Rodriguez ML, Holgado MA, Sanchez-Lafuente C, Rabasco AM, Fini A. Alginate/chitosan particulate systems for sodium diclofenac release. Int J Pharm. 2002;232:225–234. doi: 10.1016/S0378-5173(01)00915-2. [DOI] [PubMed] [Google Scholar]
- 33.Kumbar SG, Kulkarni AR, Aminabhavi M. Crosslinked chitosan microspheres for encapsulation of diclofenac sodium: effect of crosslinking agent. J Microencapsul. 2002;19:173–180. doi: 10.1080/02652040110065422. [DOI] [PubMed] [Google Scholar]
- 34.al-Suwayeh SA, el-Helw AR, al-Mesned AF, Bayomi MA, el-Gorashi AS. In vitro–in vivo evaluation of tableted caseinchitosan microspheres containing diltiazem hydrochloride. Boll Chim Farm. 2003;142:14–20. [PubMed] [Google Scholar]
- 35.Hejazi R, Amiji M. Stomach-specific anti-H. pylori therapy. II. Gastric residence studies of tetracycline-loaded chitosan microspheres in gerbils. Pharm Dev Technol. 2003;8:253–262. doi: 10.1081/PDT-120022154. [DOI] [PubMed] [Google Scholar]
- 36.Wong TW, Chan LW, Kho SB, Sia Heng PW. Design of controlled-release solid dosage forms of alginate and chitosan using microwave. J Control Release. 2002;84:99–114. doi: 10.1016/S0168-3659(02)00237-7. [DOI] [PubMed] [Google Scholar]
- 37.Huang Y, Yeh MK, Chiang CH. Formulation factors in preparing BTM–chitosan microspheres by spray drying method. Int J Pharm. 2002;242:239–242. doi: 10.1016/S0378-5173(02)00164-3. [DOI] [PubMed] [Google Scholar]
- 38.Huang YC, Yeh MK, Cheng SN, Chiang CH. The characteristics of betamethasone-loaded chitosan microparticles by spray-drying method. J Microencapsul. 2003;20:459–472. doi: 10.1080/0265204021000058456. [DOI] [PubMed] [Google Scholar]
- 39.Baird JA, Van Eerdenbrugh B, Taylor LS. A classification system to assess the crystallization tendency of organic molecules from undercooled melts. J Pharm Sci. 2010;99:3787–3806. doi: 10.1002/jps.21808. [DOI] [PubMed] [Google Scholar]
- 40.Gong K, Braden M, Patel MP, Rehman IU, Zhang Z, Darr JA. Controlled release of chlorhexidine diacetate from a porous methacrylate system: supercritical fluid assisted foaming and impregnation. J Pharm Sci. 2007;96:2048–2056. doi: 10.1002/jps.20850. [DOI] [PubMed] [Google Scholar]
- 41.Gong K, Rehman IU, Darr JA. Characterization and drug release investigation of amorphous drug-hydroxypropyl methylcellulose composites made via supercritical carbon dioxide assisted impregnation. J Pharm Biomed Anal. 2008;48:1112–1119. doi: 10.1016/j.jpba.2008.08.031. [DOI] [PubMed] [Google Scholar]
- 42.Gilpin RK, Zhou W. Infrared studies of the polymorphic states of the fenamates. J Pharm Biomed Anal. 2005;37:509–515. doi: 10.1016/j.jpba.2004.11.009. [DOI] [PubMed] [Google Scholar]
- 43.Jabeen S, Dines TJ, Leharne SA, Chowdhry BZ. Raman and IR spectroscopic studies of fenamates—conformational differences in polymorphs of flufenamic acid, mefenamic acid and tolfenamic acid. Spectrochim Acta A Mol Biomol Spectrosc. 2012;96:972–985. doi: 10.1016/j.saa.2012.07.129. [DOI] [PubMed] [Google Scholar]
- 44.Shah B, Kakumanu VK, Bansal AK. Analytical techniques for quantification of amorphous/crystalline phases in pharmaceutical solids. J Pharm Sci. 2006;95:1641–1665. doi: 10.1002/jps.20644. [DOI] [PubMed] [Google Scholar]
- 45.Doherty C, York P. Evidence for solid-state and liquid-state interactions in a furosemide polyvinylpyrrolidone solid dispersion. J Pharm Sci. 1987;76:731–737. doi: 10.1002/jps.2600760912. [DOI] [PubMed] [Google Scholar]
- 46.Damian F, Blaton N, Desseyn H, Clou K, Augustijns P, Naesens L, et al. Solid state properties of pure UC-781 and solid dispersions with polyvinylpyrrolidone (PVP K30) J Pharm Pharmacol. 2001;53:1109–1116. doi: 10.1211/0022357011776496. [DOI] [PubMed] [Google Scholar]
- 47.Kestur US, Van Eerdenbrugh B, Taylor LS. Influence of polymer chemistry on crystal growth inhibition of two chemically diverse organic molecules. CrsytEngComm. 2011;13:6712–6718. doi: 10.1039/c1ce05822c. [DOI] [Google Scholar]
- 48.Bergström CA, Wassvik CM, Johansson K, Hubatsch I. Poorly soluble marketed drugs display solvation limited solubility. J Med Chem. 2007;50:5858–5862. doi: 10.1021/jm0706416. [DOI] [PubMed] [Google Scholar]
- 49.Sato T, Ishii T, Okahata Y. In vitro gene delivery mediated by chitosan. Effect of pH, serum, and molecular mass of chitosan on the transfection efficiency. Biomaterials. 2001;22:2075–2080. doi: 10.1016/S0142-9612(00)00385-9. [DOI] [PubMed] [Google Scholar]
- 50.Kean T, Roth S, Thanou M. Trimethylated chitosans as non-viral gene delivery vectors: cytotoxicity and transfection efficiency. J Control Release. 2005;103:643–653. doi: 10.1016/j.jconrel.2005.01.001. [DOI] [PubMed] [Google Scholar]
- 51.O’Neil MJ. The Merck index. 13. Rahway: Merck; 2001. [Google Scholar]
- 52.Volodko AV, Davydova VN, Barabanova AO, Soloveva TF, Ermak IM. Formation of soluble chitosan–carrageenan polyelectrolyte complexes. Chem Nat Compd. 2012;48:353–357. doi: 10.1007/s10600-012-0250-0. [DOI] [Google Scholar]


