

Abstract
Etodolac is a non-steroidal anti-inflammatory drug having an elimination half-life of 7 h; oral doses are given every 6–8 h. The aim of current work was the development of controlled-release etodolac lipid matrix tablets. The variables influencing design of these tablets (L1–L28) by the hot fusion method were investigated including; (1) lipid type (stearic acid, cetyl alcohol, cetostearyl alcohol, Imwitor® 900K, Precirol® ATO 5 and Compritol® ATO 888), (2) drug/lipid ratio (1:0.25 and 1:0.50, respectively), (3) filler type (lactose, Avicel® PH101 and their physical mixtures; 2:1, 1:1, and 1:2, respectively), (4) surfactant’s HLB (5 and 11), and (5) drug/surfactant ratio (20:1 and 10:1, respectively). Statistical analysis and kinetic modeling of drug release data were evaluated. The inner matrix of the tablet was visualized via scanning electron microscopy (SEM). An inverse correlation was observed between the drug/lipid ratio and the drug release rate. Precirol®- and Compritol®-containing formulae showed more retarded drug release rates. Lactose/Avicel® physical mixture (1:1) was considered as a filler of choice where it minimized the burst effect observed with Avicel®-free formulae. The higher surfactant’s HLB, the higher drug release rate. The similarity factor (f2) between the drug release profiles revealed similarity within the investigated drug/surfactant ratios. Sucrose stearate D1805®-based matrix (L21) succeeded in delivering more than 90% of etodolac over 12 h, following anomalous (non-Fickian) controlled-release kinetics. SEM micrographs confirmed pore formation, within the latter matrix, upon contact with dissolution medium.
Key words: anti-inflammatory, controlled release, etodolac, hot fusion method, lipid matrix tablets, Precirol® ATO 5, sucrose stearate, surfactant, sustained release
INTRODUCTION
Lipid matrix dosage forms are commonly employed to load drugs into inert lipophilic matrices. Many types of these matrices were recently investigated to obtain effective sustained-release drug systems, including solid lipid nanoparticles (1), extruded solid lipid matrices (2), nanostructured lipid carriers (3), liquid crystalline nanoparticles (4), lipid microspheres (5), melt-extruded helical waxy matrices (6), and lipid matrix tablets (7).
The solid dispersion coating technique using waxy-retarded materials is commonly adopted to control the rate of drug release. In these systems, the active ingredient is uniformly distributed throughout the matrix and is released at a controlled rate through the pores formed within the matrix. Consequently, there is no danger of drug dumping that might be observed with accidental rupture of the membrane of other sustained-release coated systems (8). As reported, the chemical inertness, the ease of preparation, the minimal influence by food content in the gastrointestinal tract, the low production costs and the good stability at various pH values and moisture levels are considered as other advantages of these lipid or waxy matrices (9,10).
Six waxy-lipid materials were investigated in the current work including; stearic acid, cetyl alcohol, cetostearyl alcohol, Imwitor® 900K, Compritol® ATO 888 and Precirol® ATO 5. Imwitor® 900K (glyceryl monostearate) contains 40–50% of monoglycerides of stearic acid (11). This waxy retardant material was used to tailor various sustained-release matrices including; matrix tablets (12), pellets (13), microspheres (14), and cylindrical implants (15). Compritol® ATO 888 (Glyceryl behenate) is a mixture of mono-, di- and triglycerides of behanic acid (11). It is commonly used as a hot-melt coating agent to prolong the release of many drugs like theophylline (16) and sodium ferulate (17). Precirol® ATO 5 (glyceryl palmitostearate) is a mixture of mono-, di- and triglycerides of palmitic and stearic acids. Like the former waxy retardants, this wax was investigated in the development of many controlled-release systems like solid lipid nanoparticles (18), matrix tablets (19), and pellets (20).
Sucrose stearate is a non-ionic surfactant having a sugar substituent (sucrose) as the polar head group and stearic acid as the non-polar tail group. Members of the sugar esters group are used in the modern pharmaceutical technology as emulsifiers, solubilizing agents, lubricants, penetrating enhancers, and pore forming agents (21) because they have low toxicity, high biocompatibility, and excellent biodegradability (22).
Etodolac is a non-steroidal anti-inflammatory drug that acts by preferential inhibition of cyclo-oxygenase-2 enzyme. It has an elimination half-life of 7 h and the oral doses (200–400 mg) are given every 6–8 h (23). Consequently, sustained-release preparations of etodolac are desirable to maintain the drug-plasma concentrations within the therapeutic range, ensure the desired drug concentration at the absorption sites and reduce dosing frequency (24).
To date, many research works were conducted using various lipid-retardant materials to modulate the rate of drug release from the developed lipid matrix tablets. In the current work, the use of sucrose stearate as a highly biocompatible and biodegradable non-ionic surfactant was explored as an extra tool to tailor the rate of drug release from the resulting surfactant-enriched lipid matrix tablets. The process variables influencing the design and optimization of these matrices by the hot fusion method were investigated including; the lipid type, the drug/lipid ratio, the filler type, the sucrose stearate’s hydrophilic lipophilic balance (HLB) value and finally the drug/sucrose stearate ratio. The diffusional modeling of the drug release data was evaluated using various kinetic models. The structural characteristics of the inner matrices were visualized via scanning electron microscopy under different magnification powers.
MATERIALS AND METHODS
Materials
Etodolac powder and Napilac® capsules were kindly provided by Global Napi Pharmaceuticals (GNP) (6th of October City, Egypt). Glyceryl behenate (Compritol® ATO 888) and glyceryl palmitostearate (Precirol® ATO 5) were donated by Gattefossé (Saint Priest, France). Glyceryl monostearate (Imwitor® 900K) was from Fluka Biochemika (St. Louis, MO, USA). Sucrose stearate d-1805® (HLB 5) and sucrose stearate D-1811® (HLB 11) were obtained from Mitsubishi-Kagaku Foods Co. (Tokyo, Japan). Microcrystalline cellulose (Avicel® PH101) was provided by FMC Corporation (Philadelphia, USA). Lactose was supplied by Meggle GmbH (Wasserburg, Germany). Potassium dihydrogen phosphate and disodium hydrogen phosphate were provided by Merck (Darmstadt, Germany). Stearic acid, cetyl alcohol and cetostearyl alcohol, talc and magnesium stearate were purchased from El-Nasr pharmaceutical chemicals Co. (Abu Zaabal, Egypt). Other chemicals (analytical grade) were used as received.
Preparation of Etodolac/Lipid Dispersions
Etodolac/lipid solid dispersions were prepared by the hot fusion method (17). Briefly, the lipids (stearic acid, cetyl alcohol, cetostearyl alcohol, Imwitor® 900K, Precirol® ATO 5 and Compritol® ATO 888) were individually melted, in porcelain dishes, on a water bath at 75°C. Etodolac was added to the melted lipids with continuous stirring till homogenous dispersions were obtained. Drug-loaded melt dispersions (1:0.25 and 1:0.5, respectively) were allowed to cool down and solidify at room temperature (25 ± 0.5°C). Subsequently, the mass was ground, pulverized and passed through a 60-mesh sieve (<300 μm). The resulting lipid dispersions were stored in a desiccator at room temperature until use.
Characterization of Etodolac Lipid Dispersions
Differential Scanning Calorimetry Studies
Three milligram samples of etodolac, lipid, etodolac/lipid physical mixtures (1:0.25 or 1:0.50) and etodolac lipid dispersions were heated (20 to 200°C) in hermetically sealed aluminum pans at a constant rate of 10°C/min under a nitrogen purge at a rate of 25 ml/min. The differential scanning calorimetry (DSC) thermograms of the investigated samples were recorded on a differential scanning calorimeter (DSC-60, Shimadzu, Kyoto, Japan).
X-Ray Diffraction Studies
The X-ray spectra of the powdered samples (etodolac, lipid, etodolac/lipid physical mixtures (1:0.25 or 1:0.50) and etodolac lipid dispersions) were recorded on an X-ray diffractometer (PANalytical Empyrean, Almelo, The Netherlands) using Ni-filtered CuKα radiation at a λ of 1.542 Å. The accelerating potential was set at 45 kV while the tube current was adjusted at 30 mA. The process was operated in the continuous scanning speed over a 2θ range of 4° to 50°.
The X-ray diffraction (XRD) studies are based on Bragg’s law (Eq. 1) which relates the wavelength of the incident X-ray beam (λ) to the incidence angle (θ) as well as the interatomic distance (d) (25).
 |
1 |
The installed software solves the equation; gives the d-spacing between the crystal lattice planes of atoms. This would enable elucidation of the crystal structure.
Preparation of Etodolac Lipid Matrix Tablets
Etodolac–lipid solid dispersions were mixed with lactose (filler) for 10 min in a mortar. The obtained mixtures were mixed with talc and magnesium stearate for another 3 min. Finally, 400 mg of each mixture was weighed and fed manually into the die of a single punch tablet press machine (Royal artist, Bombay, India) equipped with flat-faced punches (10 mm) to produce the desired lipid matrix tablets; formulae L1–L12. The hardness and the thickness values were adjusted at 10 ± 0.5 kg/cm2 and 2 mm, respectively.
In order to study the effect of the filler type, other formulae (L13–L20) were prepared using Avicel® PH101 alone or lactose/Avicel® PH101 physical mixtures (2:1, 1:1, and 1:2, respectively).
The influence of the surfactant’s HLB and the drug/surfactant ratio on the drug release from the promising lipid matrix tablets was investigated on other solid dispersions (formulae L21–L28) prepared using sucrose stearate D-1805® (HLB 5) and sucrose stearate D-1811® (HLB 11). The investigated drug/surfactant ratios were 20:1 and 10:1, respectively. The surfactant was added, following the incorporation of etodolac into the melted lipids, with continuous stirring. The content of etodolac, 200 mg, was fixed in all formulae (Table I).
Table I.
The Composition, in milligrams, of the Investigated Etodolac Lipid Matrix Tablets (400 mg)
| Form. code a | Stearic acid | Cetyl alcohol | Cetostearyl alcohol | Imwitor® 900K | Precirol® ATO 5 | Compritol® ATO 888 | Lactose | Avicel® PH 101 | Sucrose stearate D-1805® | Sucrose stearate D-1811® |
|---|---|---|---|---|---|---|---|---|---|---|
| L1 | 50 | 142 | ||||||||
| L2 | 50 | 142 | ||||||||
| L3 | 50 | 142 | ||||||||
| L4 | 50 | 142 | ||||||||
| L5 | 50 | 142 | ||||||||
| L6 | 50 | 142 | ||||||||
| L7 | 100 | 92 | ||||||||
| L8 | 100 | 92 | ||||||||
| L9 | 100 | 92 | ||||||||
| L10 | 100 | 92 | ||||||||
| L11 | 100 | 92 | ||||||||
| L12 | 100 | 92 | ||||||||
| L13 | 50 | 94.7 | 47.3 | |||||||
| L14 | 50 | 71 | 71 | |||||||
| L15 | 50 | 47.3 | 94.7 | |||||||
| L16 | 50 | 142 | ||||||||
| L17 | 50 | 94.7 | 47.3 | |||||||
| L18 | 50 | 71 | 71 | |||||||
| L19 | 50 | 47.3 | 94.7 | |||||||
| L20 | 50 | 142 | ||||||||
| L21 | 50 | 66 | 66 | 10 | ||||||
| L22 | 50 | 61 | 61 | 20 | ||||||
| L23 | 50 | 66 | 66 | 10 | ||||||
| L24 | 50 | 61 | 61 | 20 | ||||||
| L25 | 50 | 66 | 66 | 10 | ||||||
| L26 | 50 | 61 | 61 | 20 | ||||||
| L27 | 50 | 66 | 66 | 10 | ||||||
| L28 | 50 | 61 | 61 | 20 |
aEach formula contained etodolac (200 mg), talc (4 mg) and magnesium stearate (4 mg)
Characterization of Etodolac Lipid Matrix Tablets
Physicochemical Characterization of the Tablets
Random tablets were selected from each batch and subjected to the following physicochemical tests including determination of tablet weight variation, thickness, drug content uniformity and friability percentage.
For the determination of tablet weight variation, 20 tablets were dedusted, individually weighed (Sartorius GmbH, Gottingen, Germany) and the mean weight (±S.D.) was calculated. For estimation of tablet thickness, ten tablets were dedusted, individually placed between the calipers of a micrometer using forceps and the mean thickness (± S.D.) was determined. The drug content uniformity within tablets was determined spectrophotometrically (1601-PC Double beam spectrometer, Shimadzu, Kyoto, Japan) at a wavelength of 278 nm. A random sample of ten tablets was selected and individually powdered in a mortar. Each powder was subsequently extracted in 100 ml of Sorensen’s phosphate buffer (pH 7.4) with continuous shaking, at 37°C, on a shaker water bath for 12 h. The solution was filtered and the drug content was determined after appropriate dilution. The results are expressed as mean values (±S.D.) of ten tablets (24). According to BP specifications (26), the tablet friability test was conducted on 16 tablets (a sample corresponding to as nearly as possible to 6.5 g) using a Roche-type friabilator (FAB-2, Logan Instruments Corp., NJ, USA). The loss in weight (%) was calculated relative to the original weight.
Drug Release Studies
The in vitro release studies of etodolac from the prepared lipid matrix tablets (formulae L1–L28) as well as the available immediate release market product, Napilac® 200 mg capsules (GNP, 6th of October City, Egypt) were conducted, in triplicates, in a USP Dissolution Tester Apparatus, Type-I (VK 7000 Dissolution Testing Station, Vankel Industries, Inc., NJ, USA).
According to the BP specifications for etodolac (26), the tablets were kept within the rotating baskets (100 rpm) in Sorensen’s phosphate buffer (900 mL, pH 7.4) at 37 ± 0.5°C. Aliquots (5 mL) were withdrawn from the dissolution apparatus at specific time intervals (0.5, 1, 2, 3, 4, 6, 8, 10 and 12 h) and the drug content was determined spectrophotometrically at 278 nm after filtration through a cellulose acetate membrane, 0.45 μm. An equivalent volume of fresh medium was replaced at each time of withdrawal. The results were expressed as mean values (±S.D.) of drug released percentages at the aforementioned time intervals. The percentages of the drug released in the first hour (Q1h) and the time required for 50% drug release from each formula (T50%) were estimated. The results were statistically analyzed (SPSS 14.0, SPSS Inc., Chicago, USA) using one-way ANOVA test. Post hoc multiple comparisons were carried out using the least square difference test at P < 0.05.
In order to investigate the influence of the surfactant’s HLB (5 “low level” and 11“high level”) and the drug/surfactant ratio (20: 1 “lower level” and 10: 1 “higher level”, respectively) on the lipid matrices, the in vitro drug release profiles of the resulting surfactant-enriched lipid matrices were mathematically compared using the similarity factor (f2) according to Eq. 2;
 |
2 |
where, W is the sum of squares of differences in the cumulative percent dissolved between the lower level and the higher level and n is the number of sampling times till a drug released % of ≤85%. If f2 value lies between 50 and 100, the two dissolution profiles are considered to be similar (27).
Diffusional Modeling of the Drug Release Data
The resulting drug release profiles were fitted to first-order, zero-order and Korsmeyer–Peppas (28) equation (Eq. 3) to determine the model having the highest correlation coefficient.
 |
3 |
Where, (Mt/M∞) is an estimate of the drug dissolved fraction at time t, k is a constant related to the geometric and structural characteristics of matrix, and n is the drug release exponent. The log value of the drug dissolved fraction was plotted against log time (Eq. 4) to determine the drug release exponent.
 |
4 |
The n has the limiting value of 0.45 for diffusion (Fickian) controlled release, n values falling between 0.45 and 0.89 are correlated to anomalous (non-Fickian) controlled release. The non-Fickian kinetics corresponds to coupled polymer diffusion/relaxation (12,29). Values greater than 0.89 correspond to relaxation (Case II transport) controlled release.
Scanning Electron Microscopy
Scanning electron microscopy (SEM) micrographs of cross-sections of the best achieved formula (L21) were taken before and after the drug release studies to elucidate the influence of the dissolution medium on the microstructure of the tablet matrix. Briefly, cross-sections were taken from the tablet, fixed on a SEM sample holder and coated with a gold layer (150 Å) for 2 min using a sputter coater (Edwards S-150A, England). Finally, the gold-coated samples were examined under a scanning electron microscope (Jeol JSM T20, Tokyo, Japan) at different magnification powers (24).
RESULTS AND DISCUSSION
Characterization of Etodolac Lipid Dispersions
Etodolac lipid dispersions were evaluated via DSC and XRD studies to investigate the presence of interaction between etodolac and the lipids and to elucidate the changes in their degree of crystallinity, if present. Herein, Precirol® ATO 5 was provided as a representative lipid. The etodolac/Precirol® ATO 5 ratio of 1:0.25 was adopted in the represented physical mixture and lipid dispersion.
DSC Studies
The DSC thermograms of etodolac, Precirol® ATO 5, etodolac/Precirol® ATO 5 physical mixture (1:0.25) and etodolac lipid dispersion in Precirol® ATO 5 are graphically illustrated in Fig. 1. It is clear that the DSC thermograms of etodolac and Precirol® ATO 5 exhibit melting endotherms at 147.5°C and 55.87°C, respectively. These peaks could indicate that both components exist as highly ordered crystalline materials.
Fig. 1.
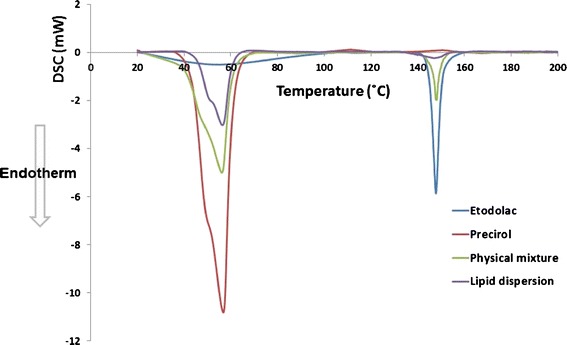
DSC thermograms of etodolac, Precirol® ATO 5, etodolac/Precirol® ATO 5 physical mixture (1:0.25) and etodolac lipid dispersion in Precirol® ATO 5
On the other hand, the DSC thermograms of the physical mixture and etodolac lipid dispersion show compilations of these peaks. It could be inferred that there is no interaction between etodolac and Precirol® ATO 5. Furthermore, the permanence of etodolac peak in the DSC thermogram of etodolac lipid dispersion could indicate its incomplete dissolution in Precirol ATO 5 at the investigated drug/lipid ratio. To confirm the previous suggestions, X-ray diffraction studies were conducted.
XRD Studies
The X-ray diffractograms showing the d-spacing values of etodolac, Precirol® ATO 5, etodolac/Precirol® ATO 5 physical mixture (1:0.25) and etodolac lipid dispersion in Precirol® ATO 5 are depicted in Fig. 2. It is clear that the X-ray diffractogram of etodolac shows characteristic intensity reflection counts of 258.61, 203.58, 394.49, 127.76, 84.89 and 178.49 at 2θ 9.21, 13.63, 14.45, 18.70, 20.40, and 22.94 Å, respectively. In a parallel line, the X-ray diffractogram of Precirol® ATO 5 shows characteristic intensity reflection counts of 628.99, 977.77, 952.75, 680.61, 521.59 and 739.57 at 2θ 5.48, 19.03, 19.47, 23.02, 23.62 and 24.11 Å, respectively. The X-ray diffraction pattern of the physical mixture shows a compilation of the two diffractograms with markedly lower intensity reflection counts at 2θ 5.44, 9.36, 13.73, 14.54, 18.85, 18.98, 19.42, 20.47, 23.02, 23.53, and 24.41 Å, respectively. This could be related to the dilution effect.
Fig. 2.
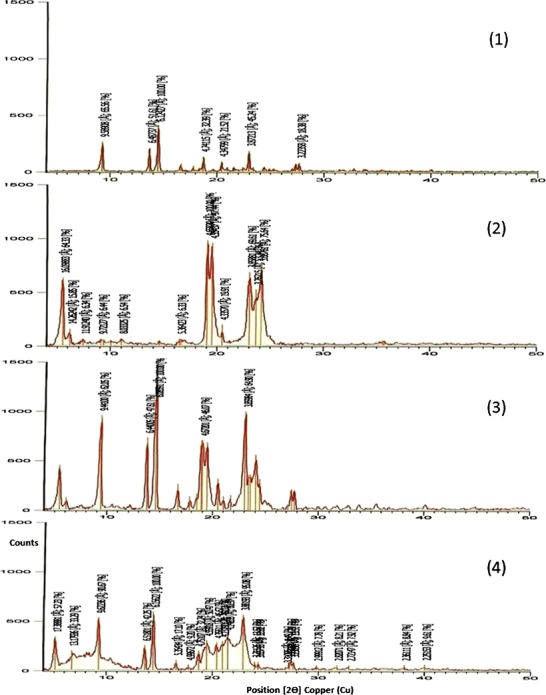
X-ray diffractograms of etodolac (1), Precirol® ATO 5 (2), etodolac/Precirol® ATO 5 physical mixture (1:0.25) (3) and etodolac lipid dispersion in Precirol® ATO 5 (4)
In fact, the recognition of the characteristic drug-related peaks in the X-ray diffractogram of etodolac lipid dispersion could indicate the permanence of the drug in its original crystalline form. These findings support the data generated from the DSC analysis of the same samples. These suggestions are in line with those reported by Kasongo et al. (25) who developed didanosine-loaded solid lipid nanoparticles and nanostructured lipid carriers and found that the drug was not molecularly dispersed, at the concentrations used, in the same lipid matrix (Precirol® ATO 5) but remained in the crystalline state even following exposure to heat at 85°C for 1 h.
Physicochemical Characterization of Etodolac Lipid Matrix Tablets
The investigated physicochemical properties of the lipid matrix tablets are summarized in Table II. It could be inferred that the physicochemical properties of the developed tablets comply with the pharmacopoeial (BP) specifications (26). The mean thickness values of all tablet batches ranged from 1.91 (L9) to 2.09 (L8) mm. This would ensure the reproduction of tablets identical in appearance. In order to ensure that each tablet contained the labeled amount of the drug within the prescribed limits, the mean tablet weights as well as the mean drug content were determined. The weights of all tablet batches were uniform ranging from 393.81 (L6) to 408.10 (L11) mg. In a parallel line, the mean drug content results were satisfactory; ranging from 97.36 (L1) to 103.78% (L22). These results could indicate that the mixing and tabletting processes would ensure accurate dosing. To recapitulate, the mean tablet thickness, weight and drug content were within ±5%deviations of their mean values of 2 mm, 400 mg and 100%, respectively.
Table II.
Physicochemical Properties of the Prepared Etodolac Lipid Matrix Tablets (mean ± S.D.)
| Form. code | Tablet thickness (mm) | Tablet weight (mg) | Drug content (%) | Tablet friability (%) |
|---|---|---|---|---|
| L1 | 2.02 ± 0.04 | 402.14 ± 1.63 | 97.36 ± 0.33 | 0.36 ± 0.12 |
| L2 | 2.01 ± 0.02 | 396.39 ± 1.34 | 99.67 ± 1.29 | 0.25 ± 0.15 |
| L3 | 1.98 ± 0.1 | 397.98 ± 2.05 | 101.45 ± 1.23 | 0.34 ± 0.18 |
| L4 | 1.92 ± 0.03 | 405.87 ± 2.12 | 103.12 ± 0.96 | 0.21 ± 0.19 |
| L5 | 2.06 ± 0.04 | 404.23 ± 1.87 | 98.54 ± 1.11 | 0.29 ± 0.11 |
| L6 | 2.04 ± 0.05 | 393.81 ± 2.18 | 102.34 ± 1.24 | 0.32 ± 0.14 |
| L7 | 2.02 ± 0.06 | 395.14 ± 2.23 | 99.32 ± 1.35 | 0.37 ± 0.18 |
| L8 | 2.09 ± 0.07 | 397.66 ± 3.11 | 97.66 ± 1.98 | 0.34 ± 0.12 |
| L9 | 1.91 ± 0.04 | 405.11 ± 1.15 | 102.92 ± 1.16 | 0.49 ± 0.15 |
| L10 | 2.05 ± 0.09 | 407.87 ± 1.26 | 101.88 ± 1.17 | 0.27 ± 0.17 |
| L11 | 1.93 ± 0.10 | 408.10 ± 1.89 | 100.85 ± 1.34 | 0.29 ± 0.19 |
| L12 | 2.04 ± 0.04 | 404.56 ± 1.11 | 99.23 ± 0.31 | 0.31 ± 0.17 |
| L13 | 1.96 ± 0.08 | 402.17 ± 1.17 | 98.33 ± 1.95 | 0.40 ± 0.14 |
| L14 | 1.94 ± 0.05 | 395.88 ± 2.76 | 99.42 ± 1.34 | 0.27 ± 0.11 |
| L15 | 2.01 ± 0.07 | 396.23 ± 2.32 | 102.34 ± 1.78 | 0.36 ± 0.10 |
| L16 | 2.02 ± 0.10 | 399.53 ± 2.98 | 103.30 ± 1.11 | 0.35 ± 0.15 |
| L17 | 1.99 ± 0.03 | 400.45 ± 1.24 | 100.94 ± 0.93 | 0.39 ± 0.13 |
| L18 | 2.03 ± 0.08 | 396.67 ± 2.70 | 100.60 ± 1.18 | 0.41 ± 0.19 |
| L19 | 1.92 ± 0.07 | 403.24 ± 1.21 | 98.78 ± 0.32 | 0.47 ± 0.18 |
| L20 | 1.94 ± 0.02 | 395.88 ± 2.95 | 99.45 ± 0.84 | 0.34 ± 0.16 |
| L21 | 1.99 ± 0.06 | 397.17 ± 2.65 | 102.23 ± 1.72 | 0.38 ± 0.17 |
| L22 | 2.02 ± 0.09 | 400.45 ± 1.98 | 103.78 ± 0.37 | 0.41 ± 0.18 |
| L23 | 1.97 ± 0.08 | 395.67 ± 3.00 | 99.75 ± 1.93 | 0.36 ± 0.14 |
| L24 | 1.93 ± 0.06 | 396.45 ± 3.08 | 101.14 ± 1.28 | 0.49 ± 0.19 |
| L25 | 1.99 ± 0.08 | 397.78 ± 3.11 | 102.44 ± 1.27 | 0.36 ± 0.16 |
| L26 | 2.08 ± 0.03 | 404.13 ± 1.10 | 100.82 ± 0.47 | 0.28 ± 0.14 |
| L27 | 1.97 ± 0.04 | 401.30 ± 1.21 | 102.45 ± 0.48 | 0.50 ± 0.17 |
| L28 | 2.05 ± 0.05 | 404.46 ± 1.01 | 99.45 ± 0.87 | 0.47 ± 0.11 |
The friability percentages of all tablet batches lied within the pharmacopoeial limits (<1%); indicating the ability of the developed tablets to withstand abrasion during packaging, handling and shipping.
The Influence of Lipid Type and Level on the Drug Release from Lipid Matrix Tablets
Six waxy-lipid materials were investigated to prepare etodolac/lipid matrix tablets at two drug/lipid ratios (1:0.25 and 1:0.5, respectively). The drug released percentages in the first hour (Q1h) were taken as a measure of the burst effect commonly observed with matrix tablets. The higher Q1h would indicate a lower efficiency in minimizing the burst effect. On the other hand, the abilities of the formulae to retard the rate of drug release were compared by the time required for 50% of drug release (T50%).
The drug release profiles of etodolac/lipid matrix tablets (formulae L1–L6) prepared by direct compression of drug/lipid (1:0.25 w/w, respectively) solid dispersions are graphically illustrated in Fig. 3. The highest Q1h and the lowest T50% were observed with stearic acid-containing matrix (77.35 ± 2.32% and 0.68 ± 0.21 h, respectively) while the lowest Q1h and the highest T50% were achieved with Compritol® ATO 888-containing matrix (20.07 ± 0.60% and 6.17 ± 0.45 h, respectively). In between, the Q1h and T50% could be arranged (in a descending or ascending order, respectively) as follows (cetyl alcohol- > cetostearyl alcohol- > Imwitor® 900K- > Precirol® ATO 5-containing matrices). These results were statistically significant (P < 0.05).
Fig. 3.
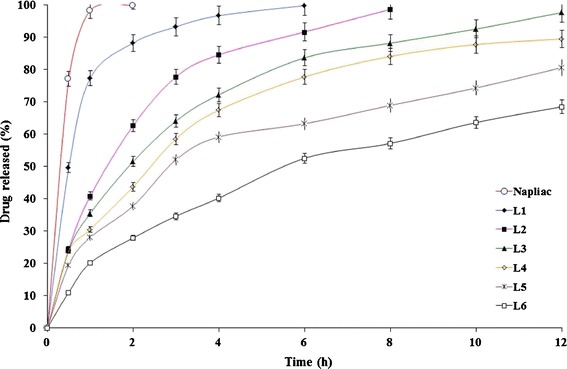
The influence of lipid type on etodolac release from lipid matrix tablets (L1–L6) prepared by direct compression of drug/lipid solid dispersions (1:0.25 w/w, respectively) in Sorensen’s phosphate buffer (pH 7.4) at 37 ± 0.5°C (mean ± S.D., n = 3)
It could be concluded that the physicochemical composition of the lipid material imparts a significant impact on the rate and extent of drug release. Six lipids were investigated, a fatty acid (stearic acid), two aliphatic alcohols (cetyl alcohol and cetostearyl alcohol) and three non-ionic lipophilic surfactants (Imwitor® 900K, Precirol® ATO 5, and Compritol® ATO 888).
The drug released percentages from stearic acid (C18H36O2)-containing matrix were the highest. This could be related to the formation of hydrogen bonding between the free carboxylic acid group of stearic acid and the surrounding dissolution medium and subsequent wetting of the matrix (30). Like stearic acid, cetyl alcohol (C16H34O) has certain hydrophilic characteristics attributed to the formation of hydrogen bonding between the free hydroxyl group of the latter and the surrounding dissolution medium. The higher hydrophilic properties of the former could be related to the larger molecular length and cross-sectional area (25 and 22 Å, respectively) than the corresponding values of the latter (22 and 21 Å, respectively) (31). The smaller molecular dimensions possibly decrease the ability of cetyl alcohol to form hydrogen bonds with dissolution medium. Cetostearyl alcohol is a mixture of cetyl alcohol (C16H34O, 20–35%) and stearyl alcohol (C18H38O, 50–70%) (11). The lower drug released percentages of cetostearyl alcohol-containing matrix might be related to the presence of a high percentage of longer fatty alcohol (stearyl alcohol) chains that imparts more hydrophobic characters (30).
Three lipophilic surfactants were investigated; Imwitor® 900K (glyceryl monostearate), Precirol® ATO 5 (glyceryl palmitostearate) and Compritol® ATO 888 (glyceryl behenate). They have HLB values of 3.8, 2 and 2, respectively (11). The relatively higher HLB value of glyceryl monostearate would allow the release of higher drug percentages upon contact with dissolution medium. Glyceryl palmitostearate and glyceryl behenate have a similar HLB value. However, glyceryl palmitostearate- and glyceryl behenate-containing matrices showed different drug release rates. Behanic acid is a fatty acid with a longer chain length (C22 fatty acid) than either stearic acid (C18 fatty acid) or palmitic acid (C16 fatty acid) (30). The longer the chain length of the former would ensure a higher degree of lipophilicity. This possibly explains the ability of glyceryl behenate-containing matrix to provide more retarded drug release rates. These results are in accordance with those reported by Li et al. (17) who concluded that Compritol® ATO 888 imparted the strongest retarding effect, of the investigated waxy-lipid materials, on sodium ferulate release.
The drug release profiles of etodolac/lipid matrix tablets (formulae L7–L12) prepared by direct compression of drug/lipid (1:0.50 w/w, respectively) solid dispersions are graphically illustrated in Fig. 4. It is clear that the burst effect almost disappeared with these formulae; Q1h values varied from 6.16 ± 0.18% (formula L12) to 10.61 ± 0.32% (formula L7) only. The retarding effect of the lipids on the rate of drug release from these lipid matrices was in line with that observed with the lipid matrix tablets prepared by direct compression of drug/lipid (1:0.25 w/w, respectively) solid dispersions. The T50% of Compritol® ATO 888-containing matrix (L12) was significantly (P < 0.05) the highest (54.55 ± 2.12 h) while the T50% of stearic acid-based matrix (L7) was significantly (P < 0.05) the lowest (20.99 ± 1.25 h). In between, other lipid-based matrices could be arranged in the following descending order cetyl alcohol- (L8) > cetostearyl alcohol- (L9) > Imwitor® 900K- (L10) > Precirol® ATO 5-based matrices (L11).
Fig. 4.
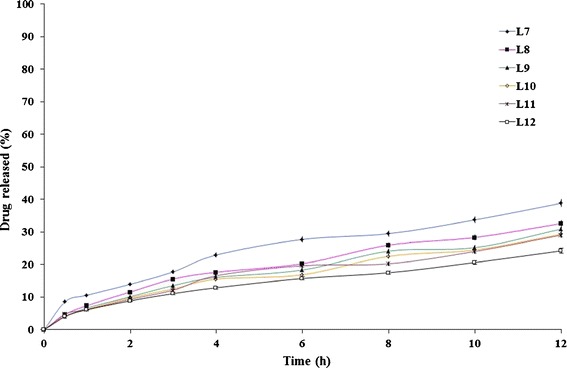
The influence of lipid type on etodolac release from lipid matrix tablets (L7–L12) prepared by direct compression of drug/lipid solid dispersions (1:0.50 w/w, respectively) in Sorensen’s phosphate buffer (pH 7.4) at 37 ± 0.5°C (mean ± S.D., n = 3)
The drug was almost completely released (98.32 ± 2.48%) from the immediate release Napilac® capsules within 1 h. On the contrary, significantly (P < 0.01) lower drug released percentages over a prolonged time were achieved with the developed lipid matrices. This could be attributed to almost complete coating of the drug particles by the lipids that melted and acted as a binder during the process of hot fusion. It would be expected that the penetration of the dissolution medium into the matrix would be lower and hence, the dissolution and release of the drug would occur at a slower rate (7).
Similarly, the lower drug release rates of the formulae (L7–L12) than those achieved with (L1–L6) could be related to the increased thickness of lipid coats surrounding the drug particles. Consequently, longer periods of time would be required for diffusion of drug through these lipid-coated particles (32).
Mathematical modeling and kinetic analysis of the drug release data revealed that the formulae (L1–L4) followed first-order release kinetics while the remaining formulae (L5–L12) were best fitted to Korsmeyer–Peppas equation (Table III). It is to be noted that formulae L1 showed rapid drug release (77.35% was released within 1 h). Therefore, the release exponent and the correlation coefficient could not be calculated as a result of insufficient data points on the drug release profile to provide accurate values (12). A good fit to Korsmeyer–Peppas equation could indicate that the drug release is controlled by more than one process; a coupling of diffusion and erosion mechanisms (29). The drug release mechanism could be best described as anomalous (non-Fickian) controlled release.
Table III.
Mathematical Modeling and Release Kinetics of Etodolac Lipid Matrix Tablets
| Zero-order plots | First-order plots | Korsmeyer–Peppas plots | ||||
|---|---|---|---|---|---|---|
| Form. code | Corr. coeff. (R 2) | Corr. coeff. (R 2) | Release exponent (n) | The best fitting model | T 50% (h) | |
| L1 | 0.665 | 0.960 | n/aa | n/a | First order | 0.68 |
| L2 | 0.822 | 0.978 | 0.970 | 0.610 | 1.73 | |
| L3 | 0.854 | 0.977 | 0.972 | 0.460 | 2.31 | |
| L4 | 0.858 | 0.975 | 0.894 | 0.417 | 2.81 | |
| L5 | 0.876 | 0.965 | 0.985 | 0.480 | Non-Fickian | 2.91 |
| L6 | 0.941 | 0.987 | 0.991 | 0.556 | 6.17 | |
| L7 | 0.967 | 0.980 | 0.995 | 0.592 | 20.99 | |
| L8 | 0.967 | 0.980 | 0.995 | 0.605 | 28.15 | |
| L9 | 0.970 | 0.979 | 0.997 | 0.534 | 32.33 | |
| L10 | 0.975 | 0.982 | 0.990 | 0.805 | 35.75 | |
| L11 | 0.958 | 0.967 | 0.979 | 0.544 | 37.33 | |
| L12 | 0.977 | 0.983 | 0.989 | 0.524 | 54.44 | |
| L13 | 0.888 | 0.967 | 0.977 | 0.443 | Fickian | 3.91 |
| L14 | 0.969 | 0.988 | 0.992 | 0.505 | Non-Fickian | 8.59 |
| L15 | 0.967 | 0.973 | 0.992 | 0.589 | 12.07 | |
| L16 | 0.975 | 0.982 | 0.991 | 0.604 | 29.32 | |
| L17 | 0.953 | 0.984 | 0.995 | 0.571 | 9.52 | |
| L18 | 0.947 | 0.979 | 0.991 | 0.575 | 10.53 | |
| L19 | 0.961 | 0.982 | 0.993 | 0.523 | 11.58 | |
| L20 | 0.975 | 0.986 | 0.991 | 0.556 | 15.15 | |
| L21 | 0.959 | 0.985 | 0.989 | 0.498 | 4.56 | |
| L22 | 0.965 | 0.989 | 0.993 | 0.576 | 4.27 | |
| L23 | 0.826 | 0.927 | 0.995 | 0.735 | 3.31 | |
| L24 | 0.910 | 0.932 | 0.985 | 0.924 | Case II transport | 2.97 |
| L25 | 0.918 | 0.977 | 0.983 | 0.641 | Non-Fickian | 5.71 |
| L26 | 0.919 | 0.978 | 0.984 | 0.808 | 5.35 | |
| L27 | 0.896 | 0.973 | 0.977 | 0.754 | 4.84 | |
| L28 | 0.899 | 0.968 | 0.978 | 0.979 | Case II transport | 4.77 |
aNot applicable
Based on these results, two formulae (L5 and L6) were chosen for further studies as they provided promising sustained-release drug profiles.
The Influence of Filler Type on the Drug Release from Lipid Matrix Tablets
The influence of changing lactose/Avicel® PH101 ratio on the drug release profiles from Precirol® ATO 5- and Compritol® ATO 888-containing formulae is graphically illustrated in Figs. 5 and 6, respectively. It is clear that the higher Avicel® PH101:lactose ratio, the lower the rate of drug release. The T50% values of lactose-free formulae (L16 and L20) were 29.32 and 15.15 h, respectively while the T50% values of Avicel® PH101- free formulae (L5 and L6) were 2.91 and 6.17 h, respectively. The developed formulae, except L13, followed anomalous (non-Fickian) controlled-release mechanism (Table III).
Fig. 5.
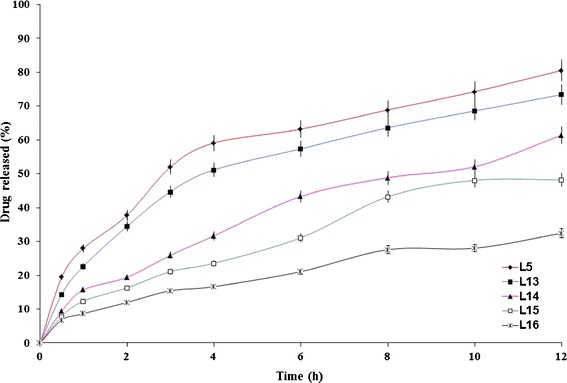
The influence of filler type on etodolac release from Precirol® ATO 5-containing lipid matrix tablet (L5) in Sorensen’s phosphate buffer (pH 7.4) at 37 ± 0.5°C (mean ± S.D., n = 3)
Fig. 6.
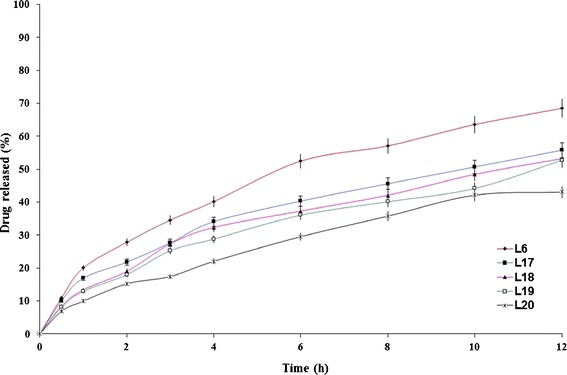
The influence of filler type and on etodolac release from Compritol® ATO 888-containing lipid matrix tablet (L6) in Sorensen’s phosphate buffer (pH 7.4) at 37 ± 0.5°C (mean ± S.D., n = 3)
Lactose produces its effect by the formation of pores in the matrix since it has rapid and high solubility in water (17). In a previous study (10), it was revealed that the incorporation of lactose markedly increased the rate of tramadol hydrochloride release. The rapid water solubility of lactose produced interconnected pores (channels) in the matrix that allowed the dissolution medium to penetrate the matrix and dissolve the drug more rapidly. Unlike lactose, Avicel® PH101 is practically insoluble in water and works by swelling in water. This would promote the release of lower drug percentages. The lactose/Avicel® PH101 physical mixture (1:1) was considered as the filler of choice as it significantly (P < 0.05) minimized the burst effect (Q1h) observed with Avicel® PH101-free formulae (L5 and L6) from 27.97 to 20.07% to the reasonable values of 15.71 and 13.39% (L14 and L18), respectively. Based on these results, two formulae (L14 and L18) were chosen for further studies.
The Influence of Surfactant’s HLB and Drug/Surfactant Ratio on the Drug Release from Surfactant-Enriched Lipid Matrix Tablets
The best achieved surfactant-free formulae (L14 and L18) succeeded in minimizing the burst effect observed with L5 and L6, respectively. However, they failed in releasing appropriate drug percentages after 12 h. The incorporation of the surfactants, at an optimum drug/surfactant ratio, was investigated in an attempt to tailor the rate of drug release from the resulting surfactant-enriched lipid matrix tablets and achieve a compromise between the burst effect and the released drug percentage after 12 h.
The influence of the surfactant’s HLB on the rate of drug release from the formulae L14 and L18 was investigated at two levels (5,11) (Figs. 7 and 8). The higher the surfactant’s HLB, the higher the rate of drug release (33). The lipid matrix tablets prepared with sucrose stearate D-1811® (L23, L24, L27, and L28) showed significantly (P < 0.05) higher drug release rates than the corresponding formulae (L21, L22, L25, and L26) prepared with sucrose stearate D-1805®.
Fig. 7.
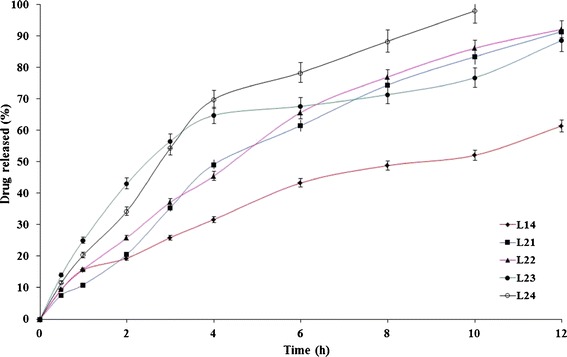
The influence of drug/surfactant ratio and surfactant ’s HLB on etodolac release from Precirol® ATO 5-containing lipid matrix tablet (L14) in Sorensen’s phosphate buffer (pH 7.4) at 37 ± 0.5°C (mean ± S.D., n = 3)
Fig. 8.
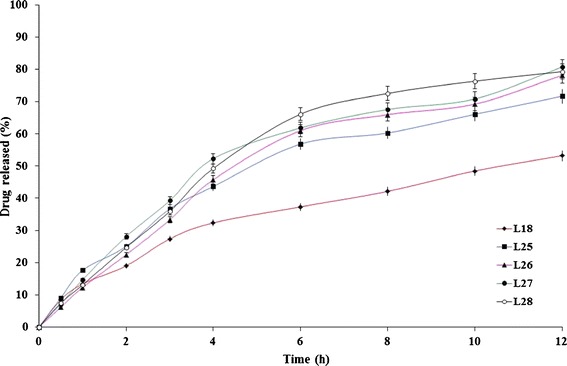
The influence of drug/surfactant ratio and surfactant ’s HLB on etodolac release from Compritol® ATO 888-containing lipid matrix tablet (L18) in Sorensen’s phosphate buffer (pH 7.4) at 37 ± 0.5°C (mean ± S.D., n = 3)
The influence of the drug/surfactant ratio on the rate of drug release from the formulae L14 and L18 was investigated on two levels (20:1 and 10:1, respectively). The developed formulae at a drug/surfactant ratio of 10:1 (L22, L24, L26, and L28) showed slightly higher drug release rates than the corresponding formulae (L21, L23, L25, and L27, respectively) prepared at a lower drug/surfactant ratio. Statistical analysis of the drug release date revealed non-significant (P > 0.05) differences. To confirm, the similarity factor (f2) values were calculated to determine the similarity of the investigated dissolution profiles. The f2 values between (L21, L22), (L23, L24), (L25, L26), and (L27, L28) were 71, 56, 69, and 61, respectively. Within the investigated ratios, it could be inferred that the drug/surfactant ratio has a non-significant effect on the rate of drug release from the developed surfactant-enriched lipid matrices.
The interface between hydrophobic lipid carrier (Precirol® ATO 5/Compritol® ATO 888) and the dissolution medium (Sorensen’s phosphate buffer pH 7.4) might hinder the complete etodolac release. As suggested by Li et al. (17), the surfactant (sucrose stearate D-1811®/sucrose stearate D-1805®) can balance the hydro-lipid property of the releasing environment. Consequently, the concentration gradient of the drug (etodolac) could be bridged and maintained continuously. As a second role, the surfactant can act as a diffusion aid for the dissolved drug out of hydrophobic pores or channels. The significantly (P < 0.05) higher drug release rates observed with the lipid matrix tablets prepared with sucrose stearate D-1811® could be related to the surfactant’s ability (HLB 11) to allow more rapid penetration of the dissolution medium into the lipid matrices. The embedded drug could be released through the formed porous waxy networks rapidly and completely (17).
Of the investigated lipid matrices (L1–L28), one promising sustained-release system (L21) that succeeded in releasing more than 90% of the drug over 12 h, was selected.
SEM Micrographs
SEM micrographs of cross-sections of L21 were taken before and after the dissolution studies to confirm the previous suggestions, elucidate the microstructures of the tablet and explore the pathway of drug release (34).
Before contact with the dissolution medium, the SEM micrographs revealed that the tablet cross-section had a rough and corrugated surface (×200, Fig. 9a). No pores were observed, even after examination under higher magnification (×1800, Fig. 9b). By the end of the dissolution studies, the SEM micrographs (×200, Fig. 9c) revealed that the tablet cross-section became highly porous possibly due to the dissolution and diffusion of the drug particles at the surface of the matrices allowing the inner drug particles to be released through mini-channels. Similar findings were observed following sodium ferulate from Compritol 888 ATO-based matrix tablets (17). It was reported that large quantities of cracks were observed, on the cross-sections of such tablets, in a manner that reflects multiple porosity (×1800, Fig. 9d).
Fig. 9.
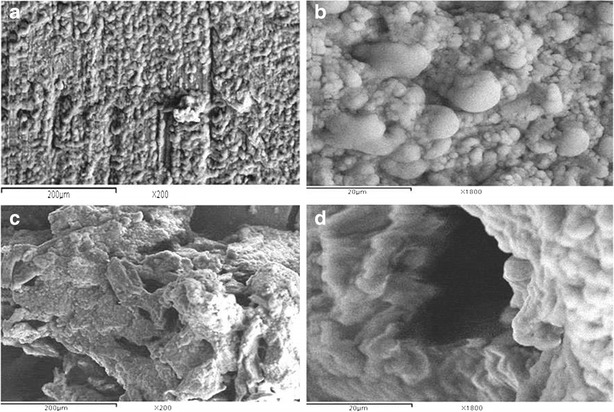
SEM micrographs of a cross-section of L21 matrix taken before (a “×200”, b “×1800”) and after (c “×200”, d “×1800”) dissolution studies
CONCLUSIONS
The DSC and XRD studies of the developed etodolac lipid dispersions revealed the permanence of the drug in its original crystalline form. The release of more than 90% of etodolac over 12 h was successfully achieved, in vitro, by optimization of the variables influencing the design of surfactant-enriched lipid matrix tablets by the hot fusion method including; the lipid type, the drug/lipid ratio, the filler type and the surfactant’s HLB. Within the investigated ratios, the drug/surfactant ratio has a non-significant (P > 0.05) on the rate of drug release. The best achieved lipid matrix tablets (L21) contained etodolac (50%), lactose (16.5%), Avicel® PH101 (16.5%), Precirol® ATO-5 (12.5%), sucrose stearate D-1805® (2.5%), talc (1%), and magnesium stearate (1%). SEM micrographs confirmed the formation of pores and channels in the matrix upon contact with the dissolution medium; a possible pathway for the diffusion of the solubilized drug particles within the matrix.
Acknowledgments
Declaration of Interest
The authors report no declarations of interest.
References
- 1.Noack A, Hause G, Mäder K. Physicochemical characterization of curcuminoid-loaded solid lipid nanoparticles. Int J Pharm. 2012;423(2):440–451. doi: 10.1016/j.ijpharm.2011.12.011. [DOI] [PubMed] [Google Scholar]
- 2.Güres S, Siepmann F, Siepmann J, Kleinebudde P. Drug release from extruded solid lipid matrices: theoretical predictions and independent experiments. Eur J Pharm Biopharm. 2012;80(1):122–129. doi: 10.1016/j.ejpb.2011.10.002. [DOI] [PubMed] [Google Scholar]
- 3.Zhou L, Chen Y, Zhang Z, He J, Du M, Wu Q. Preparation of tripterine nanostructured lipid carriers and their absorption in rat intestine. Pharmazie. 2012;67(4):304–310. [PubMed] [Google Scholar]
- 4.Zeng N, Hu Q, Liu Z, Gao X, Hu R, Song Q, Gu G, Xia H, Yao L, Pang Z, Jiang X, Chen J, Fang L. Preparation and characterization of paclitaxel-loaded DSPE-PEG-liquid crystalline nanoparticles (LCNPs) for improved bioavailability. Int J Pharm. 2012;424(1–2):58–66. doi: 10.1016/j.ijpharm.2011.12.058. [DOI] [PubMed] [Google Scholar]
- 5.Pivette P, Faivre V, Mancini L, Gueutin C, Daste G, Ollivon M, Lesieur S. Controlled release of a highly hydrophilic API from lipid microspheres obtained by prilling: analysis of drug and water diffusion processes with X-ray-based methods. J Control Release. 2012;158(3):393–402. doi: 10.1016/j.jconrel.2011.11.027. [DOI] [PubMed] [Google Scholar]
- 6.Hasa D, Perissutti B, Grassi M, Zacchigna M, Pagotto M, Lenaz D, Kleinebudde P, Voinovich D. Melt extruded helical waxy matrices as a new sustained drug delivery system. Eur J Pharm Biopharm. 2011;79(3):592–600. doi: 10.1016/j.ejpb.2011.07.012. [DOI] [PubMed] [Google Scholar]
- 7.Ozyazici M, Gökce EH, Ertan G. Release and diffusional modeling of metronidazole lipid matrices. Eur J Pharm Biopharm. 2006;63:331–339. doi: 10.1016/j.ejpb.2006.02.005. [DOI] [PubMed] [Google Scholar]
- 8.Huang HP, Mehta SC, Radebaugh GW, Fawzi MB. Mechanism of drug release from an acrylic polymer–wax matrix tablet. J Pharm Sci. 1994;83(6):795–797. doi: 10.1002/jps.2600830607. [DOI] [PubMed] [Google Scholar]
- 9.Sato H. Dissolution mechanism of diclofenac sodium from wax matrix granules. Ibid. 1997;86(8):929–934. doi: 10.1021/js960221w. [DOI] [PubMed] [Google Scholar]
- 10.Obaidat AA, Obaidat RM. Controlled release of tramadol hydrochloride from matrices prepared using glyceryl behenate. Eur J Pharm Biopharm. 2001;52(2):231–235. doi: 10.1016/S0939-6411(01)00173-4. [DOI] [PubMed] [Google Scholar]
- 11.Rowe RC, Sheskey PJ, Owen SC. Handbook of pharmaceutical excipients. 5. London: Pharmaceutical Press and American Pharmacists Association; 2006. [Google Scholar]
- 12.Abdelbary GA, Tadros MI. Design and in vitro/in vivo evaluation of novel nicorandil extended release matrix tablets based on hydrophilic interpolymer complexes and a hydrophobic waxy polymer. Eur J Pharm Biopharm. 2008;69:1019–1028. doi: 10.1016/j.ejpb.2008.01.011. [DOI] [PubMed] [Google Scholar]
- 13.Thomsen LJ, Schaefer T, Sonnergaard JM, Kristensen HG. Prolonged release matrix pellets prepared by melt pelletization. I. Process variables. Drug Dev Ind Pharm. 1993;19:1867–1887. doi: 10.3109/03639049309073895. [DOI] [Google Scholar]
- 14.Adeyeye CM, Price J. Development and evaluation of sustained-release ibuprofen–wax microspheres. II. In vitro dissolution studies. Pharm Res. 1994;11:575–579. doi: 10.1023/A:1018931002991. [DOI] [PubMed] [Google Scholar]
- 15.Peri D, Bogdansky S, Allababidi S, Shah JC. Development of an implantable, biodegradable, controlled drug delivery system for local antibiotic therapy. Drug Dev Ind Pharm. 1994;20:1341–1352. doi: 10.3109/03639049409038374. [DOI] [Google Scholar]
- 16.Barthelemy P, Laforêt JP, Farah N, Joachim J. Compritol 888 ATO: an innovative hot-melt coating agent for prolonged-release drug formulations. Eur J Pharm Biopharm. 1999;47(1):87–90. doi: 10.1016/S0939-6411(98)00088-5. [DOI] [PubMed] [Google Scholar]
- 17.Li FQ, Hu JH, Deng JX, Su H, Xu S, Liu JY. In vitro controlled release of sodium ferulate from Compritol 888 ATO-based matrix tablets. Int J Pharm. 2006;324:152–157. doi: 10.1016/j.ijpharm.2006.06.006. [DOI] [PubMed] [Google Scholar]
- 18.Das S, Ng WK, Kanaujia P, Kim S, Tan RB. Formulation design, preparation and physicochemical characterizations of solid lipid nanoparticles containing a hydrophobic drug: effects of process variables. Colloids Surf B Biointerfaces. 2011;88(1):483–489. doi: 10.1016/j.colsurfb.2011.07.036. [DOI] [PubMed] [Google Scholar]
- 19.Corti G, Cirri M, Maestrelli F, Mennini N, Mura P. Sustained-release matrix tablets of metformin hydrochloride in combination with triacetyl-beta-cyclodextrin. Eur J Pharm Biopharm. 2008;68(2):303–309. doi: 10.1016/j.ejpb.2007.06.004. [DOI] [PubMed] [Google Scholar]
- 20.Hamdani J, Moës AJ, Amighi K. Development and evaluation of prolonged release pellets obtained by the melt pelletization process. Int J Pharm. 2002;245(1–2):167–177. doi: 10.1016/S0378-5173(02)00348-4. [DOI] [PubMed] [Google Scholar]
- 21.Abd-Elbary A, El-laithy HM, Tadros MI. Sucrose stearate-based proniosome-derived niosomes for the nebulisable delivery of cromolyn sodium. Ibid. 2008;357:189–198. doi: 10.1016/j.ijpharm.2008.01.056. [DOI] [PubMed] [Google Scholar]
- 22.Youan BC, Hussain A, Nguyen NT. Evaluation of sucrose esters as alternative surfactants in micro-encapsulation of proteins by the solvent evaporation method. AAPS PharmSciTech. 2003;5(2):E22. doi: 10.1208/ps050222. [DOI] [PMC free article] [PubMed] [Google Scholar]
- 23.Sweetman SC. Martindale: the complete drug reference. 37. London: Pharmaceutical Press; 2011. [Google Scholar]
- 24.Abd-Elbary A, Tadros MI, Alaa-Eldin AA. Development and in vitro/in vivo evaluation of etodolac controlled porosity osmotic pump tablets. AAPS PharmSciTech. 2011;12(2):485–495. doi: 10.1208/s12249-011-9608-z. [DOI] [PMC free article] [PubMed] [Google Scholar]
- 25.Kasongo KW, Pardeike J, Müller RH, Walker RB. Selection and characterization of suitable lipid excipients for use in the manufacture of didanosine-loaded solid lipid nanoparticles and nanostructured lipid carriers. J Pharm Sci. 2011;100(12):5185–5196. doi: 10.1002/jps.22711. [DOI] [PubMed] [Google Scholar]
- 26.British Pharmacopoeia. British Pharmacopoeia Commission, HMSO, London; 2011. Electronic version.
- 27.Moore J, Flanner H. Mathematical comparison of dissolution profiles. Pharm Technol. 1996;20:64–74. [Google Scholar]
- 28.Korsmeyer RW, Gurny R, Docler E, Buri P, Peppas NA. Mechanism of solute release from porous hydrophilic polymers. Int J Pharm. 1983;15:25–35. doi: 10.1016/0378-5173(83)90064-9. [DOI] [Google Scholar]
- 29.Siepmann J, Peppas NA. Modeling of drug release from delivery systems based on hydroxypropylmethylcellulose (HPMC) Adv Drug Deliv Rev. 2001;48:139–157. doi: 10.1016/S0169-409X(01)00112-0. [DOI] [PubMed] [Google Scholar]
- 30.Quadir MA, Rahman MS, Karim MZ, Akter S, Awkat MT, Reza MS. Evaluation of hydrophobic materials as matrices for controlled-release drug delivery. Pak J Pharm Sci. 2003;16(2):17–28. [PubMed] [Google Scholar]
- 31.Martin A. Physical pharmacy and pharmaceutical sciences. 5. Maryland: Lippincott Williams and Wilkins; 2005. [Google Scholar]
- 32.Lee BJ, Ryu SG, Cui JH. Formulation and release characteristics of hydroxypropyl methylcellulose matrix tablet containing melatonin. Drug Dev Ind Pharm. 1999;25(4):493–501. doi: 10.1081/DDC-100102199. [DOI] [PubMed] [Google Scholar]
- 33.Sudha BS, Sridhar BK, Srinatha A. Modulation of tramadol release from a hydrophobic matrix: implications of formulations and processing variables. AAPS PharmSciTech. 2010;11(1):433–440. doi: 10.1208/s12249-010-9400-5. [DOI] [PMC free article] [PubMed] [Google Scholar]
- 34.Seitavuopio P, Rantanen J, Yliruusi J. Tablet surface characterisation by various imaging techniques. Int J Pharm. 2003;254(2):281–286. doi: 10.1016/S0378-5173(03)00026-7. [DOI] [PubMed] [Google Scholar]