

Abstract
Frequent instillation of terbinafine hydrochloride (T HCl) eye drops (0.25%, w/v) is necessary to maintain effective aqueous humor concentrations for treatment of fungal keratitis. The current approach aimed at developing potential positively charged controlled-release polymeric nanoparticles (NPs) of T HCl. The estimation of the drug pharmacokinetics in the aqueous humor following ocular instillation of the best-achieved NPs in rabbits was another goal. Eighteen drug-loaded (0.50%, w/v) formulae were fabricated by the nanopreciptation method using Eudragit® RS100 and chitosan (0.25%, 0.5%, and 1%, w/v). Soybean lecithin (1%, w/v) and Pluronic® F68 (0.5%, 1%, and 1.5%, w/v) were incorporated in the alcoholic and aqueous phases, respectively. The NPs were evaluated for particle size, zeta potential, entrapment efficiency percentage (EE%), morphological examination, drug release in simulated tear fluid (pH 7.4), Fourier-transform IR (FT-IR), X-ray diffraction (XRD), physical stability (2 months, 4°C and 25°C), and drug pharmacokinetics in the rabbit aqueous humor relative to an oily drug solution. Spherical, discrete NPs were successfully developed with mean particle size and zeta potential ranging from 73.29 to 320.15 nm and +20.51 to +40.32 mV, respectively. Higher EE% were achieved with Eudragit® RS100-based NPs. The duration of drug release was extended to more than 8 h. FT-IR and XRD revealed compatibility between inactive formulation ingredients and T HCl and permanence of the latter’s crystallinity, respectively. The NPs were physically stable, for at least 2 months, when refrigerated. F5-NP suspension significantly (P < 0.05) increased drug mean residence time and improved its ocular bioavailability; 1.657-fold.
Key words: aqueous humor, chitosan, Eudragit® RS100, nanoparticles, terbinafine hydrochloride
INTRODUCTION
As per the World Health Organization recommendations, corneal diseases are recognized as major causes of vision loss and blindness, second to cataract (1). Fungal keratitis (keratomycosis) is a serious corneal fungal infection frequently caused by species of Curvularia, Aspergillus, Candida, and Fusarium in tropical climates and wearing contact lenses in developed countries (2). Compared with bacterial infections, the associated-adverse outcomes like the need for a corneal transplant or even eye removal are much more common. To control this infection, the repeated debridement of the associated ulcers along with aggressive and prolonged therapy with antifungal treatment is necessary (3).
Natamycin is the only available antifungal drug approved by the FDA for the treatment of filamentous fungal keratitis (2). A concentrated drug suspension (5%, w/v) should be instilled in the lower conjunctival sac every 1 or 2 h, for at least 4–6 weeks, to allow recovery (4). Terbinafine hydrochloride (T HCl), a well-known antifungal drug that inhibits ergosterol synthesis and subsequently causes lysis of fungal cell membrane (5), was clinically investigated as an alternative choice (6). Topical T HCl (0.25%, w/v) drops was proved to be as effective as natamycin suspension for the control of filamentous fungal keratitis. However, the mean duration of treatment with T HCl was longer (7). Like natamycin, frequent instillation of T HCl drops once per 2 h at nighttime, once per hour in daytime, is necessary to maintain effective drug aqueous humor concentrations (8).
Considering the fact that the cornea and conjunctiva have negative charges (4), the design of T HCl-loaded positively charged polymeric NPs would be expected to facilitate the intimate electrostatic interaction with these structures aiming to maintain effective drug concentrations at the site of action for prolonged time periods and reduce the extensive pre-corneal loss caused by the high tear fluid turnover and/or nasolacrimal drainage (9–11).
Chitosan and Eudragit® RS100 are commonly employed polymers to develop various ocular drug delivery systems. The former is a biocompatible and biodegradable cationic polymer that was proved to enhance the paracellular drug transport (12,13). Chitosan NPs offer many advantages due to their simple preparation methods, low toxicity, high stability (14), ability to prolong the corneal drug residence time, and/or enhance the intraocular drug delivery (15). The latter is cationic copolymer synthesized from acrylic acid and methacrylic acid esters with 5% quaternary ammonium groups (16). Like Eudragit® RL100, Eudragit® RS100 is able to develop stable non-irritant nano-dispersions suitable for ocular drug delivery (17–19).
In the current work, chitosan and Eudragit® RS100 were developed as positively charged polymeric NP reservoirs for T HCl. By virtue of their charge and size, these NPs are expected to maintain effective drug concentrations in the aqueous humor for prolonged periods of time. To confirm, the drug pharmacokinetics in the aqueous humor following ocular instillation of the best achieved NPs as well as the oily drug solution was evaluated in rabbits.
MATERIALS AND METHODS
Materials
T HCl, tamoxifen citrate (internal standard), Eudragit® RS100, and Miglyol® 812 (MIG) were kindly donated by Hikma Pharmaceuticals (6th of October City, Egypt), Amriya Pharmaceutical Industries, (Alexandria, Egypt), Röhm Pharma Polymers (Darmstadt, Germany), and Gattefossé (St-Priest, France), respectively. Epikuron® 200 (soybean lecithin with phosphatidylcholine content, >93%) was purchased from Degussa GmbH (Düsseldorf, Germany). Pluronic® F68 (Poloxamer 188) and phosphotungstic acid hydrate (for microscopy) were procured from Fluka BioChemika (Buchs, Switzerland). Chitosan (low molecular weight with a deacetylation degree of 85%) and acetonitrile (HPLC grade) were purchased from Sigma Aldrich Chemical Co., (St. Louis, MO). Spectra Por© semi-permeable membrane tubing (MWCO = 12,000–14,000 Dalton) was derived from Spectrum Medical Industries (Los Angeles, CA). Ortho-phosphoric acid (HPLC grade) and triethylamine (HPLC grade) were procured from E. Merck (Darmstadt, Germany). Ethyl alcohol (95%, v/v), sodium chloride, calcium chloride, sodium bicarbonate, and glacial acetic acid were supplied by El-Nasr pharmaceutical chemicals Co. (Abu Zaabal, Egypt). All other chemicals were of analytical grade and used as received.
Preparation of Drug-Loaded Positively Charged NPS
Eighteen drug-loaded (0.5%, w/v) NPs were fabricated by the nano-preciptation method at room temperature (20). The investigated concentrations of the positive charge inducers (Eudragit® RS100 and chitosan), the emulsifiers (soybean lecithin and Pluronic® F68) as well as the phase volume ratio are shown in Table I.
Table I.
The Composition of the Investigated T HCl-Loaded NPs
| Formulaea | Eudragit® RS100 (mg/ml) | Chitosan (mg/ml) | Lecithin (mg/ml) | Pluronic® F 68 (mg/ml) | Alcohol (ml) | Water (ml) | Acetic acid (1%; ml) |
|---|---|---|---|---|---|---|---|
| F1 | 2.5 | 10.0 | 5.0 | 0.1 | 0.9 | ||
| F10 | 2.5 | 0.9 | |||||
| F2 | 2.5 | 10.0 | 10.0 | 0.1 | 0.9 | ||
| F11 | 2.5 | 0.9 | |||||
| F3 | 2.5 | 10.0 | 15.0 | 0.1 | 0.9 | ||
| F12 | 2.5 | 0.9 | |||||
| F4 | 5.0 | 10.0 | 5.0 | 0.1 | 0.9 | ||
| F13 | 5.0 | 0.9 | |||||
| F5 | 5.0 | 10.0 | 10.0 | 0.1 | 0.9 | ||
| F14 | 5.0 | 0.9 | |||||
| F6 | 5.0 | 10.0 | 15.0 | 0.1 | 0.9 | ||
| F15 | 5.0 | 0.9 | |||||
| F7 | 10.0 | 10.0 | 5.0 | 0.1 | 0.9 | ||
| F16 | 10.0 | 0.9 | |||||
| F8 | 10.0 | 10.0 | 10.0 | 0.1 | 0.9 | ||
| F17 | 10.0 | 0.9 | |||||
| F9 | 10.0 | 10.0 | 15.0 | 0.1 | 0.9 | ||
| F18 | 10.0 | 0.9 |
aAll formulae contained T HCl (5 mg/ml)
Briefly, accurate amounts of T-HCl, soybean lecithin and Eudragit® RS100 were dissolved in ethyl alcohol (95%, v/v). The latter phase was injected drop-wise into the aqueous phase, containing Pluronic® F68, while stirring. The NPs were spontaneously formed and turned the solution slightly turbid (17). The resulting dispersion was stirred overnight to allow evaporation of alcohol. Drug-loaded chitosan NPs were prepared, in a similar way, with replacement of the aqueous phase with an equal volume of an aqueous acetic acid solution (1%, v/v) to allow the dissolution of chitosan. Briefly, accurate amounts of T-HCl and soybean lecithin were dissolved in ethyl alcohol (95%, v/v). The latter phase was injected drop-wise into the aqueous acetic acid solution, containing Pluronic® F68 and chitosan, whilst stirring. To ensure the development of fine NP suspensions, the dispersions were subjected to high pressure homogenization (high-pressure homogenizer cell disputer system, model S-FPC-10-60, Stansted, UK) for 10 cycles at a 1,000 bar (21). The resulting suspensions were centrifuged (Megafuge 1.0 R, Heraeus, Germany) at 18,000 rpm, at 4°C, for 1 h. The supernatant was discarded while the sediment was resuspended in distilled water.
CHARACTERIZATION OF DRUG-LOADED NPS
Particle Size Analysis and Zeta Potential Measurement
The mean particle size (MPS) of each drug-loaded formula was evaluated by photon correlation spectroscopy (PCS) adopting a Zetasizer Nano ZS (Malvern Instruments Ltd., Worcestershire, UK) at a 90° angle with respect to the incident beam. This technique analyzes the light scattering fluctuations caused by the Brownian motion of particles and yields a light intensity weighted MPS diameter (z-average).
The zeta (ζ) potential was determined using a laser doppler anemometer coupled with the same instrument. This technique measures the electrophoretic mobility of particles and converts into ζ potential using the Helmholtz–Smoluchowski equation built into the Malvern Zetasizer software (22).
All measurements were conducted, at 25°C, in triplicate. The MPS as well as the ζ potential were statistically (StatView® Ver. 5.0.1, SAS Institute Inc., CA) evaluated at P < 0.05 (one-way ANOVA followed by LSD test for multiple comparisons).
Determination of the EE%
Drug-loaded NPs were separated from the un-entrapped drug by centrifugation of the NP suspensions at 18,000 rpm for 1 h at 4°C, as previously described. The EE% was calculated by subtracting the amount of free drug in the supernatant from the initial loaded amount (17). The EE% was determined, in triplicate, spectrophotometrically (Shimadzu, UV-1601 PC, Kyoto, Japan) at λmax 284 nm after appropriate dilution of the clear supernatant.
Transmission Electron Microscopy
Transmission electron micrographs were captured to visualize the shape and matrix of the individual NPs. The appropriately diluted samples were properly loaded onto copper grids. The NPs were negatively stained with phosphotungstic acid aqueous solution (2%, w/v) for 3 min. As a suitable electron dense opaquing material, phosphotungstic acid is able to adsorb onto NPs, provide high contrast and good preservation (23). The loaded grids were examined under a transmission electron microscope (Joel JEM 1230, Tokyo, Japan).
In Vitro Drug Release Studies
The in vitro release studies of drug-loaded NPs were conducted in a USP Dissolution tester apparatus, type I (VK 7000 Dissolution Testing Station, Vankel Industries, Inc., Edison, NJ) containing 50 ml of simulated tear fluid (pH 7.4) (24), in triplicate. In order to simulate the ocular surface temperature, the latter was adjusted at 34 ± 0.5°C (25).
Based on the calculated EE%, accurate volumes of NP suspensions (containing the equivalent to 5 mg of T HCl) were loaded to glass cylindrical tubes (6 cm length × 2.5 cm internal diameter) tightly covered with a Spectra Por© semi-permeable membrane tubing (MWCO = 12,000–14,000 Dalton) from one end. The tubes were hanged to the shafts of the Dissolution tester apparatus from the other end (26). The rotation speed of the shafts was adjusted at 25 rpm. At specific time intervals up to 8 h, aliquot samples (1 ml) were withdrawn and immediately restored with the same volume of fresh simulated tear. The released drug was assessed by measuring the UV absorbance at 284 nm. The mean (±SD) drug released percentages were plotted versus time.
Mathematical modeling and kinetic analysis of the drug release profiles were conducted to estimate the best fitting kinetic model by fitting of data to Higuchi diffusion (27) and zero- and first-order models. Post hoc multiple comparisons for the drug released percentages after 8 h (P8 h) were conducted using LSD test.
Based on these studies, two NP suspensions (F5 and F14) were selected for further studies.
Solid-State Characterization
The NP suspensions were frozen and lyophilized (Novalyphe-NL 500 freeze dryer, Savant Instruments, Hicksville, NY) for 24 h at −30°C at a pressure of 0.05 mmHg. The dried samples were stored in glass vials at room temperature (25°C).
Fourier Transform Infrared Spectroscopy
Fourier transform infrared spectroscopy (FT-IR) spectroscopy studies were conducted to scrutinize any possible interactions between T HCl and the investigated polymers (Eudragit® RS 100, chitosan) through chemical bonds was assessed via FT-IR analysis. Briefly, the FT-IR spectra of T HCl, Eudragit® RS100, chitosan, T HCl/Eudragit® RS100 physical mixture (1:1), T HCl/chitosan physical mixture (1:1), T HCl-loaded Eudragit® RS100-based NPs (F5) and T HCl-loaded chitosan-based NPs (F14) were scanned in the spectral region between 4,000 and 400 cm−1 on FT-IR spectrophotometer (IR Affinity-1, Shimadzu, Kyoto, Japan) at a S/N ratio of 30,000:1. The samples were mixed with potassium bromide (1:10, w/w) and pressed to develop suitable discs for FT-IR spectroscopy. Since the potassium bromide has no absorption in the fundamental FT-IR spectrum region, only the spectrum of the investigated sample is obtained.
X-ray Diffractometry
The crystalline state of the drug in the developed NPs was evaluated by X-ray diffractometry (XRD) analysis. The X-ray spectra of T HCl, Eudragit® RS100, chitosan, T HCl: Eudragit® RS100 physical mixture (1:1), T HCl/chitosan physical mixture (1:1), T HCl-loaded Eudragit® RS100-based NPs (F5) and T HCl-loaded chitosan-based NPs (F14) were recorded on X-ray diffractometer (Diano, XRD-8000, Woburn, MA) using Ni-filtered CuKα radiation at a wavelength of 1.542 A, generated with 40-kV accelerating potential and 20-mA tube current. The instrument was operated in the continuous scanning speed over a 2θ range of 5° to 50° (28).
Short-term Physical Stability Studies
Nanosuspensions were stored in glass vials for 2 months at room temperature (25°C) and at refrigerator (4°C) (2,17). At specific time intervals (15 days), the samples were visually observed for any sedimentation. The MPS, ζ potential as well as EE% were measured and compared with the corresponding values when freshly prepared.
In Vivo Studies in Rabbits
The drug pharmacokinetics in the aqueous humor following ocular instillation of the best achieved NPs (F5) and the oily drug solution was evaluated on male New Zealand albino rabbits. The use and the treatment of rabbits in this study were conformed to the Association for Research in Vision and Ophthalmology statement for the use of animals, per the spirit of Association for Assessment and Accreditation of Laboratory Animal Care International’s expectations for animal care and use/ethics committees.
The rabbits (2–2.5 kg) were accommodated in cages kept in a light-controlled (alternate night and day cycles, 12 h each) air-conditioned chamber under controlled humidity (60 ± 5%). The feeding on standard laboratory diets and water ad libitum was ensured. Before the beginning of the study, a medical checkup by a veterinarian was conducted to check their physical state and ensure the lack of clinically observable abnormalities. By the end of the study, the rabbit bodies were collected, frozen and incinerated (Faculty of Veterinary Medicine, Cairo University, Egypt).
Estimation of Drug Pharmacokinetics in the Aqueous Humor of Rabbits
HPLC Analysis of T HCl
The quantitative determination of T HCl pharmacokinetics in the rabbit aqueous humor was based on a previously validated HPLC method using a Merck Hitachi LaChrom HPLC system (Darmstadt, Germany) (29). A reversed phase micro-particulate Agilent® C18 column (150 × 4.6 mm, 5 μm; Kansas) was attached. The mobile phase was an equimixture of acetonitrile and water containing o-phosphoric acid (0.02 M) and triethylamine (0.012 M). Elution was carried out at a flow rate of 1.2 ml/min with UV detection at 224 nm. Tamoxifen citrate (T Cit) was employed as an internal standard (5 μg/ml). Under these circumstances, the retention times of T HCl and T Cit were 4.1 and 8.8 min, respectively. Peak areas were determined with a C-R6A chromatopac Shimadzu integrator. A linear (r2 = 0.997) standard curve was constructed by plotting the peak area ratio of (T HCl/T Cit) against (T HCl) concentration in the rabbit aqueous humor. The procedural constant was calculated from the slope of the standard curve. The limits of detection and quantification were 5 and 10 ng/ml, respectively. In order to estimate the recovery percentage as well as the analytical method repeatability, three quality control samples were selected (QCL, 50 ng/ml; QCM, 1,250 ng/ml; and QCH, 2,500 ng/ml) representing low, medium, and high concentrations, respectively. The recovery percentages of these samples were 90.331, 93.773, and 95.868, respectively. In a parallel line, the repeatability was assessed by estimation of the relative standard deviation percentages (RSD%) for three replicates of each quality control sample. The RSD percentages of these samples were 0.213%, 0.191%, and 0.201%, respectively; confirming an acceptable degree of repeatability.
Study Design
A two treatment, non-blind, randomized, parallel design was adopted to compare the drug pharmacokinetics in the rabbit aqueous humor following ocular instillation of the best achieved drug-loaded NP suspension (F5). At 34°C, the saturated solubilities of T HCl in simulated tear fluid (pH = 7.4) and Miglyol® 812 were 1.450 ± 0.231 and 5.956 ± 0.216 mg/g, respectively. Consequently, the reference formulation was developed as an oily T HCl solution (0.5%, w/v) in Miglyol® 812. The study protocol was reviewed and approved by the institutional review board (REC-FOPCU; Research Ethics Committee-Faculty of Pharmacy, Cairo University) in Egypt.
Instillation of Drug Treatments and Sample Processing
Twenty rabbits were randomly divided into two groups. The NP suspension (F5) was instilled (50 μl) in the lower conjunctival sac of the right eye of each rabbit belonging to the first group (Treatment A) while the same volume of the oily drug solution was applied to those of the second group (Treatment B). The rabbits were systemically anaesthetized with ketamine hydrochloride (intramuscular injection, 50 mg/kg) along with xylazine as a muscle relaxant (intramuscular injection, 10 mg/kg) (30). At 5 min intervals, the loading of formulae was performed in two instillations using a micropipette. Care was taken to avoid touching the eye surface (8). At 0.5, 1, 2, 4, and 8 h post-instillation, the rabbits were locally anaesthetized (benoxinate HCl, 0.4% (w/v)) and aqueous humor samples (0.15 ml) were withdrawn by anterior chamber paracentesis (30–32). Following each sampling point, an ophthalmologist examined the ocular surfaces via a slit lamp to detect the presence of any damage and/or inflammation based on a scoring system ranging from (0, no inflammation to +4, and severe inflammation/damage). By the end of the study, half the number of rabbits showed moderate to severe inflammation/ damage (+2 to +4). Consequently, they were excluded from the study to avoid possible negative influences on the drug pharmacokinetics. The remaining rabbits (five per group) showed minor or little inflammation (+1) and were selected to be included in the study.
The aqueous humor samples were stored at −20°C until HPLC analysis. Prior to HPLC analysis, the thawed aqueous humor samples were spiked with T Cit. In order to precipitate the associated proteins, the spiked samples (0.10 ml) were vortex mixed (30 s) with acetonitrile (0.20 ml). Following centrifugation (15 min, 2,000×g), the drug content in the organic phase layer was determined by HPLC.
Pharmacokinetic Analysis
The concentration of T HCl (mean ± SD) in the rabbit aqueous humor was plotted against time. The maximum drug concentration (Cmax, in nanograms per milliliter) as well as the time to reach Cmax (Tmax, in hours) were directly obtained from the individual subject curves. The mean residence time (MRT, in hours) was estimated using WinNonlin® software (Ver. 1.5, NC) adopting a non-compartmental pharmacokinetic analysis. The area under the aqueous humor concentration-time curve (AUC(0–8), in nanograms per hour per milliliter) was calculated using the trapezoidal rule method. The results were statistically evaluated, using one-way ANOVA, at P < 0.05. The increase in the ocular drug bioavailability (folds) was estimated by dividing the AUC (0–8) of the NPs (F5) over that of the oily drug solution (30).
RESULTS AND DISCUSSION
T HCl-loaded NPs were efficiently prepared at room temperature by the simple nano-precipitation (solvent displacement) method originally developed by Fessi et al. (20). As reported (33), this technique is easy, less energy consuming, requires few additives and usually succeed in developing well defined NPs. The method is based on the interfacial deposition of a polymer (Eudragit® RS100 or chitosan) following the displacement of a semi-polar solvent (ethyl alcohol) miscible with water (17). The choice of ethyl alcohol was based on its high ability to reduce the surface tension of the aqueous phase. As suggested by El-Shabouri (21), the perturbation of the interface arising from the rapid diffusion of ethyl alcohol across the aqueous phase spontaneously produces a much larger interfacial area resulting in much finer droplets.
CHARACTERIZATION OF T HCL-LOADED NPS
Particle Size Analysis
The particle size for ophthalmic applications, as recommended by Zimmer and Kreuter (34), should not exceed 10 μm. Larger sizes might cause a scratching feeling, ocular irritation and patient discomfort. Figure 1 shows the MPS of drug-loaded Eudragit® RS100-based (A) and drug-loaded chitosan-based (B) NPs. The former NPs have MPS ranging from 120.247 (F3) to 277.627 nm (F7) while a wider MDS extending from 73.297 (F12) to 320.150 nm (F16) was achieved following the incorporation of the latter. It is clear that the developed NP suspensions exhibited particle size distribution range suitable for ocular application.
Fig. 1.
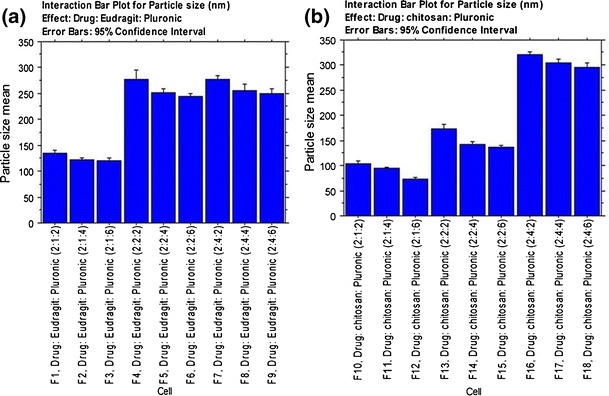
Interaction bar plots for particle size of T HCl-loaded Eudragit® RS100- a and chitosan-based b NPs (mean ± SD, n = 3)
It could be inferred that the MPS is dependent on the charge inducer type and the charge inducer/Pluronic® F68 ratio. At a fixed charge inducer ratio, the increase in Pluronic® F68 ratio would allow the fabrication of smaller NPs. This might be attributed to the higher emulsification power associated with the use of a higher amount of the surfactant. The lower surfactant concentrations might not be able to cover the entire organic droplet surface (35). Thereby; some of the droplets would tend to aggregate till the surface area is decreased to a point that the available amount of surfactant was able to coat the entire surface of the agglomerate and thus forming a stable emulsion with relatively larger droplets. Consequently, larger NPs would be produced following solvent evaporation (36).
At a fixed drug concentration, the increase in the charge inducer ratio would allow the production of larger NPs. This might be related to the repulsion between the positively charged polymers and the positively charged drug molecules. In a parallel line, Das et al. (37), developed amphotericin B-loaded Eudragit RS 100-based NPs and found an inverse correlation between the MPS and the drug concentration, at a fixed charge inducer ratio. This was related to the probable spatial interaction due to electrostatic charges between the negatively charged drug and the positively charged Eudragit® RS 100.
The increased dispersion viscosity could be considered as another possible explanation. At a fixed dispersion volume, the increase in the charge inducer ratio would produce a marked increase in the viscosity. This would allow the production of larger droplets and subsequently, larger NPs following solvent evaporation (35).
Zeta Potential Measurement
The ζ potential values, listed in Table II, show the effect of Eudragit® RS 100 and chitosan on the surface charge of NPs. The developed NPs were positively charged with ζ potential values ranging from +20.51 (F1) to +40.32 mV (F18). These results might be related to the synergism between the positively charged drug and the positively charged polymers. As reported (16), the positive charges in Eudragit® RS 100 and chitosan are related to the quaternary ammonium groups and the protonated amine groups, respectively. These positive charges could allow for a prolonged drug contact time by ionic interaction with the negatively charged sialic acid residues present in the mucous of the cornea and conjunctiva (17).
Table II.
The ζ Potential and EE Percentages of the Investigated T HCl-Loaded NPs (Mean ± SD, n = 3)
| Formulae | ζ potential (mV) | EE (%) |
|---|---|---|
| F1 | 20.51 ± 0.32 | 65.67 ± 1.44 |
| F2 | 31.82 ± 0.41 | 68.45 ± 1.34 |
| F3 | 26.44 ± 0.21 | 69.45 ± 1.35 |
| F4 | 27.71 ± 0.27 | 74.45 ± 1.56 |
| F5 | 27.63 ± 0.56 | 77.75 ± 2.56 |
| F6 | 30.81 ± 0.28 | 78.46 ± 2.08 |
| F7 | 31.44 ± 0.34 | 76.57 ± 1.77 |
| F8 | 26.22 ± 0.16 | 78.21 ± 1.90 |
| F9 | 26.28 ± 0.21 | 78.98 ± 2.66 |
| F10 | 25.64 ± 0.35 | 60.35 ± 2.89 |
| F11 | 34.85 ± 0.27 | 64.44 ± 2.55 |
| F12 | 35.02 ± 0.45 | 67.22 ± 3.14 |
| F13 | 29.61 ± 0.38 | 63.24 ± 2.78 |
| F14 | 33.42 ± 0.23 | 68.27 ± 1.45 |
| F15 | 33.22 ± 0.14 | 70.33 ± 1.67 |
| F16 | 32.82 ± 0.42 | 65.67 ± 2.77 |
| F17 | 32.22 ± 0.48 | 67.89 ± 2.61 |
| F18 | 40.32 ± 0.39 | 71.89 ± 2.15 |
Drug EE Percentages
The drug EE percentage explicitly indicates the percentage of T HCL encapsulated within NPs with respect to the total amount of Terbinafine HCL added to the system. As shown in Table II, the drug EE percentages were high and ranged from 65.67% (F1) to 78.98% (F9) and from 60.35% (F10) to 71.89% (F18) for Eudragit® RS 100- and chitosan-based NPs, respectively (Table II).
The high drug EE% could be attributed to two reasons. Firstly, T HCL is a very slightly water soluble drug that would be preferentially partitioned into the organic phase, rather than the aqueous phase, of the dispersion. The lipophilic nature of Eudragit® RS 100 could promote the entrapment of high drug percentages according to “like dissolves like” rule. Consequently, the lower drug EE% of the corresponding chitosan-based NPs could be referred to the hydrophilic nature of chitosan. As a second reason, the incorporation of two surfactants, Pluronic® F68 and lecithin, would produce strong coherent films around the individual droplets. This could be expected to minimize the loss of the drug into the aqueous phase (21).
The drug EE% is directly correlated to the drug: polymer ratio. At a fixed volume of the organic phase, increasing the polymer concentration would produce a marked increase in viscosity. This would minimize the diffusion of the drug into the external phase resulting in higher drug EE% (38). Similarly, a direct correlation was observed between the drug EE% and Pluronic® F68 concentration. Higher surfactant concentrations would generate smaller droplets with greater surface area. This would allow for rapid solvent evaporation, promote faster hardening of NPs and consequently leave shorter time for drug diffusion into the external aqueous phase (39).
Transmission Electron Microscopy
Representative photomicrographs of drug-loaded Eudragit® RS100- (F5) and chitosan-based (F14) NPs are shown in Fig. 2. It is clear that developed NPs were spherical, discrete and have a comparable size to that calculated by PCS and depicted in Fig. 1. The latter NPs appear to have more uniform particle size distribution than the former.
Fig. 2.
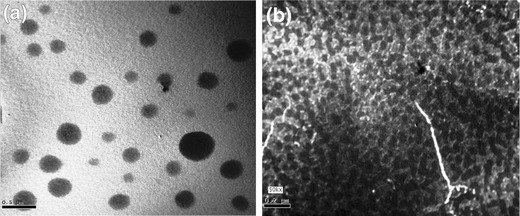
Transmission electron micrographs of T HCl-loaded Eudragit® RS100- (F5) a and chitosan-based (F14) b NPs
In Vitro Drug Release Studies
The in vitro drug release profiles of drug-loaded Eudragit® RS100- and chitosan-based NPs are graphically illustrated in Figs. 3 and 4, respectively. It could be inferred that the drug released percentages are dependent on the drug: Pluronic® F68 ratio (1:1, 1:2, and 1:3) as well as the drug/polymer ratio (1:0.5, 1:1, and 1:2).
Fig. 3.

The influence of increasing Pluronic® F68 concentration on the in vitro T HCl release from Eudragit® RS100-based NPs prepared at a drug/polymer ratio of 2:1 (a), 1:1 (b), and 1:2 (c) in simulated tear fluid (pH 7.4) at 34 ± 0.5°C (mean ± SD, n = 3)
Fig. 4.

The influence of increasing Pluronic® F68 concentration on the in vitro T HCl release from chitosan-based NPs prepared at a drug/polymer ratio of 2:1 (a), 1:1 (b), and 1:2 (c) in simulated tear fluid (pH 7.4) at 34 ± 0.5°C (mean ± SD, n = 3)
By the end of the study period, higher drug released percentages were observed with the formulae (F3, F6, F9, F12, F15, and F18) prepared at a drug/surfactant ratio of 1:3. The P8 h values of their dissolution profiles were higher than those prepared at lower drug/surfactant ratios. Similar findings were observed with those formulae (F1, F2, F3, F10, F11, and F12) prepared at a drug/polymer ratio of 1:0.5. The P8 h values of their dissolution profiles were higher than those prepared at higher drug/polymer ratios (Table III). As previously suggested, the higher surfactant concentrations and/or the lower polymer concentrations would generate smaller droplets and consequently smaller NPs following solvent evaporation. In either case, the entrapped drug would exhibit a shorter pathway to get in contact with the dissolution medium. This suggestion is in line with Atef and Belmonte who concluded that the amount of dissolved drug in the aqueous phase at time t is inversely proportional to the radius of the droplets (40).
Table III.
Mathematical Modeling and Drug Release Kinetics from the Investigated T HCl-Loaded NPs
| Formulae | Zero order plot linearity coefficient (R 2) | First order plot linearity coefficient (R 2) | Higuchi’s plot linearity coefficient (R 2) | The best fitting model | P 8 h (%) |
|---|---|---|---|---|---|
| F1 | 0.975 | 0.964 | 0.918 | Zero order | 45.28 |
| F2 | 0.923 | 0.908 | 0.869 | Zero order | 46.96 |
| F3 | 0.862 | 0.830 | 0.756 | Zero order | 48.61 |
| F4 | 0.957 | 0.947 | 0.892 | Zero order | 39.05 |
| F5 | 0.945 | 0.942 | 0.941 | Zero order | 44.19 |
| F6 | 0.939 | 0.934 | 0.933 | Zero order | 46.08 |
| F7 | 0.958 | 0.964 | 0.981 | Higuchi diffusion | 26.51 |
| F8 | 0.964 | 0.979 | 0.990 | Higuchi diffusion | 41.14 |
| F9 | 0.857 | 0.894 | 0.929 | Higuchi diffusion | 43.92 |
| F10 | 0.942 | 0.938 | 0.929 | Zero order | 47.55 |
| F11 | 0.965 | 0.963 | 0.937 | Zero order | 48.62 |
| F12 | 0.979 | 0.969 | 0.969 | Zero order | 60.21 |
| F13 | 0.974 | 0.973 | 0.953 | Zero order | 45.46 |
| F14 | 0.967 | 0.966 | 0.949 | Zero order | 48.5 |
| F15 | 0.899 | 0.870 | 0.820 | Zero order | 49.64 |
| F16 | 0.956 | 0.965 | 0.983 | Higuchi diffusion | 35.14 |
| F17 | 0.898 | 0.910 | 0.961 | Higuchi diffusion | 36.6 |
| F18 | 0.924 | 0.919 | 0.926 | Higuchi diffusion | 37.75 |
Mathematical modeling of the drug release data of the formulae prepared at a drug: polymer ratios of 1:0.5 or 1:1 could be best fitted to zero order kinetics while other formulae prepared at a drug: polymer ratio of 1:2 followed Higuchi’s diffusion kinetics (Table III). These findings are in accordance with those of Pignatello et al.(41) who found that the drug release from Eudragit® RL100 nanosuspensions was complex in nature and involved the occurrence of dissolutive and diffusive phenomena. Of the investigated formulae, F5 and F14 were chosen for further studies.
Solid-State Characterization
In order to provide an alternative promising choice to the possible physical and/or chemical stability problems of the drug, the developed nanoparticle (NP) suspensions were freeze dried to be reconstituted prior use. The additional convenience of the transportation, distribution, storage, and dosing would make these preparations promising industrial product (26).
FT-IR Spectroscopy
FT-IR spectra of T HCl, Eudragit® RS100, chitosan, T HCl/Eudragit® RS100 physical mixture (1:1), T HCl/chitosan physical mixture (1:1), T HCl-loaded Eudragit® RS100-based NPs (F5), and T HCl-loaded chitosan-based NPs (F14) are shown in Fig. 5a, b.
Fig. 5.
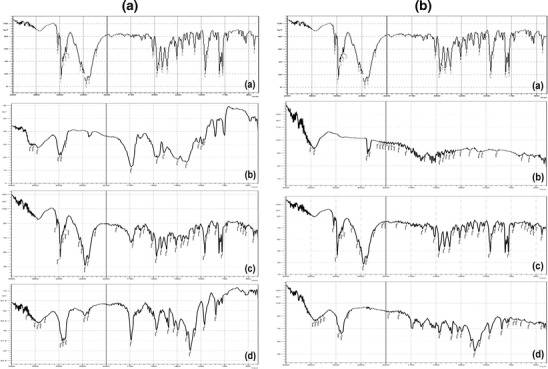
a FT-IR spectra of T HCl (a), Eudragit® RS100 (b), T HCl/Eudragit® RS100 physical mixture (1:1) (c), and freeze-dried F5 NP suspension (d). b FT-IR spectra of T HCl (a), chitosan (b), T HCl/chitosan physical mixture (1:1) (c), and freeze-dried F14 NP suspension (d)
T HCl has characteristic IR peaks at 3038 (alkenyl C-H stretch and/or aromatic C-H stretch), 2970 (alkyl C–H stretch), 2,225 (alkynyl C ≡ C stretch), 1,596 (alkenyl C = C stretch), 1,490 (aromatic C = C bending) cm−1. Eudragit® RS100 has characteristic IR absorption frequencies at 3,444 (O–H stretch), 2,961 (alkyl C–H stretch) and 1,738 (C = O ester stretch) cm−1 chitosan showed a broad characteristic peak at 3,421 (O–H stretch and/or amine N–H stretch) cm−1. The observed peaks were comparable with the findings of Kumar et al. (42), Mandal et al. (17), and Foda et al. (43), respectively. The IR spectrum of the developed physical mixtures as well as the freeze dried NPs (F5 and F14) showed minor differences in the positions of the absorption bands of T HCl, Eudragit® RS100 and chitosan. This could indicate the lack of (T HCl-polymer) solid state interactions and the compatibility between T HCl and the inactive formulation ingredients.
X-ray Diffractometry
The XRD of T HCl, Eudragit® RS100, chitosan, T HCl/Eudragit® RS100 physical mixture (1:1), T HCl/chitosan physical mixture (1:1), T HCl-loaded Eudragit® RS100-based NPs (F5), and T HCl-loaded chitosan-based NPs (F14) are depicted in Fig. 6a, b.
Fig. 6.
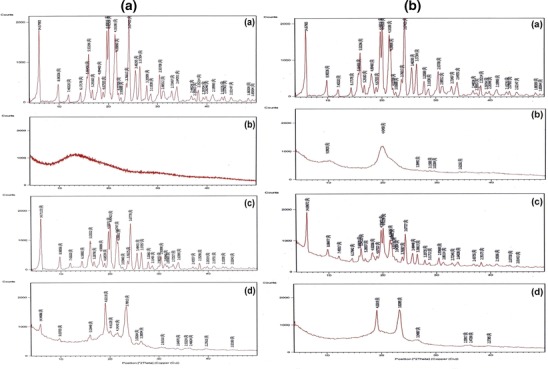
a X-ray diffractograms of T HCl (a), Eudragit® RS100 (b), T HCl/Eudragit® RS100 physical mixture (1:1) (c), and freeze-dried F5 NP suspension (d). b X-ray diffractograms of T HCl (a), chitosan (b), T HCl/chitosan physical mixture (1:1) (c), and freeze-dried F14 NP suspension (d)
T HCl is crystalline in nature and showed sharp intense peaks at 2°θ; 14.67°, 8.98°, 5.53°, 4.49°, 4.41°, 4.16°, 3.67°, 3.48°, 3.37°, 2.93°, and 2.64°. On contrary, Eudragit® RS100 and chitosan are completely amorphous and showed no distinct diffraction peaks. The X-ray spectra of the prepared physical mixtures exposed that the T HCl peak intensities were decreased, possibly due to the dilution effect, without a qualitative disparity of its diffractogram. The incorporation of T HCl in these polymeric NP reservoirs reduced its crystallinity. In other words, the disappearance of certain drug peaks in the XRD of the NPs, compared with the drug/polymer physical mixture, could indicate the dispersion of the drug within these NPs in a micro-crystalline or a semi-crystalline form. The latter is characterized by the close association of the amorphous and crystalline phases in a three-dimensional interphase (44). Similar findings were reported for the dispersion of sulfacetamide within Eudragit® RL100 NPs (17).
Short-term Physical Stability Study of Nanosuspensions
The physical appearance of the stored NP suspensions (F5 and F14) was promising. The samples retained their homogenous distribution by gentle shaking. Table IV shows the change percentages in MPS, ζ potential, and EE% after storage at 4°C and 25°C for 60 days. At 4°C, the NPs showed slight increases in MPS (3.54% and 3.33%, respectively) and minor decreases in ζ potential (1.45% and 0.93%, respectively) and EE% (2.80% and 2.20%, respectively). When stored at 25°C, the change percentages in these values were significantly (P < 0.05) higher. Consequently, storage of NP suspensions at 4°C is recommended to ensure good physical stability.
Table IV.
Change Percentages of the MPS, ζ Potential, and EE% of the Selected T HCl-Loaded NPs (F5 and F14) After Storage at 4°C and 25°C for 60 Days (Mean ± SD, n = 3)
| Storage period | Storage temperature | MPS (nm) | ζ potential (mV) | EE (%) | |||
|---|---|---|---|---|---|---|---|
| F5 | F14 | F5 | F14 | F5 | F14 | ||
| Freshly prepared | – | 252.44 ± 2.50 | 143.10 ± 2.03 | 27.63 ± 0.56 | 33.42 ± 0.23 | 77.75 ± 2.56 | 68.27 ± 1.45 |
| 60 days | 4°C | 261.39 ± 3.08 | 149.87 ± 1.87 | 27.23 ± 0.21 | 33.11 ± 0.14 | 75.58 ± 2.43 | 66.76 ± 2.14 |
| 25°C | 280.16 ± 2.65 | 161.17 ± 2.78 | 26.94 ± 0.56 | 32.64 ± 0.33 | 73.24 ± 3.23 | 64.45 ± 2.04 | |
| Mean change % | 4°C | +3.54 | +3.33 | −1.45 | −0.93 | −2.80 | −2.20 |
| 25°C | +10.98 | +12.62 | −2.50 | −2.34 | −5.81 | −5.60 | |
Based on the higher EE% and the longer T50%, one NP suspension (F5) was selected for further in vivo studies.
Pharmacokinetics of T-HCl in the Rabbit Aqueous Humor
There are two protocols for the estimation of the drug pharmacokinetics in the aqueous humor of rabbits; the first one involves pooling data from different subjects to generate single-subject estimates. As previously reported, this approach has an advantage of maintaining the integrity of the rabbits, corneas and the anterior chamber volume. When used to study the ocular pharmacokinetics in humans, it yields inaccurate and imprecise estimates because of inter- and intrasubject variations (45). The second technique involves a sequential sampling of the aqueous humor from the same rabbits. This approach permits more rigorous examination of ocular pharmacokinetics where the rabbit acts as his own control eliminating both inter- and intrasubject variations (46). However, it may negatively influence the corneal integrity leading to possible inflammation and reduced anterior chamber volume. In the current work, the second technique was adopted with careful consideration to its negative impacts.
The aqueous humor concentration (mean ± SD) time profiles of T HCl following ocular instillation of the best-achieved NP suspension (F5) and the oily drug solution in rabbits are depicted in Fig. 7. The differences between the estimated drug pharmacokinetic parameters (Cmax, Tmax, and MRT(0–8h)) of the two treatments are illustrated in Table V.
Fig. 7.
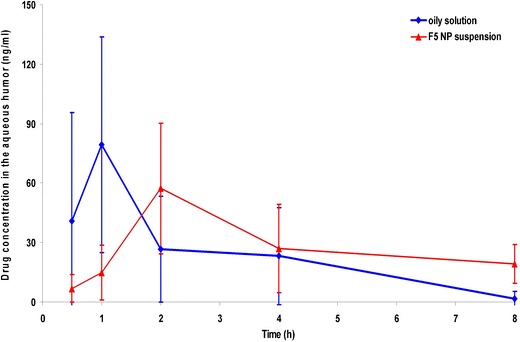
Aqueous humor concentration-time profiles of T HCl following ocular instillation of the oily drug solution and F5 NP suspension to rabbits (mean ± SD, n = 5)
Table V.
The Pharmacokinetic Parameters of T HCl Following Ocular Instillation of the Oily Drug Solution and F5 NP Suspension to Rabbits (Mean ± SD, n = 5)
| Formulae | C max (ng/ml) | T max a (h) | AUC(0–8) (ng h−1 ml−1) | MRT(0–8) (h) | Increase in bioavailability (folds) |
|---|---|---|---|---|---|
| Oily solution | 79.347 ± 54.400 | 1 | 178.425 ± 108.478 | 2.264 ± 0.768 | – |
| F5 NP suspension | 57.310 ± 33.029 | 2 | 295.646 ± 120.474 | 4.849 ± 0.596 | 1.657 ± 0.776 |
aMedian
It is clear that the mean (±SD) Cmax of the oily solution (79.347 ± 54.400 ng/ml) was higher than that of the NP suspension (57.310 ± 33.029 ng/ml). The delay in the median Tmax (from 1 to 2 h) as well as the prolongation in the MRT(0–8h) (from 2.264 ± 0.768 to 4.849 ± 0.596 h) for the oily solution and the NP suspension, respectively could indicate the controlled-release characteristics of the latter. These statistically significant (P < 0.05) results could be related to the ionic interaction between the positively charged NPs and the negatively charged sialic acid residues present in the mucous of the cornea and conjunctiva (17).
Based on the calculated AUC(0–8) values, the increase in the ocular bioavailability was found to be 1.657-fold. The drug penetration enhancement following the instillation of the NP suspension, could be related to colloidal carrier nature of NPs (nanosphere-mediated phenomenon) (47) as well as the appropriate drug lipophilicity (log P = 3.3). As reported, the optimum lipophilicity for transcorneal drug delivery corresponds to log P values of 2–3 (48). T HCl is expected to enhance the transcorneal passive diffusion along the drug concentration gradient via transcellular pathways (49).
On contrary, the poor wettability and fast clearance from the pre-ocular surfaces negatively influence the ocular bioavailability of the oily drug solution (50).
CONCLUSIONS
The current approach succeeded in developing promising T HCl-loaded Eudragit® RS100- and chitosan-based NPs by a simple nanopreciptation method. The developed NPs could be considered as a potential ophthalmic reservoir by virtue of their particle size, positive surface charge, controlled drug release characteristics, good physical stability, as well as high drug concentrations in the rabbit aqueous humor. Further studies should be conducted to explore the chemical stability of the drug in the developed formulae and prove the clinical efficacy of the best achieved systems in healthy human volunteers.
Acknowledgments
Disclosure
The authors report no conflicts of interest in this work.
References
- 1.Whitcher JP, Srinivasan M, Upadhyay MP. Corneal blindness: a global perspective. World Health Organization. 2001;79:214–21. [PMC free article] [PubMed] [Google Scholar]
- 2.Bhatta RS, Chandasana H, Chhonker YS, Rathi C, Kumar D, Mitra K, Shukla PK. Mucoadhesive nanoparticles for prolonged ocular delivery of natamycin: In vitro and pharmacokinetics studies. Int J Pharm. 2012;432:105–12. doi: 10.1016/j.ijpharm.2012.04.060. [DOI] [PubMed] [Google Scholar]
- 3.Tuli SS. Fungal keratitis. Clin Ophthalmol. 2011;5:275–79. doi: 10.2147/OPTH.S10819. [DOI] [PMC free article] [PubMed] [Google Scholar]
- 4.Shukla PK, Kumar M, Keshava GB. Mycotic keratitis: an overview of diagnosis and therapy. Mycoses. 2008;51:183–99. doi: 10.1111/j.1439-0507.2007.01480.x. [DOI] [PubMed] [Google Scholar]
- 5.Sweetman CS. Martindale: the complete drug reference. 37. London: Pharmaceutical Press; 2011. [Google Scholar]
- 6.Xuguang S, Zhixin W, Zhiqun W, Shiyun L, Ran L. Ocular fungal isolates and antifungal susceptibility in Northern China. Am J Ophthalmol. 2007;143:131–33. doi: 10.1016/j.ajo.2006.09.042. [DOI] [PubMed] [Google Scholar]
- 7.Liang QF, Jin XY, Wang XL, Sun XG. Effect of topical application of terbinafine on fungal keratitis. Chin Med J. 2009;122(16):1884–88. [PubMed] [Google Scholar]
- 8.Sun XG, Wang ZX, Wang ZQ, Deng SJ, Li R, Luo SY, Wu YY. Pharmacokinetics of terbinafine in the rabbit ocular tissues after topical administration. Ophthalmic Res. 2007;39:81–3. doi: 10.1159/000099242. [DOI] [PubMed] [Google Scholar]
- 9.Pignatello R, Ricupero N, Bucolo C, Maugeri F, Maltese A, Puglisi G. Preparation and characterization of Eudragit retard nanosuspensions for the ocular delivery of cloricromene. AAPS PharmSciTech. 2006;7(1):E27. doi: 10.1208/pt070127. [DOI] [PMC free article] [PubMed] [Google Scholar]
- 10.Gaudana R, Ananthula HK, Parenky A, Mitra AK. Ocular Drug Delivery. AAPS J. 2010;12(3):348–60. doi: 10.1208/s12248-010-9183-3. [DOI] [PMC free article] [PubMed] [Google Scholar]
- 11.Motwani SK, Chopra S, Talegaonkar S, Kohli K, Ahmad FJ, Khar RK. Chitosan–sodium alginate nanoparticles as submicroscopic reservoirs for ocular delivery: formulation, optimization and in vitro characterization. Eur J Pharm Biopharm. 2008;68:513–25. doi: 10.1016/j.ejpb.2007.09.009. [DOI] [PubMed] [Google Scholar]
- 12.Hirano S, Seino H, Akiyama I, Nonaka I. Chitosan: a biocompatible material for oral and intravenous administration. In: Gebelein CG, Dunn RL, editors. Progress in biomedical polymers. New York: Plenum Press; 1990. pp. 283–89. [Google Scholar]
- 13.Artursson P, Lindmark T, Davis SS, Illum L. Effect of chitosan on the permeability of monolayers of intestinal epithelial cells (Caco-2) Pharm Res. 1994;11:1358–61. doi: 10.1023/A:1018967116988. [DOI] [PubMed] [Google Scholar]
- 14.De Campos AM, Sanchez A, Alonso MJ. Chitosan nanoparticles: a new vehicle for the improvement of the delivery of drugs to the ocular surface. Application to cyclosporin A. Int J Pharm. 2001;224:159–68. doi: 10.1016/S0378-5173(01)00760-8. [DOI] [PubMed] [Google Scholar]
- 15.De la Fuente M, Raviña M, Paolicelli P, Sanchez A, Seijo B, Alonso MJ. Chitosan-based nanostructures: a delivery platform for ocular therapeutics. Adv Drug Del Rev. 2010;62:100–17. doi: 10.1016/j.addr.2009.11.026. [DOI] [PubMed] [Google Scholar]
- 16.Rowe RC, Sheskey PJ, Owen SC. Handbook of pharmaceutical excipients. 5th edn. Pharmaceutical Press and American Pharmacists Association; 2006. Electronic version.
- 17.Mandal B, Alexander KS, Riga AT. Sulfacetamide loaded Eudragit® RL100 nanosuspension with potential for ocular delivery. J Pharm Pharmaceut Sci. 2010;13(4):510–23. [PubMed] [Google Scholar]
- 18.Bhagav P, Upadhyay H, Chandran S. Brimonidine tartrate-Eudragit long-acting nanoparticles: formulation, optimization, in vitro and in vivo evaluation. AAPS PharmSciTech. 2011;12(4):1087–101. doi: 10.1208/s12249-011-9675-1. [DOI] [PMC free article] [PubMed] [Google Scholar]
- 19.Ibrahim HK, El-Leithy IS, Makky AA. Mucoadhesive nanoparticles as carrier systems for prolonged ocular delivery of gatifloxacin/prednisolone bitherapy. Mol Pharm. 2010;7(2):576–85. doi: 10.1021/mp900279c. [DOI] [PubMed] [Google Scholar]
- 20.Fessi H, Puisieux F, Devissaguet JP, Ammoury N, Benita S. Nanocapsule formation by interfacial polymer deposition following solvent displacement. Int J Pharm. 1989;55(1):r1–r4. doi: 10.1016/0378-5173(89)90281-0. [DOI] [Google Scholar]
- 21.El-Shabouri MH. Positively charged nanoparticles for improving the oral bioavailability of cyclosporin-A. Int J Pharm. 2002;249:101–08. doi: 10.1016/S0378-5173(02)00461-1. [DOI] [PubMed] [Google Scholar]
- 22.Shegokar R, Singh KK, Müller RH. Production & stability of stavudine solid lipid nanoparticles-From lab to industrial scale. Ibid. 2011;416:461–470. doi: 10.1016/j.ijpharm.2010.08.014. [DOI] [PubMed] [Google Scholar]
- 23.Roland JC, Lembi CA, Morré DJ. Phosphotungstic acid-chromic acid as a selective electron-dense stain for plasma membranes of plant cells. Stain Technol. 1972;47(4):195–200. doi: 10.3109/10520297209116484. [DOI] [PubMed] [Google Scholar]
- 24.Rozier A, Mazuel C, Grove J, Plazonnet B. A novel ion-activated, in-situ gelling polymer for ophthalmic vehicles. Effect on bioavailability of timolol. Int. J. Pharm. 1989;57:163–68. doi: 10.1016/0378-5173(89)90305-0. [DOI] [Google Scholar]
- 25.Miyazaki S, Suzuki S, Kawasaki N, Endo K, Takahashi A, Attwood D. In situ gelling xyloglucan formulations for sustained release ocular delivery of pilocarpine hydrochloride. Int J Pharm. 2001;229(1–2):29–36. doi: 10.1016/S0378-5173(01)00825-0. [DOI] [PubMed] [Google Scholar]
- 26.Abd-Elbary A, El-laithy HM, Tadros MI. Sucrose stearate-based proniosome-derived niosomes for the nebulisable delivery of cromolyn sodium. Ibid. 2008;357:189–98. doi: 10.1016/j.ijpharm.2008.01.056. [DOI] [PubMed] [Google Scholar]
- 27.Higuchi T. Mechanism of sustained action medication. J Pharm Sci. 1963;52:1145–1149. doi: 10.1002/jps.2600521210. [DOI] [PubMed] [Google Scholar]
- 28.Piao H, Ouyang M, Xia D, Quan P, Xiao W, Song Y, Cui F. In vitro–in vivo study of CoQ10-loaded lipid nanoparticles in comparison with nanocrystals. Int J Pharm. 2011;419(1–2):255–9. doi: 10.1016/j.ijpharm.2011.07.016. [DOI] [PubMed] [Google Scholar]
- 29.Denouël J, Keller HP, Schaub P, Delaborde C, Humbert H. Determination of terbinafine and its desmethyl metabolite in human plasma by high-performance liquid chromatography. J Chromatography B. 1995;663:353–359. doi: 10.1016/0378-4347(94)00449-F. [DOI] [PubMed] [Google Scholar]
- 30.El-Laithy HM, Nesseem DI, El-Adly AA, Shoukry M. Moxifloxacin–Gelrite in situ ophthalmic gelling system against photodynamic therapy for treatment of bacterial corneal inflammation. Arch. Pharm. Res. 2011;34(10):1663–1678. doi: 10.1007/s12272-011-1011-5. [DOI] [PubMed] [Google Scholar]
- 31.Asasutjarita R, Thanasanchokpibull S, Fuongfuchat A, Veeranondha S. Optimization and evaluation of thermoresponsive diclofenac sodium ophthalmic in situ gels. Int. J. Pharm. 2011;411:128–135. doi: 10.1016/j.ijpharm.2011.03.054. [DOI] [PubMed] [Google Scholar]
- 32.Bonferoni MC, Chetoni P, Giunchedi P, Rossi S, Ferrari F, Burgalassi S, Caramella C. Carrageenan–gelatin mucoadhesive systems for ion-exchange based ophthalmic delivery: in vitro and preliminary in vivo studies. Eur. J Pharm. Biopharm. 2004;57:465–472. doi: 10.1016/j.ejpb.2003.12.002. [DOI] [PubMed] [Google Scholar]
- 33.Hornig S, Heinze T, Becer CR, Schubert US. Synthetic polymeric nanoparticles by nanoprecipitation. J Mater Chem. 2009;19:3838–40. doi: 10.1039/b906556n. [DOI] [Google Scholar]
- 34.Zimmer A, Kreuter J. Microspheres and nanoparticles used in ocular delivery systems. Adv Drug Del Rev. 1995;16(1):61–73. doi: 10.1016/0169-409X(95)00017-2. [DOI] [Google Scholar]
- 35.Ghorab DM, Amin MM, Khowessah OM, Tadros MI. Colon-targeted celecoxib-loaded Eudragit® S100-coated poly-ε-caprolactone microparticles: preparation, characterization and in vivo evaluation in rats. Drug Del. 2011;18(7):523–35. doi: 10.3109/10717544.2011.595841. [DOI] [PubMed] [Google Scholar]
- 36.Castellanos IJ, Carrasquillo KG, de Jesus LJ, Alvarez M, Griebenow K. Encapsulation of bovine serum albumin in poly(lactide-co-glycolide) microspheres by the solid-in-oil-in-water technique. J Pharm Pharmacol. 2001;53:167–78. doi: 10.1211/0022357011775361. [DOI] [PubMed] [Google Scholar]
- 37.Das S, Suresh PK. Nanosuspension: a new vehicle for the improvement of the delivery of drugs to the ocular surface. Application to amphotericin B. Nanomedicine. 2011;7(2):242–7. doi: 10.1016/j.nano.2010.07.003. [DOI] [PubMed] [Google Scholar]
- 38.Rodriguez M, Vila-Jato JL, Torres D. Design of new multiparticulate system for potential site specific and controlled drug delivery to the colonic region. J Control Rel. 1998;55:67–77. doi: 10.1016/S0168-3659(98)00029-7. [DOI] [PubMed] [Google Scholar]
- 39.Krishnamachari Y, Madan P, Lin S. Development of pH- and time dependent oral microparticles to optimize budesonide delivery to ileum and colon. Int J Pharm. 2007;348:238–47. doi: 10.1016/j.ijpharm.2007.02.015. [DOI] [PubMed] [Google Scholar]
- 40.Atef E, Belmonte AA. Formulation and in vitro and in vivo characterization of a phenytoin self-emulsifying drug delivery system (SEDDS) Eur J Pharm Sci. 2008;35(4):257–263. doi: 10.1016/j.ejps.2008.07.004. [DOI] [PubMed] [Google Scholar]
- 41.Pignatello R, Bucolo C, Spedalieri G, Maltese A, Puglisi G. Flurbiprofen-loaded acrylate polymer nanosuspensions for ophthalmic application. Biomaterials. 2002;23(15):3247–55. doi: 10.1016/S0142-9612(02)00080-7. [DOI] [PubMed] [Google Scholar]
- 42.Kumar N, Jain AK, Singh C, Kumar R. Development, characterization and solubility study of solid dispersion of terbinafine hydrochloride by solvent evaporation method. Asian J Pharm. 2008;2:154–8. doi: 10.4103/0973-8398.43301. [DOI] [Google Scholar]
- 43.Foda NH, El-laithy HM, Tadros MI. Implantable biodegradable sponges: effect of interpolymer complex formation of chitosan with gelatin on the release behavior of tramadol hydrochloride. Drug Dev Ind Pharm. 2007 Jan;33(1):7–17. [DOI] [PubMed]
- 44.Boyer RF. Transitions and relaxations in amorphous and semicrystalline organic polymers and copolymers. In: Mark HF, editor. Encyclopedia of polymer science and technology; vol II. New York: Wiley; 1977. pp. 745–839. [Google Scholar]
- 45.Miller MH, Madu A, Samathanam G, Rush D, Madu CN, Mathisson K, Mayers M. Fleroxacin pharmacokinetics in aqueous and vitreous humors determined by using complete concentration-time data from individual rabbits. Antimicrob Agents Chemother. 1992;36(1):32–8. doi: 10.1128/AAC.36.1.32. [DOI] [PMC free article] [PubMed] [Google Scholar]
- 46.Mayers M, Rush D, Madu A, Motyl M, Miller MH. Pharmacokinetics of amikacin and chloramphenicol in the aqueous humor of rabbits. Antimicrob Agents Chemother. 1991;35(9):1791–8. doi: 10.1128/AAC.35.9.1791. [DOI] [PMC free article] [PubMed] [Google Scholar]
- 47.Giannavola C, Bucolo C, Maltese A, Paolino D, Vandelli MA, Puglisi G, Lee VH, Fresta M. Influence of preparation conditions on acyclovir-loaded poly-d,l-lactic acid nanospheres and effect of PEG coating on ocular drug bioavailability. Pharm Res. 2003;20:584–590. doi: 10.1023/A:1023290514575. [DOI] [PubMed] [Google Scholar]
- 48.Mannermaa E, Vellonen KS, Urtti A. Drug transport in corneal epithelium and blood–retina barrier: emerging role of transporters in ocular pharmacokinetics. Adv Drug Deliv Rev. 2006;58:1136–1163. doi: 10.1016/j.addr.2006.07.024. [DOI] [PubMed] [Google Scholar]
- 49.Jarvinen K, Jarvinen T, Urtti A. Ocular absorption following topical delivery. Adv Drug Deliv Rev. 1995;16:3–19. doi: 10.1016/0169-409X(95)00010-5. [DOI] [Google Scholar]
- 50.Klang S, Abdulrazik M, Benita S. Influence of emulsion droplet surface charges on indomethacin ocular tissue distribution. Pharm Dev Technol. 2000;5:521–532. doi: 10.1081/PDT-100102035. [DOI] [PubMed] [Google Scholar]