Abstract
Sink conditions used in dissolution tests lead to rapid dissolution rates for nanosuspensions, causing difficulties in discriminating dissolution profiles between different formulations. Here, non-sink conditions were studied for the dissolution testing of poorly water-soluble drug nanosuspensions. A mathematical model for polydispersed particles was established to clarify dissolution mechanisms. The dissolution of nanosuspensions with either a monomodal or bimodal size distribution was simulated. In the experimental part, three different particle sizes of indomethacin nanosuspensions were prepared by the wet milling technique. The effects of the dissolution medium pH and agitation speed on dissolution rate were investigated. The dissolution profiles in sink and non-sink conditions were obtained by changing the ratio of sample amount to the saturation solubility. The results of the simulations and experiments indicated that when the sample amount was increased to the saturation solubility of drug, the slowest dissolution rate and the best discriminating dissolution profiles were obtained. Using sink conditions or too high amount of the sample will increase the dissolution rate and weaken the discrimination between dissolution profiles. Furthermore, the low solubility by choosing a proper pH of the dissolution medium was helpful in getting discriminating dissolution profiles, whereas the agitation speed appeared to have little influence on the dissolution profiles. This discriminatory method is simple to perform and can be potentially used in any nanoproduct development and quality control studies.
KEY WORDS: dissolution modeling, dissolution testing, nanosuspensions, non-sink conditions, wet milling
INTRODUCTION
In the last decades, nanoparticulate technology has undergone rapid development in the area of novel drug delivery systems, such as liposomes, nanoparticles, nanomicelles, and nanocrystals (1,2). Among them, nanocrystals are preferred by the pharmaceutical industry because of their easier commercialization, relatively cheaper cost, larger drug loading capability, and none or fewer carrier-associated side effects (3). So far, approximately 20 products are under clinical trials (4); five nanocrystal products are on the market (5), and another formulation (INVEGA® SUSTENNA™) was approved by the US Food and Drug Administration in 2009. The most important characteristics of nanocrystals for poorly water-soluble drugs are improved saturation solubility and a highly increased dissolution velocity under traditional dissolution testing conditions (6). For particle sizes less than 2 μm, the hyperbolic relationship between the size and dissolution rate is significantly pronounced. At a particle size below 1 μm, the dissolution is very fast and complete in a few minutes (6).
Dissolution testing is an important analytical tool in drug product development, manufacturing, and quality assessment, playing various roles during the life cycle of a dosage form. The objectives of dissolution testing include: (1) characterization and formulation screening of active pharmaceutical ingredient (API), (2) establishing the in vitro–in vivo relationship or correlation, and (3) quality control to keep the product consistency (7).
As the number of nanoformulations increases, more attention needs to be paid to their dissolution testing methods. In traditional dissolution methods, sink conditions are recommended. However, this makes the dissolution rate very fast and experiments problematic for nanoparticles. For instance, the initial dissolution profiles are difficult to determine, since nanoparticle dissolution can be completed in a few minutes. Moreover, in our previous study (8), nearly the same dissolution profiles were observed for nanosuspensions with different particle sizes. Thus, discriminating dissolution profiles cannot be obtained. Usually, dissolution tests focus on the comparison of nanoformulations and raw materials (9–11). Few dissolution methods exist to discriminate between nanoformulation variants for product development and quality control. Therefore, developing a method for discriminating dissolution profiles between nanosuspensions with different particle sizes was aimed at in this study.
Presently, some novel analytical methods for dissolution testing of nanosuspensions have been reported. Turbidimetry method depends on the real-time monitoring of small particle dissolution by light scattering (12,13). However, the particle size and initial concentration of samples are limited in range. The use of potentiometric sensors (14) and solution calorimetry (15) has also been investigated. Both methods are real-time and in situ measurements, which avoid the interference of undissolved particles. Moreover, the response time of the sensor is fast enough to monitor and detail the fast dissolution process. But for the former method, a new set of sensors for each API should be preconditioned. For the solution calorimetry method, a long equilibration time is needed and all heat produced and consumed by all processes needs to be considered. Dialysis method is another option, but the dialysis membrane is considered to be an additional barrier to the dissolution process, and it is possible that the apparent release would be controlled by the permeation through the dialysis bags and not by the dissolution itself (16).
The Federation International Pharmaceutique (FIP)/American Association of Pharmaceutical Scientists (AAPS) dissolution testing guidelines point out that compendial apparatus and methods should be used as the first approach in drug development. The unnecessary proliferation of equipment and method is to be avoided (16,17). In this study, the compendial paddle apparatus was used, which is a recommended way to perform dissolution tests on suspensions by the FIP/AAPS (17). Unlike in the recommendation, non-sink conditions were studied in order to decrease the dissolution rate and get discriminating dissolution results for the nanosuspensions. A mathematical model was established to estimate the dissolution profiles and clarify the dissolution mechanisms of nanosuspensions in sink and non-sink conditions. Experimentally, indomethacin was used as a model drug and nanosuspensions were prepared by the wet milling method. The factors influencing nanosuspension dissolution, including the pH of the dissolution medium, agitation speed, and sample amount ratio, were studied.
MATERIALS AND METHODS
Theoretical Considerations
The mass flux J around a spherical object with a diffusion layer thickness h is defined by Eq. (1) according to the so-called shrinking-core model (18).
 |
1 |
where D is the diffusion coefficient of the drug in water, R is the radius of the particle, r is the location in spherical coordinates, cs is the saturation solubility of the drug, and cb is the bulk concentration of the drug. In perfect sink conditions, cb would be zero.
Assuming h = R, i.e., the diffusion layer thickness is similar to the particle radius, and solving at r = R, the following Eq. (2) for the mass flux is obtained. This assumption is based on the low Reynolds number for nanoparticles and the Frössling correlation (18,19). The same assumption has also been used for drug particle systems (20,21).
 |
2 |
The drug dissolution rate can be related to the rate of particle size reduction. This is easy to obtain from above and is
 |
3 |
where ρ is the density of the drug particles.
Equation (3) is simple to solve numerically, even for a large number of individual particles with different sizes (Ri). To evaluate the effect of non-sink conditions and a non-zero value for the cb, a ratio (φ) of drug used in the dissolution test to the saturation solubility of drug is introduced as follows:
 |
4 |
 |
5 |
 |
6 |
 |
7 |
where W is the mass of the particles in the system at a given time point, W0 is the total drug mass in the system, and V is the volume of the system. The mass was calculated as a sum of the masses of particles, which were initially randomly created on a normal distribution (average value R0 and standard deviation ΔR).
The equations were evaluated for a simulated normal size distribution for 10,000 particles for 1,800 time steps (1 step = 1 s, total simulation time was 30 min). In all calculations, D was assumed to be 2 × 10⁻⁶ cm2s−1, cs was 1 μg/ml, and ρ was 1.37 g/cm3. These values roughly correspond to poorly soluble small molecules such as indomethacin, but are used here more or less arbitrarily to model any poorly soluble compound. Parameters for the simulations were φ and R0. Two different radiuses were used, 200 and 400 nm. To model the bimodal size distribution particle populations were simulated as above, but at the same time 5% of particles with twice as large a radius were added to the overall population. All calculations were done using standard mathematical software (Matlab) by numerically evaluating the Eq. (7) using the Euler method for all the simulated particles in each time step. Equation (6) was used to keep track of the non-sink conditions during the simulation.
In contrast to the conventional dissolution in sink conditions, the dissolution profiles were evaluated based on the idea that the dissolved particle concentration (cb) was divided by the maximum concentration value (cmax) that could be dissolved in the dissolution medium (Eq. (8)).
 |
8 |
If φ > 1, the maximum concentration value (cmax) is equal to the saturation solubility (cs), but if φ ≤ 1, it is equal to the total drug amount introduced to the dissolution medium (ctot). These calculations are similar as those recently used by Wang et al. (22), who considered the time to full dissolution or the time to saturation. Here, when φ ≤ 1, the system is behaving as in normal dissolution test and in the case of φ > 1 the system is moving toward saturation state and saturation kinetics are followed.
Materials
Indomethacin was obtained from Hawkins (Minneapolis, MN, USA), Poloxamer 188 (Pluronic F68) was from BASF Co. (Ludwigshafen, Germany), and phosphoric acid (85%, Riedel-de Haën, Seelze, Germany) and acetonitrile (high-performance liquid chromatography (HPLC) grade, VWR International, Pennsylvania, USA) were used for HPLC analysis. Hydrochloric acid (Merck KGaA, Darmstadt, Germany), sodium chloride (Sigma-Aldrich, Steinheim, Germany), potassium hydrogen phthalate (Sigma, St. Louis, MO, USA), and sodium hydroxide (Sweden) were used for the preparation of dissolution media. Ethanol was obtained from Altia Co. (Helsinki, Finland). Ultrapurified water produced by a Millipore® water system (Millipore, Molsheim, France) was used in all experiments.
Preparation of Suspensions with Different Particle Sizes
The indomethacin suspensions were prepared by the wet-milling technique. Briefly, 0.6 g of stabilizer F68 was dissolved in 5 ml of water. Then, 1 g of indomethacin was dispersed in the stabilizer solution. The optimal stabilizer concentration (60% of the drug weight) used here is based on our previous publication (8). The drug suspensions were put in the milling bowl containing a certain amount of milling pearls (zirconium oxide). To obtain suspensions with different particle sizes but the same chemical components, different sized milling pearls (diameters 1, 5, and 10 mm) were used. The other parameters, such as the mass ratio of the drug to the stabilizer and milling time, were kept the same. Two milling bowls were fixed in a planetary milling machine (Pulverisette 7 Premium, Fritsch Co., Germany). The grinding was performed with different speeds (1,100, 1,000, and 850 rpm), corresponding to the milling pearl sizes of 1, 5, and 10 mm, for 10 cycles (one milling cycle takes 3 min). After each milling cycle, there was a 15-min pause to cool down the milling bowls. The suspensions were separated from the milling pearls and collected after the grinding.
Particle Size Measurements
The average particle size and size distribution of indomethacin suspensions were measured by dynamic light scattering (DLS) using a Malvern Zetasizer 3000HS (Malvern Instrument, Malvern, UK). Polydispersity index (PI) was used to describe the width of the particle size distribution. Prior to measurements, samples were sonicated to disperse the particles for 3 min and diluted by saturated indomethacin solution containing 0.1 wt.% of the stabilizer F68. Saturated solutions were prepared by filtration of drug suspensions after 24 h of shaking equilibration, then through a 0.22-μm filter membrane (Pall Co., Mexico). The final concentration of drug particles for size measurement was about 50–100 μg/ml. The dispersant refractive index was set as 1.33. The size measurements were repeated three times for each sample.
Content Determination
After milling and collecting of nanosuspensions, the true content of indomethacin in nanosuspensions is different with the theoretical one (0.2 g/ml). To get the true indomethacin concentration, a certain amount of nanosuspensions were dissolved in ethanol and diluted by ethanol/water (1:1, v/v). The content of indomethacin was analyzed by HPLC.
Solubility
The saturation solubility of the indomethacin suspensions after milling was carried out in 20 ml hydrochloric acid medium (pH 1.2) and phthalate buffer (pH 5.0) at 37°C. A sufficient amount of suspensions (3 μl) was put into the medium. After shaking for 24 h, the samples were centrifuged, and the indomethacin content in the supernatant was analyzed by HPLC.
Dissolution Testing of Suspensions
Dissolution profiles of the suspensions were determined by the paddle method using a dissolution system Erweka DT-06 (Heusentamm, Germany) (8,23). Several experimental parameters, including the pH of the dissolution medium (hydrochloric acid medium of pH 1.2 and phthalate buffer of pH 5.0), agitation speed (50 and 120 rpm), and sample amount ratio were investigated. Here, the sample amount ratio (φ) had the same definition with the one in the simulation part. The values of φ including 1/4, 1, and 3 were studied. A certain amount of sample was transferred into the dissolution medium of 600 ml at 37°C. At special time intervals (0.5, 1, 2, 4, 6, 15, and 30 min), 5 ml of dissolution medium was withdrawn and replaced with the same volume of pre-thermostated fresh medium. The sample was filtered by Acrodisc® syringe filters with 0.2 μm GHP membrane (PALL Life Science, Ann Arbor, MI, USA) to remove the undissolved particles from samples. The first 4.5 ml of filtrate was discarded. The filtrate was analyzed by HPLC. To select an optimal separation method, centrifugation method was used and compared for samples at 13,000 rpm for 8 min. Each dissolution experiment was performed at least three times, and the average values and standard deviations were calculated.
HPLC Analysis
The quantification of indomethacin was achieved by using an HPLC instrument (Agilent 1,100 series, Agilent technologies, Germany) with a Gemini-NX 3 μ C18 110A (100 × 4.6 mm) column (Phenomenex Co., Torrance, CA, USA) (23). Samples (20 μl) were injected into the column. The mobile phase consisting of acetonitrile and 0.2% phosphoric acid in water (pH 2.0) (65:35, v/v) was used at a flow rate of 1 ml/min. The UV detection was at a wavelength of 320 nm. The assay was linear (r2 = 0.9997) in the concentration range of 0.05–10.34 μg/ml.
Statistical Methods
One-way analysis variance (ANOVA) plus Tukey’s test was used to compare the significant differences of dissolution profiles at the same time points. In this model, the nanosuspension sample was an independent variable, and the dissolved percent was a dependent variable. For these ANOVA-based methods, Origin 7.5 for Windows was employed.
RESULTS
Simulations
The dissolution curves of nanoparticles with radius 400 nm for various φ values were simulated based on the Eqs. (1–7) shown in Fig. 1. As can be seen, the slowest dissolution rate occurred at φ = 1, and the dissolution rate was faster both at above and below this value.
Fig. 1.
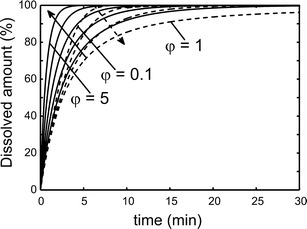
Simulated drug dissolution profiles for spherical nanoparticles with R 0 = 400 nm and ΔR = 0.15R 0. Values for φ were 0.1, 0.5, 0.8, and 1 (dashed lines) as well as 1.2, 1.5, 2, 3, and 5 (solid lines). The arrows indicate the direction of increasing φ. For φ > 1, dissolved amount (%) = C b/C s; for φ ≤ 1, dissolved amount (%) = C b/C tot
Particle size distributions show how the mass fraction was changed during a simulated dissolution test (Fig. 2). For a sample with an average radius of 200 nm (Fig. 2 left), all particles vanished quickly (after around 1.5 min) in sink conditions (φ = 0.1). With an increasing sample amount ratio, a longer dissolution time was needed to complete the dissolution process. The condition in which the sample amount was three times higher than the drug solubility (φ = 3), only a part of the particles was dissolved and the average particle size was decreased. The size distribution curves at 1.5, 3, 7.5, and 15 min were overlapping, implying that the dissolution was stopped in 1.5 min. For a sample with an average radius of 400 nm (Fig. 2 right), the dissolution process took less than 7.5 min in sink conditions and reached a plateau phase at ca. 3 min in the case of φ = 3, while more than 15 min was needed when φ = 1.
Fig. 2.
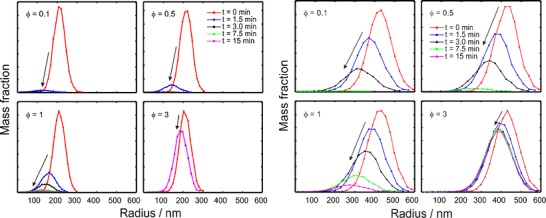
Mass weighted graphs of particle populations during the dissolution simulations. Parameters for the simulation were ΔR = 0.15R 0 and R 0 = 200 nm (left) or 400 nm (right). The arrows indicate the curves at later time points
The nanosuspensions with two peaks of the particle size distribution are common phenomenon (24). Therefore, the changes in the bimodal size distribution with time are simulated (Fig. 3). As with the monomodal case, the slowest dissolution rate occurred at φ = 1. At lower drug amounts (φ < 1), the smaller nanoparticles vanished almost instantly and the larger particles dissolved later. At larger drug amounts (φ = 3), the dissolution of smaller particles was stopped in 1.5 min, and the big particles was not changed.
Fig. 3.
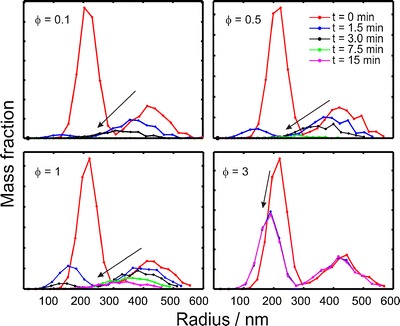
Mass weighted graphs of particle populations during the dissolution simulations. Parameters for the simulation were ΔR = 0.15R 0 and R 0 = 200 nm (95% of the population)/400 nm (5% of the population)
The drug dissolution profiles for spherical nanoparticles with different fractions of the larger particles were simulated at φ = 1 in Fig. 4. The dissolution rate was slowed down as the fraction of larger particles was increased. Already the presence of 2% of larger particles decreased the dissolution rate, and above 30% of larger particles the results were almost identical to the pure 400-nm particle radius case. It is noteworthy that the dissolution curve for the 2% and 5% cases had a quick jump to >80% release, followed by an almost apparent flat release for the rest of the simulation time.
Fig. 4.
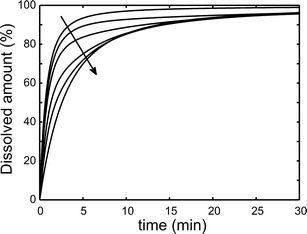
Simulated drug dissolution profiles for spherical nanoparticles with R 0 = 200 nm/400 nm and ΔR = 0.15R 0 when φ = 1. The number fraction of the larger particles was 0%, 2%, 5%, 15%, 30%, and 100%. The arrow indicates the direction of increasing fraction of large particles
The curves of time to achieve 90% of the maximum extent of dissolution/saturated solubility for the 200 nm, 400 nm, and bimodally distributed particles as a function of φ are shown in Fig. 5. The longest time to achieve 90% of the maximum extent of dissolution for all three samples was observed when φ = 1. When the sample amount was below the solubility of the drug (φ < 1), the bimodal case had dissolution rates somewhere between the rates of the two subpopulations. At higher concentrations (φ > 1), the trend of bimodal curve was close to the sample with the radius of 200 nm.
Fig. 5.
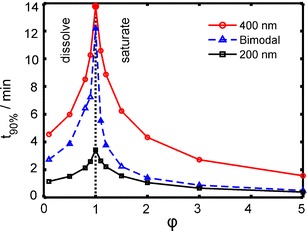
Plots of simulated times to achieve 90% of dissolution/saturated solubility for 200 nm, 400 nm (particle radius), and bimodally distributed particles (5% larger particles) as a function of φ
Experimental Part
Preparation and Characterization of Suspensions
Nanosuspensions with particle sizes of 340 nm (sample A) and 560 nm (sample B) and a microsuspension with a particle size of 1,300 nm (sample C) were obtained after grinding, depending on the size of milling balls used (Table I). With a decreasing milling ball size, the particle size and PI were reduced. In other words, smaller and more homogenous particles in suspensions were produced when smaller milling balls were used, since the large contact surface area between milling balls and the drug material is beneficial to milling (25). Moreover, the indomethacin particles had spherical morphology and kept their crystalline state after milling according to our previous research (8).
Table I.
Particle Size, Polydispersity Index, and Solubility of Indomethacin Nanosuspensions Milled with Different Sized Milling Balls (n = 3)
| Milling ball diameter (mm) | Size (nm) | PI | Solubility (μg/ml) | |
|---|---|---|---|---|
| pH 1.2 | pH 5.0 | |||
| 1 | 340 ± 4 | 0.24 ± 0.06 | 1.29 ± 0.03 | 21.23 ± 0.19 |
| 5 | 560 ± 11 | >0.7 | 1.23 ± 0.06 | 19.25 ± 0.39 |
| 10 | 1,300 ± 111 | >0.7 | 1.15 ± 0.01 | 18.06 ± 0.43 |
PI polydispersity index
The solubility of indomethacin suspensions at different pH values are shown in Table I. The solubility of indomethacin was significantly increased with higher pH, since indomethacin is a weak organic acid, with a pKa = 4.5. Furthermore, for the three kinds of suspensions in the same medium, the solubility from small particles was slightly higher than from large particles. It can be explained by the extreme curvature of the particles leading to an increase in surface tension and solubility (26).
Dissolution Studies
Effect of Dissolution Medium (pH)
The effect of different pH on dissolution profiles of nanosuspensions with three different particle sizes is presented in Fig. 6. The sample amount used here is close to its solubility. The lower dissolution rate and more discriminating dissolution profiles could be seen at pH 1.2.
Fig. 6.
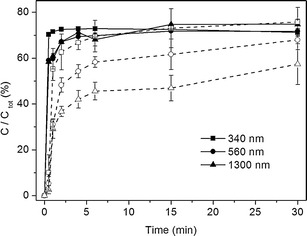
Dissolution profiles of indomethacin suspensions at pH 1.2 (open symbols, dash line) and 5 (closed symbols, solid line) at 120 rpm and 37°C. The tests were done with the suspension amount ratio corresponding to φ = 1 (n = 3–6)
Effect of Agitation Speed
The effect of the paddle agitation on suspension dissolution at φ = 1 was investigated (Fig. 7). No significant difference was seen between the dissolution profiles of same samples under two agitation conditions (50 and 120 rpm), and the dissolution profiles showed good similarity and repeatability.
Fig. 7.
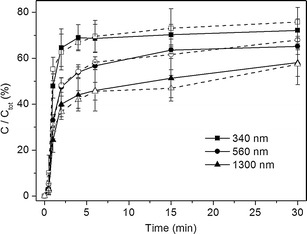
Dissolution profiles of indomethacin suspensions at the agitation speed of 120 rpm (open symbols, dash line) and 50 rpm (closed symbols, solid line) at pH 1.2 and 37°C. The tests were done with the suspension amount ratio corresponding to φ = 1 (n = 3–6)
Effect of Suspension Amount Ratio
Dissolution profiles were obtained at varying suspension amount ratios when the dissolution medium and agitation speed were fixed to pH 1.2 and 120 rpm (Fig. 8). Comparing the three figures, the slowest dissolution rate could be found when φ = 1, which is in accordance with the simulation results. Furthermore, the dissolution rate increased with decreasing particle size.
Fig. 8.
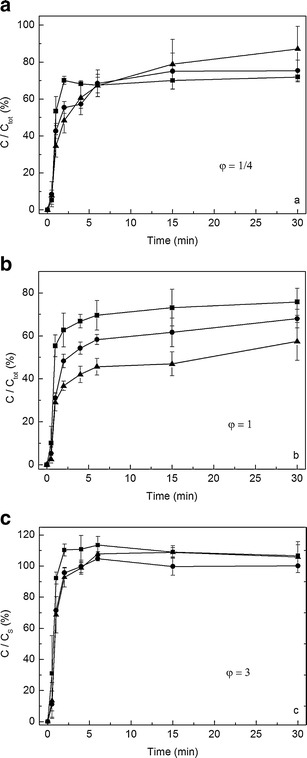
Dissolution profiles of different suspension amounts (φ) when the dissolution medium and agitation speed were fixed at pH 1.2 and 120 rpm at 37°C. a φ = 1/4, b φ = 1, c φ = 3. Square, round, and triangle symbols stand for the suspensions with particle size 340, 560, and 1,300 nm, respectively (n = 3–6)
Whether the difference of the dissolved amount at each time point was significant was analyzed using Tukey’s tests (Table II). For φ = 1, the three dissolution curves at 2, 4, and 6 min showed statistically significant difference. In other time points, there are differences between the certain samples, e.g., the difference appeared between A–B and A–C group at 1 min. No significant difference was got at the first time point (0.5 min). For the sink conditions and φ = 3, less significant differences or no differences could be seen (Table II). A significant difference in the dissolved amount at 2 min was shown between A–B but not B–C.
Table II.
The Pair Comparisons Between Dissolution Profiles at the Same Time Point Using ANOVA Method with Tukey’s Tests
| Time points (min) | A–B | B–C | A–C | |
|---|---|---|---|---|
| φ = 1 | 0.5 | - | - | - |
| 1 | *** | - | *** | |
| 2 | ** | * | *** | |
| 4 | ** | ** | *** | |
| 6 | ** | ** | *** | |
| 15 | - | * | ** | |
| 30 | - | - | ** | |
| φ = 1/4 | 1 | - | - | * |
| 2 | * | - | ** | |
| 4 | - | - | - | |
| 6 | - | - | - | |
| φ = 3 | 1 | - | - | * |
| 2 | * | - | ** | |
| 4 | - | - | - | |
| 6 | - | - | - |
A, B, and C stand for the nanosuspensions with the particle sizes of 340, 560, and 1,300 nm, respectively
*Significance level is 0.05
**Significance level is 0.01
***Significance level is 0.001
-means no significant difference
DISCUSSION
In the European Pharmacopeia, sink conditions are defined as a volume of dissolution medium that is at least three to ten times the saturation volume. In other words, if the maximum concentration of the sample in the dissolution medium is less than 1/3 times the saturation solubility, i.e., φ < 1/3, it is in sink conditions. Otherwise, it is in non-sink conditions.
Mathematical simulation is a fast way to predict and clarify the process and mechanism of dissolution tests. Based on the simulations, it was found out that the dissolution rate is the slowest exactly at the solubility limit, e.g., when φ = 1 (Fig. 1). Jamzad et al. (27) reported that the slower dissolution rate was obtained when the low Cs/C ratio for higher dose was used in dissolution medium. Nokhodchi et al. (28) reported that the dissolution rate of indomethacin in the initial 10 min was decreased with increasing of the drug concentration in a liquid medication. Below this value, the dissolution rate was increased because of the steeper concentration gradient as a driving force for dissolution according to the Noyes–Whitney equation (29). Above this value, the dissolution rate of nanosuspensions was also increased. The reason is explained in Figs. 2 and 3; a portion of smaller particles dissolve quickly and the dissolved particles make the dissolution medium saturated in a short time. In Fig. 5, the release from the bimodal sample was similar to the release from the smaller size fraction (200 nm) when φ > 1 since the dissolution was mostly due to the small particles and the presence of the larger particles did not make a difference for the dissolution rate, which is also shown in Fig. 3.
In Fig. 4, the dissolution rate in the simulations was slowed down as the fraction of larger particles was increased. The samples with the fraction of 2% and 5% large particles had a quick jump to >80% release, then followed by an almost apparent flat release for the rest of the simulation time. This is due to the rapid dissolution of the smaller particle population and subsequent slow release from the larger particle population. It is noteworthy that the presence of 5% of large particles would already cause a remarkable shift in the apparent size of the particles in practice. This is due to experimental methods such as DLS, which weights its results according to R6. Therefore, a large subpopulation of smaller particles can easily evade detection in DLS.
In conventional dissolution testing, there are two main methods to remove the undissolved particles: centrifugation and filtration with, e.g., a syringe filter. Both methods have their disadvantages (Table III) (30,31). In our experiments, serious interactions were found between indomethacin and certain filter materials used in syringe filters, e.g., 0.1 μm Supor® membrane (25 mm), 0.2 μm polyvinylidene fluoride, and nylon membrane from PALL Corporation. Eventually, a syringe filter with a GHP membrane showed reasonably low loss of indomethacin and could be used for the dissolution studies. The centrifugation method was also tested, but further dissolution and interactions during the centrifugation procedure were seen (data not shown). Accordingly, filtering was selected to be used in all the dissolution tests.
Table III.
The Disadvantages of the Separation Methods: Syringe Filter and (Ultra)centrifugation for Nanosuspensions
| Syringe filter | (Ultra)centrifugation |
|---|---|
| Serious interaction between drug and filter membrane | Potential absorption of drug on centrifuge tube |
| Particles smaller than the pore size of filter membrane can pass through the filter | High-speed, long-time, and potential high-temperature results in the further dissolution during the centrifuge process |
The dissolution profiles will not be discriminating if the dissolution medium is inappropriate (32). According to the pKa of indomethacin and solubility results (Table I), dissolution media with pH 1.2 and 5 were chosen for comparison (Fig. 6). The dissolution rate at pH 5 was faster than at pH 1.2, which is attributed to the relatively high solubility (more than ten times in contrast to the solubility at pH 1.2). A directly proportional relationship between the solubility and dissolution rate of the drug was reported previously (28). A high pH for indomethacin results in fast dissolution, which masks the particle size differences (33). Based on the experimental results, to get discriminative dissolution results, dissolution environment with low solubility is needed.
Theoretically, agitation can improve the rate of drug particle surface renewal (34) and decrease the thickness of the stagnant diffusion layer. Thus, faster agitation could improve the drug dissolution rate and lead to a less discriminating dissolution. This theory was confirmed by experiments in sink conditions by Gupta et al. (35). However, no large differences were seen in our experiments performed in non-sink conditions (Fig. 7). The lack of any effect by increased agitation rate is due to the small size of the particles, which causes the stagnant water layer around the particles to be independent on the mixing speed (36).
The effect of the sample amount ratio (φ) on the dissolution profiles was shown in Fig. 8. The nanosuspension A has a smaller particle size and also narrower size distribution, producing a higher dissolution rate compared to the samples B and C. As expected based on the simulation results, the dissolution testing indicated that the most discriminating dissolution profiles were found at the slowest dissolution rate and at conditions corresponding to φ = 1. For the sink conditions and φ = 3, differences between the samples were less significant than in the case of φ = 1 (Table II). The discrimination between the dissolution profiles in sink condition is weak, since the particle dissolution is very rapid, which masks the difference of samples and prevents the discrimination of dissolution profiles (27). The same weak discrimination will be found if the value of φ is larger than 1 because the high dissolution rate produces by a portion of smaller particles and the large particles do not affect the dissolution.
CONCLUSIONS
Both mathematical simulations and experiments were carried out to obtain discriminating dissolution profiles of nanosuspensions. Based on these data, we conclude that when the sample amount is around the solubility of the drug in the medium, the slowest dissolution rate and the most discriminating dissolution curves can be obtained. This condition applies to nanoparticles with various particle sizes and either monomodal or bimodal size distributions. Using sink conditions or too high amount of the sample will increase the dissolution rate and weaken the discrimination between dissolution profiles. The results from the experimental part of this study confirmed the simulation results. Furthermore, a low-solubility environment controlled by the medium pH was helpful to produce discriminating dissolution profiles, but the influence of the agitation speed on dissolution profiles of nanoparticles was small. Compared to other methods for discriminating nanosuspension dissolution rates, this method is based on the compendial apparatus, is simple to operate, and does not need other accessories. This method is a potential approach for any nanoproduct in development and quality control.
ACKNOWLEDGMENTS
We acknowledge the financial support from Orion Pharma and China Scholarship Council. We thank Roy Siddall for providing language help.
REFERENCES
- 1.Sharma P, Garg S. Pure drug and polymer based nanotechnologies for the improved solubility, stability, bioavailability and targeting of anti-HIV drugs. Adv Drug Deliv Rev. 2010;62:491–502. doi: 10.1016/j.addr.2009.11.019. [DOI] [PubMed] [Google Scholar]
- 2.Chen H, Khemtong C, Yang X, Chang X, Gao J. Nanonization strategies for poorly water-soluble drugs. Drug Discov Today. 2011;16:354–60. doi: 10.1016/j.drudis.2010.02.009. [DOI] [PubMed] [Google Scholar]
- 3.Date AA, Patravale VB. Current strategies for engineering drug nanoparticles. Curr Opin Colloid Interface Sci. 2004;9:222–35. doi: 10.1016/j.cocis.2004.06.009. [DOI] [Google Scholar]
- 4.Müller RH, Keck CM. Twenty years of drug nanocrystals: where are we, and where do we go? Eur J Pharm Biopharm. 2012;80:1–3. doi: 10.1016/j.ejpb.2011.09.012. [DOI] [PubMed] [Google Scholar]
- 5.Van Eerdenbrugh B, Van den Mooter G, Augustijns P. Top-down production of drug nanocrystals: nanosuspension stabilization, miniaturization and transformation into solid products. Int J Pharm. 2008;364(1):64–75. doi: 10.1016/j.ijpharm.2008.07.023. [DOI] [PubMed] [Google Scholar]
- 6.Müller RH, Peters K. Nanosuspensions for the formulation of poorly soluble drugs I. Preparation by a size-reduction technique. Int J Pharm. 1998;160(2):229–37. doi: 10.1016/S0378-5173(97)00311-6. [DOI] [Google Scholar]
- 7.Krishna R, Yu L. Biopharmaceutics applications in drug development. 3. New York: Springer; 2008. [Google Scholar]
- 8.Liu P, Rong X, Laru J, Van Veen B, Kiesvaara J, Hirvonen J, Laaksonen T, Peltonen L. Nanosuspensions of poorly soluble drugs: preparation and development by wet milling. Int J Pharm. 2011;411:215–22. doi: 10.1016/j.ijpharm.2011.03.050. [DOI] [PubMed] [Google Scholar]
- 9.Ambrus R, Kocbek P, Kristl J, Sibanc R, Rajkó R, Szabó-Révész P. Investigation of preparation parameters to improve the dissolution of poorly water-soluble meloxicam. Int J Pharm. 2009;381(2):153–9. doi: 10.1016/j.ijpharm.2009.07.009. [DOI] [PubMed] [Google Scholar]
- 10.Ganta S, Paxton JW, Baguley BC, Garg S. Formulation and pharmacokinetic evaluation of an asulacrine nanocrystalline suspension for intravenous delivery. Int J Pharm. 2009;367:179–86. doi: 10.1016/j.ijpharm.2008.09.022. [DOI] [PubMed] [Google Scholar]
- 11.Sylvestre JP, Tang MC, Furtos A, Leclair G, Meunier M, Leroux JC. Nanonization of megestrol acetate by laser fragmentation in aqueous milieu. J Contr Release. 2011;149(3):273–80. doi: 10.1016/j.jconrel.2010.10.034. [DOI] [PubMed] [Google Scholar]
- 12.Tucker CJ. Real time monitoring of small particle dissolution by way of light scattering. US Patent; 2004.
- 13.Crisp MT, Tucker CJ, Rogers TL, Williams RO, III, Johnston KP. Turbidimetric measurement and prediction of dissolution rates of poorly soluble drug nanocrystals. J Contr Release. 2007;117(3):351–9. doi: 10.1016/j.jconrel.2006.11.011. [DOI] [PubMed] [Google Scholar]
- 14.Peeters K, De Maesschalck R, Bohets H, Vanhoutte K, Nagels L. In situ dissolution testing using potentiometric sensors. Eur J Pharm Sci. 2008;34:243–9. doi: 10.1016/j.ejps.2008.04.009. [DOI] [PubMed] [Google Scholar]
- 15.Kayaert P, Li B, Jimidar I, Rombaut P, Ahssini F, Van den Mooter G. Solution calorimetry as an alternative approach for dissolution testing of nanosuspensions. Eur J Pharm Biopharm. 2010;76(3):507–13. doi: 10.1016/j.ejpb.2010.09.009. [DOI] [PubMed] [Google Scholar]
- 16.Bhardwaj U, Burgess DJ. A novel USP apparatus 4 based release testing method for dispersed systems. Int J Pharm. 2010;388:287–94. doi: 10.1016/j.ijpharm.2010.01.009. [DOI] [PubMed] [Google Scholar]
- 17.Siewert M, Dressman J, Brown CK, Shah VP. FIP/AAPS guidelines to dissolution/in vitro release testing of novel/special dosage forms. AAPS PharmSciTech. 2003;4(1):article 7. [DOI] [PMC free article] [PubMed]
- 18.Fogler HS. Elements of chemical reaction engineering. 3. Upper Saddle River: Prentice Hall PTR; 1999. [Google Scholar]
- 19.Frössling N. Über die Verdunstung fallender Tropfen. Gerl Beitr Geophys. 1938;52:170–216. [Google Scholar]
- 20.Higuchi WI, Hiestand EN. Dissolution rates of finely divided drug powders I. Effect of a distribution of particle sizes in a diffusion-controlled process. J Pharm Sci. 1963;52:67–71. doi: 10.1002/jps.2600520114. [DOI] [PubMed] [Google Scholar]
- 21.Hintz RJ, Johnson KC. The effect of particle size distribution on dissolution rate and oral absorption. Int J Pharm. 1989;51:9–17. doi: 10.1016/0378-5173(89)90069-0. [DOI] [Google Scholar]
- 22.Wang Y, Abrahamsson B, Lindfors L, Brasseur JG. Comparison and analysis of theoretical models for diffusion-controlled dissolution. Mol Pharm. 2012;9(5):1052–66. doi: 10.1021/mp2002818. [DOI] [PubMed] [Google Scholar]
- 23.Laaksonen T, Liu P, Rahikkala A, Peltonen L, Kauppinen EI, Hirvonen J, Järvinen K, Raula J. Intact nanoparticulate indomethacin in fast-dissolving carrier particles by combined wet milling and aerosol flow reactor methods. Pharm Res. 2011;28(10):2403–11. doi: 10.1007/s11095-011-0456-z. [DOI] [PubMed] [Google Scholar]
- 24.Cerdeiraa AM, Mazzottib M, Ganderc B. Miconazole nanosuspensions: influence of formulation variables on particle size reduction and physical stability. Int J Pharm. 2010;396:210–8. doi: 10.1016/j.ijpharm.2010.06.020. [DOI] [PubMed] [Google Scholar]
- 25.Peltonen L, Hirvonen J. Pharmaceutical nanocrystals by nanomilling: critical process parameters, particle fracturing and stabilization methods. J Pharm Pharmacol. 2010;62(11):1569–79. doi: 10.1111/j.2042-7158.2010.01022.x. [DOI] [PubMed] [Google Scholar]
- 26.Dolenc A, Kristl J, Baumgartner S, Planinsek O. Advantages of celecoxib nanosuspension formulation and transformation into tablets. Int J Pharm. 2009;376:204–12. doi: 10.1016/j.ijpharm.2009.04.038. [DOI] [PubMed] [Google Scholar]
- 27.Jamzad S, Fassihi R. Role of surfactant and pH on dissolution properties of fenofibrate and glipizide—a technical note. AAPS PharmSciTech. 2006;7(2):Article 33. [DOI] [PMC free article] [PubMed]
- 28.Nokhodchi A, Javadzadeh Y, Siahi-Shadbad MR, Barzegar-Jalali M. The effect of type and concentration of vehicles on the dissolution rate of a poorly soluble drug (indomethacin) from liquisolid compacts. J Pharm Pharm Sci. 2005;8(1):18–25. [PubMed] [Google Scholar]
- 29.Agata Y, Iwao Y, Miyagishima A, Itai S. Novel mathematical model for predicting the dissolution profile of spherical particles under non-sink conditions. Chem Pharm Bull. 2010;58(4):511–5. doi: 10.1248/cpb.58.511. [DOI] [PubMed] [Google Scholar]
- 30.Anhalt K, Geissler S, Harms M, Weigandt M, Fricker G. Development of a new method to assess nanocrystal dissolution based on light scattering. Pharm Res. 2012;29(10):2887–901. doi: 10.1007/s11095-012-0795-4. [DOI] [PubMed] [Google Scholar]
- 31.Dolenc A, Kristl J, Baumgartner S, Planinšek O. Advantages of celecoxib nanosuspension formulation and transformation into tablets. Int J Pharm. 2009;376:204–12. doi: 10.1016/j.ijpharm.2009.04.038. [DOI] [PubMed] [Google Scholar]
- 32.Van Eerdenbrugh B, Froyen L, Van Humbeeck J, Martens JA, Augustijnsa P, Van den Mooter G. Drying of crystalline drug nanosuspensions—the importance of surface hydrophobicity on dissolution behavior upon redispersion. Eur J Pharm Sci. 2008;35:127–35. doi: 10.1016/j.ejps.2008.06.009. [DOI] [PubMed] [Google Scholar]
- 33.Limnell T, Heikkilä T, Santos HA, Sistonen S, Hellstén S, Laaksonen T, Peltonen L, Kumar N, Murzin DY, Louhi-Kultanen M, Salonen J, Hirvonen J, Lehto VP. Physicochemical stability of high indomethacin payload ordered mesoporous silica MCM-41 and SBA-15 microparticles. Int J Pharm. 2011;416(1):242–51. doi: 10.1016/j.ijpharm.2011.06.050. [DOI] [PubMed] [Google Scholar]
- 34.Heng D, Cutler DJ, Chan HK, Yun J, Raper JA. What is a suitable dissolution method for drug nanoparticles? Pharm Res. 2008;25(7):1696–701. doi: 10.1007/s11095-008-9560-0. [DOI] [PubMed] [Google Scholar]
- 35.Gupta A, Gaud RS, Ganga S. Development of discriminating dissolution method for an insoluble drug: nisoldipine. Int J Pharm Tech Res. 2010;2(1):931–9. [Google Scholar]
- 36.Sugano K. Theoretical comparison of hydrodynamic diffusion layer models used for dissolution simulation in drug discovery and development. Int J Pharm. 2008;363:73–7. doi: 10.1016/j.ijpharm.2008.07.002. [DOI] [PubMed] [Google Scholar]


