

Abstract
The aim of the study was to develop single-unit tablet in capsule system of aceclofenac for the treatment of late night pain and morning stiffness associated with rheumatoid arthritis. The system was conceptualized as a three-component design (1) a hard gelatin enteric-coated capsule (for carrying two pulses), (2) first-pulse granules (for rapid release in intestine), and (2) second-pulse matrix tablet (for slow release in colon). An appropriate integration of pH-sensitive (Eudragit S100) and bacteria-responsive (inulin) functions, on the basis of 32 factorial design, led to formulation of TICS 1–9 that were screened for in vitro release. TICS 2 with biphasic drug release of 98.64% from first-pulse granules in simulated intestinal fluid (12 h) and 97.82% from second-pulse matrix tablet in simulated colonic fluid (24 h) was the optimized formulation that exhibited Fickian diffusion of drug (n = 0.363). In vivo fluoroscopy in rats traced the intact tablet to colon in 7.5 h that got eroded at the tenth hour. This demonstrated the colon-specific delivery of the matrix tablet affirming the potential of the system to obviate the need for two-time administration of drug at odd hours. The experimental design was validated by extra design check point, and diffuse reflectance spectroscopy and DSC revealed absence of chemical interaction between the formulation excipients.
KEY WORDS: aceclofenac, in vitro release, in vivo fluoroscopy, multipulse delivery, tablet in capsule system
INTRODUCTION
Rheumatoid arthritis is a chronological disorder that exhibits a circadian rhythmic pattern in the arousal of pain and associated symptoms (1). Patients suffering from rheumatoid arthritis tend to have more pain during early morning hours that abbreviates throughout the day (2). The chronological nature of the disease demands a single-unit dosage form with rhythmic delivery of therapeutic pulses. Considering the physiological conditions of the gastrointestinal tract, site specificity of pulse delivery can be achieved by appropriate integration of pH-sensitive and bacteria-responsive functions into a single unit.
Of the various analgesics, NSAIDs are considered the first-line drugs for the symptomatic treatment of rheumatoid arthritis, osteoarthritis, and ankylosing spondylitis (3). Aceclofenac, a non-steroidal anti-inflammatory agent with efficient activity against analgesia and inflammation in rheumatoid arthritis, osteoarthritis and ankylosing spondylitis, has fewer side effects. Aceclofenac is rapidly and completely absorbed after oral administration, peak plasma concentrations are reached 1 to 3 h after an oral dose. A highly protein- bound drug, renal excretion (70 to 80% of dose) is the main route of elimination (4).
The aim of the study was to develop a single-unit tablet in capsule device of aceclofenac for the treatment of late night pain and morning stiffness associated with rheumatoid arthritis. The system was conceptualized as a three-component design (1) a hard gelatin enteric-coated capsule (for carrying two pulses), (2) first-pulse granules (for rapid release in intestine), and (3) second-pulse matrix tablet (for slow release in colon). The rapid-release pulse was aimed at relieving late night pain whereas the slow-release matrix tablet was targeted for drug release in colon to relieve early morning stiffness as projected in Fig. 1. The first pulse for rapid release was made with microcrystalline cellulose and the second pulse for slow release was based on inulin matrix.
Fig. 1.
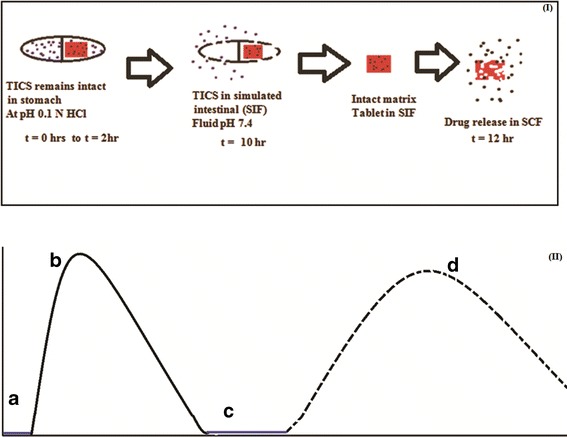
Schematic representation of the proposed release of variable multipulse tablet in capsule system (TICS). (I) Box represents the predictive release of drug from first pulse (granules) and second pulse (matrix tablet) of TICS. (II) Graphical representation of predictive drug release (a) lag time (t = 2 h) with no drug release, (b) immediate and fast drug release from first pulse (granules, t = 10 h), (c) Intact second pulse (matrix tablet) in simulated intestinal fluid (no drug release), (d) slow drug release from second pulse by enzymatic degradation of inulin by the invertase enzyme (t = 12 h)
Inulin, a natural polysaccharide, consists of linear chains of β 2,1-d-fructofuranose molecule with a glucose moiety at the end (5). When ingested orally, it is only digestible by the colonic microflora that act on the β 2,1- osidic bonds and thus inulin can pass intact through the gastrointestinal tract until it reaches the colon (6). This makes inulin a versatile tool for colon targeting. Some parts of inulin, especially the hydroxyl groups are more vulnerable to water and form stable gels at concentration of 13–50%. This can delay the absorption of drugs in the stomach and small intestine and if combined with polymethacrylate drugs, release can be completely avoided in the aforementioned segment. Low solubility of crystalline inulin is an advantageous parameter that opens the door for its utilization in chronological drug delivery systems (7).
MATERIALS AND METHODS
Materials
Aceclofenac was kindly provided by Ranbaxy Research Laboratory (Gurgaon, India), Eudragit S100 and Eudragit RS100 was obtained from Evonik (Germany), inulin was obtained from Adept Impex (Agra, India), invertase enzyme was supplied from Aum Enzymes (Ahmadabad, Gujarat, India), microcrystalline cellulose and magnesium stearate was purchased from S.D. Fine Chemicals (Mumbai, India). All the chemicals and ingredients were of analytical grade.
Design of Multipulse Tablet in Capsule Device
Formulation Approach
The formulation approach involved three steps, namely—coating of hard gelatin capsule shell (#0) with Eudragit S100, followed by the preparation of first-pulse granules and second-pulse matrix tablet. Both pulses to be encapsulated in coated hard gelatin capsule to obtain a tablet in capsule system (TICS).
Coating of Hard Gelatin Capsule Shells
A 10%w/v coating solution of Eudragit S100 was prepared in isopropyl alcohol (a class III solvent). A homogeneous mixture of talc (0.1% w/v) as an antiadherent and triethyl citrate (10% w/v) as plasticizer was prepared in isopropyl alcohol separately. Both were mixed and stirred for 1.5 h to obtain a translucent coating preparation. The cap and body of capsule were unlocked and coated separately by dip-coating technique. The cap/body was dipped in the coating solution for 1 min and rotated gently for homogenous coating layer and air dried for 2 h on stainless steel blunt ended rods.
Optimization of Coating
The coating of Eudragit S100 was optimized on the basis of number of coats applied and the drying time after each coat. The coated cap and body were joined and sealed with 10% w/v coating solution. The sealed capsules were subjected to integrity test in the 0.1 N HCl buffer, pH 1.2 for a period of 2 h. The unfilled coated capsule was placed in the dissolution vessel of USP type I apparatus containing 900 ml of 0.1 N HCl, pH 1.2 stirred at 100 rpm and maintained at 37°C. The capsule was visually analyzed for any damage/deformation for a period of 2 h.
Preparation and Evaluation of First Pulse
The first pulse comprised of granules made by dry granulation technique. Drug and microcrystalline cellulose were mixed in a ratio of 1:1.5 by weight in a polybag for 10 min. The mix was screened through #60 mesh and lubricated with magnesium stearate (0.1% w/w). The mixture was compressed by hand-operated single-punch tablet machine (HICON® Grover Enterprises, New Delhi) to form tablets (hardness = 2.0 kg) that were crushed and screened through #22 mesh to obtain granules, designated as first pulse. The granules were evaluated for percent drug content and rheological characteristics such as bulk density, tapped density, Carr’s compressibility index, Hausner’s ratio, and angle of repose (8). In order to assess any interaction between the ingredients of first pulse, diffuse reflectance spectra of aceclofenac, microcrystalline cellulose, and granules were recorded on infrared spectrophotometer (Shimadzu, Kyoto, Japan). The test samples were diluted with KBr (IR grade) in the ratio of 1:100 of test sample to KBr and the spectra were recorded in the transmittance mode by setting the resolution at 4 cm−1 and 50 times accumulation.
Design of the Second Pulse
A 32 full factorial was applied for the designing of the second pulse, three levels and two factors were selected. Eudragit RS100 (X1) and inulin (X2) were selected as independent variables, whereas percentage of aceclofenac released after 13 h (Y1) and 24 h (Y2) were chosen as dependent variables. The levels of the chosen independent variables are 10%, 20%, and 30% by wt of Eudragit RS100 and 4%, 8%, and 16% by wt of inulin (Table I). The polynomial equations for each response were generated using Design expert software 8.0.5 and were used to validate the experimental design after transformation. The design was validated by extra design check point formulation (F10).
Table I.
Composition of Aceclofenac Matrix Tablet (Second Pulse) of the Tablet in Capsule System (TICS)
| Second-pulse code | Drug (mg) | Inulin (%w/v) | Eudragit RS100 (%w/v) | MCC (%w/w) | Magnesium Stearate (%w/w) | Formulation code |
|---|---|---|---|---|---|---|
| F1 | 100 | 4 | 10 | q.s | 1 | TICS 1 |
| F2 | 100 | 8 | 10 | q.s | 1 | TICS 2 |
| F3 | 100 | 16 | 10 | q.s | 1 | TICS 3 |
| F4 | 100 | 4 | 20 | q.s | 1 | TICS 4 |
| F5 | 100 | 8 | 20 | q.s | 1 | TICS 5 |
| F6 | 100 | 16 | 20 | q.s | 1 | TICS 6 |
| F7 | 100 | 4 | 30 | q.s | 1 | TICS 7 |
| F8 | 100 | 8 | 30 | q.s | 1 | TICS 8 |
| F9 | 100 | 16 | 30 | q.s | 1 | TICS 9 |
| F10* | 100 | 9.33 | 20 | q.s | 1 | TICS 10 |
F10* is the extra design check point formulation; TICS constitutes 150 mg of aceclofenac as first-pulse granules and corresponding second pulse (Fn)
Formulation and Evaluation of Second Pulse
The second pulse as matrix tablets were prepared by direct compression technique. For preparation of tablets, the ingredients (Table I) were passed through a #60 mesh sieve and requisite amounts were mixed for 15 min in a polybag. To the resulting mixture, magnesium stearate was added. The compositions of the second pulse were made into 250 mg tablets using single-punch tablet punching machine (HICON® Grover Enterprises, New Delhi) equipped with 6 mm biconcave-faced punches. The matrix tablets were subjected to selected pharmacopoeial (uniformity of weight, uniformity of content) and non-pharmacopoeial tests (thickness, hardness, friability). Uniformity of weight was determined with a sample size of 20 tablets by the IP 2007 methodology (9). Uniformity in content was assessed by crushing 10 tablets and extracting 100 mg powder with 10 ml methanol followed by filtration through Whatman filter no.1 and assay at 275 nm. The thickness and hardness (n = 6) were determined by vernier caliper (Mitoyuto, Japan) and Pfizer hardness tester, respectively, while friability was determined on a Roche friabilator (n = 20) by the method described in <1216> general information, USP 27/NF 22(10).
Assembly of Tablet in Capsule System
In the body of Eudragit S100-coated capsule shell, the matrix tablet containing 100 mg of AC was incorporated followed by addition of drug loaded granules equivalent to 100 mg AC. The capsule body was closed with the cap and the joint was sealed with 10% w/w Eudragit S100 solution to obtain the TICS. A total of nine formulations (TICS 1–9) were formulated (Table I) and assessed for in vitro release patterns.
In Vitro Release
As the preparation is meant to release the drug in the colon through oral administration, three different receptor fluids are used for evaluation of the release profile. The TICS were subjected to in vitro drug release test by changing the test media sequentially. The formulation was placed in dissolution basket stirred at 100 rpm in 0.1 N HCl buffer, pH 1.2 (simulated gastric fluid) at 37 ± 1°C, for 2 h. An aliquot of the dissolution fluid was removed every hour, filtered through Whatman filter paper no.1 and assayed for the amount of aceclofenac at 275 nm. At the end of 2 h, the media was replaced by phosphate buffer, pH 7.4 (simulated intestinal fluid) and sampling was continued for 10 h by withdrawing samples every hour and assaying at 275 nm. Finally, the media was replaced by phosphate buffer, pH 6.8 containing 4 ml of 8%w/v invertase enzyme (simulated colonic fluid) for next 12 h. Two milliliters sample was withdrawn every hour and subjected to spectrophotometric analysis for aceclofenac. Each time the sample was withdrawn, it was replaced by corresponding fresh dissolution medium. The percent cumulative drug release (CDR) versus time plots were made and analyzed. The mechanism of drug release was elucidated by fitting the data to various equations of release models namely zero order (Qt = Q0 + K0t), first order (log Qt = Q0 + K1t), Higuchi (Qt = Q0 + KHt1/2), and Peppas (Qt = KKPtn) where Qt is the amount of aceclofenac released at time t and Q0 is the amount of drug released at zero time and Kx are respective constants.
Statistical Analysis of Data
The effect of independent variables on the responses was modeled with the help of Design Expert software version 8.0.5.2 (Stat-Ease, Inc., Minneapolis, USA). Polynomial equations were generated for the dependent variables - % CDR 13 h and % CDR 24 h. The insignificant coefficients were identified using one-way ANOVA at 95% level of significance (p < 0.05) and removed from the polynomial equations to obtain the transformed equations. A statistical model incorporating interactive and polynomial terms was used to evaluate the responses:
 |
1 |
Where β0, the intercept is the arithmetic mean of all quantities outcomes from nine runs, β1 to β8 are the coefficients computed from the observed experimental values of Y, and X1 and X2 are the coded levels of the independent variables and X1X2 and Xi2 (i = 1,2) are the interaction and polynomial terms, respectively.
Validation of Experimental Design
The experimental design was validated by preparing an extra check point formulation (TICS 10). The predicted values for % CDR 13 h and % CDR 24 h for TICS 10 were generated by their respective polynomial equations. The experimental values were determined by evaluating TICS 10 for the dependent variables. The predicted and experimental values of the responses were compared for statistical significance using pooled t test at 95% confidence interval, and degree of freedom 4 (p < 0.05).
Selection and Characterization of Optimized TICS
The optimized TICS formulation was selected on the basis of % CDR at 13 h and % CDR at 24 h and subjected to characterization by differential scanning calorimetry and diffuse reflectance spectroscopy.
Differential Scanning Calorimetry
The thermal behavior of aceclofenac, inulin, Eudragit RS100, and their mixtures was recorded using differential scanning calorimeter (NETZSCH DSC 200F3 240-427-L, Germany). The samples were hermetically sealed in aluminum pans and heated at a constant rate of 10°C/min, over a temperature range of 0 − 450°C. An inert atmosphere was maintained by purging with nitrogen at a flow rate of 60 mL/min. The thermograms were recorded and analyzed.
Diffuse Reflectance Spectroscopy
DRS spectra of aceclofenac, inulin, Eudragit RS100, and their mixtures were recorded on spectrophotometer. The test samples diluted with KBr (IR grade) in the ratio of 1:100 of test sample to KBr were placed in the sample holder and spectra were recorded in the transmittance mode by setting the resolution at 4 cm−1 and 50 times accumulation.
In Vivo Roentgenography
All the animal experiments have been conducted in full compliance with the institutional ethical and regulation principles as per the Spirit of Association for the assessment and accreditation of the laboratory animal care and international expectations for animal care and use. The investigation was performed after obtaining approval by the institutional animal ethical committee of RAP, Mathura, India (IAEC/RAP/3675b). New Zealand white rabbits (average weight 3–3.5 kg) were selected. The optimized TICS was reformulated by replacing the drug with barium sulfate in matrix. The amount of the barium sulfate was optimized for no effect on the physical characteristics of the optimized tablet in SGF and SIF. The animals (n = 3) were fasted overnight with free access to water and the tablet was administered with 15 ml of water. X-ray images of the abdomen of the rabbits were taken at various time points namely just after administration 0, 1.5, 3.5, 5, 7.5 and10 h to trace the in vivo movement and behavior of the tablet in the GIT. To precisely locate the position of the tablet in the GIT of the rabbits, a barium meal study was performed before the actual study. X-ray images of the rabbits in prone position were captured using L&T Vision 100 (C-arm) X-ray machine, at 64 mAs and 63 kV techniques.
RESULT AND DISCUSSION
Coating Considerations and its Optimization
Eudragit S100 was used as coating polymer for hard gelatin capsule as it displays pH-dependent solubility and is soluble above pH 7.0 (11). Eudragit S100 contains a higher percentage of carboxylic group as compared to the ester group that resists its solubilization in gastric fluid and requires higher pH for hydrolysis and subsequent release of drug (12,13). Apart from specific solubility features, flexibility of coating is also important to prevent the breaking/cracking of applied coat (14). It has been reported by Shivkumar et al. (15) that films of Eudragit S100 are brittle; hence, to ensure coating with adequate flexibility and mechanical strength, triethyl citrate was added (10–20% w/w) as plasticizer in the present work. Triethyl citrate acts by evenly distributing itself in polymer chain, weakens the intermolecular attraction between the polymer chains and produces film with sufficient mechanical strength and elastic modulus (16,17). Isopropyl alcohol was used as a coating solvent owing to its high flash point (15°C), low boiling point (82.3°C), and low toxicity (class III solvent; ICH Q3C guidelines). The use of anti adherent is evenly important as it prevents the coat films from adhering to each other while processing and storage (18). Therefore, 0.1% w/w of talc was added to avoid adhesion and consequently the damage.
Optimization of coating was adjudged on the basis of integrity test of the capsule in simulated gastric fluid with varied number of applied coats and drying time. The results (Table II) suggested that the batches of capsule (C1–C3) with two coats of Eudragit S100 failed to resist the acid uptake despite an increase in the drying time from 30 min to 120 min, which resulted in the loss of the coat and capsule. On increasing the number of coats to three, it was observed that the drying time of 90 min prevented acid uptake and the capsule (C7) remained intact in SGF for 2 h. Further increase in the number of coats to four with a drying time of 30 min resulted in failure of integrity of capsule C8. However, an increase in the drying time to 60 and 90 min, C9 and C10 respectively, successfully avoided the acid uptake and consequently its degradation. Experimental work carried out by Meghal et al. (19) proves that the drying of the polymeric film for sufficient period of time promotes coalescence of the film and ensures distribution of the plasticizer. In our case, a drying time of ≥60 min can be considered as sufficient time period that allowed even distribution of triethyl citrate in coalescing Eudragit S100 film applied as three or four coats. For the purpose of study, C7 capsule was utilized for economical reasons.
Table II.
Optimization Data of Hard Gelatin Capsules Coated with EudragitS100
| Coated capsule code | Number of coats | Drying time (min) | Degradation time in SGF | Result |
|---|---|---|---|---|
| C1 | 2 | 30 | <5 | Fail |
| C2 | 2 | 60 | <5 | Fail |
| C3 | 2 | 90 | <10 | Fail |
| C4 | 2 | 120 | 10–15 | Fail |
| C5 | 3 | 30 | <15 | Fail |
| C6 | 3 | 60 | 15–20 | Fail |
| C7 | 3 | 90 | > 2 h | Pass |
| C8 | 4 | 30 | < 20 | Fail |
| C9 | 4 | 60 | > 2 h | Pass |
| C10 | 4 | 90 | > 2 h | Pass |
Formulation Considerations of First Pulse
The first pulse was prepared by direct mixing of drug with microcrystalline cellulose and granulation to get uniform sized granule will ensure in uniform filling and ultimately drug content. Microcrystalline cellulose derived from alpha wood cellulose after acid hydrolysis (20), is a versatile excipient. It is partially depolymerized cellulose with degree of polymerization less than 400. For pharmaceutical purposes, it can be used as filler, binder, disintegrant, lubricant, and glidant. Microcrystalline cellulose is a water swellable polymer with excellent water absorption capacity for a prolonged period of time (21). The trapping of water is a result of capillary effect and adsorption. Consequently, the swelling of microcrystalline cellulose results in bursting and fragmentation into smaller particles. The drug diffuses through the particles and gets dissolved in medium (21,22). The latter feature of microcrystalline cellulose was the selection criteria for its use in first pulse that was designed to release the drug immediately. The first pulse was designed as granules by dry granulation technique and the granules were evaluated for flow properties and drug content.
Evaluation of First-Pulse Granules
The bulk density of first-pulse granules was found to be 0.75 ± 0.06 g/cm3 while the tapped density was 0.87 ± 0.07 g/cm3. Negligible difference among the values indicate less porous powder that will not present segregation problems associated with the vibration of the fast moving parts of the machinery in the manufacturing line. The angle of repose, Hausner index and Carr’s percent compressibility are considered as indirect measurements of powder flowability. While the Hausner index is indicative of interparticle friction, the Carr’s index shows the aptitude of a material to diminish in volume. The Carr’s compressibility index and Hausner’s ratio of 0.67 ± 0.23 and 1.12 ± 0.05 respectively, inferred good flow property (8) that will permit the uniform flow of granules from hopper to the die during capsule filling in an industrial set up. The angle of repose of 28.6°C confirmed good flow property that can be further improved by addition of glidant if desired (23).
Interaction Studies
The DRS spectra of aceclofenac, microcrystalline cellulose and granules are illustrated in Fig. 2 DRS profile of aceclofenac (Fig. 2a) displayed prominent peaks at 1770.81, 2970.64, 2937.85, 3319, and 669.50 cm−1 attributable to C═O stretching, OH stretching, CH stretching superimposed on OH stretching, NH stretching, and peak of C–Cl, respectively (24). The spectra of microcrystalline cellulose (Fig. 2b) displayed peaks of broad band in the 3600–3100 cm−1 (OH– stretching), CH2 bending vibration at 1430 cm−1 and C–O–C stretching at 898 cm−1 (25). The DRS spectra of granules (Fig. 2c) demonstrated that the characteristic peaks of drug suggesting that the drug did not undergo any interaction with the excipients used during the processing steps.
Fig. 2.
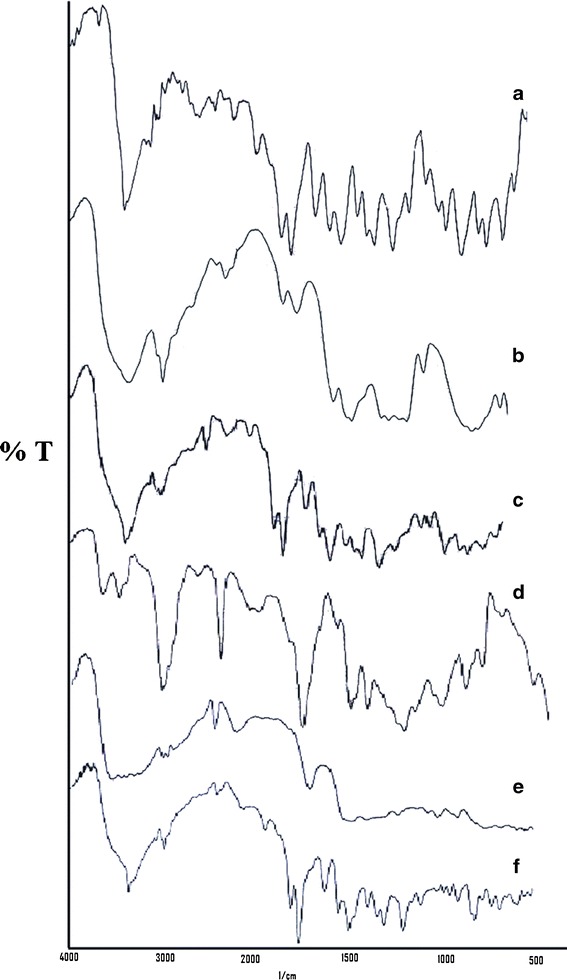
Diffuse reflectance spectra of the drug and components of first-pulse (granules) and second-pulse (matrix tablet) (a) aceclofenac, (b) microcrystalline cellulose (c) granules, (d) Eudragit RS100, (e) Inulin, (f) optimized second pulse
Design of the Second Pulse
The second pulse as matrix tablet was designed on the basis of 32 full factorial design where the levels of Eudragit RS100 and inulin were selected at three different levels. In the study inulin was selected as carrier polymer for targeting to colon and Eudragit RS100 was selected for avoiding any pre release of drug in gastric and small intestine prior to its arrival in the colon. Inulin was selected owing to its low solubility and intactness throughout stomach and small intestine. The presence of β 2-1 osidic bonds facilitates its intactness till it reaches colon (6). One of the key features of inulin is its tendency to form stable gel when in contact with water due to the presence of vulnerable hydroxyl groups. This hinders the release of drug in stomach and small intestine. This phenomenon is augmented by its low solubility in gastric and intestinal fluids due to the presence of long chain oligomers and its crystallinity that further slows down the release of drug from inulin matrix (7).
Eudragit RS100 was incorporated in the tablet matrix owing to its feature of forming pH-independent, insoluble matrix that prevents drug release. The presence of low ammonium content reduces its permeability and solubility (26). These characteristic features are expected to enable safe colon targeting of the matrix tablet. Thus a total of nine formulations were prepared (F1–F9) and evaluated.
Evaluation of Second Pulse
The tablets were evaluated for pharmacopoeial (9) and non-pharmacopoeial tests and the results (Table III) suggest acceptable physical characteristics. The average weight of formulations ranged between 249.65 and 249.98 mg suggesting least variation during manufacturing. The height of the tablet varied between 8.16 and 9.95 mm and diameter ranged between 6.37 and 6.43 mm. The dimensional data signifies cylindrical shape of the tablet that can be conveniently filled into the capsule body. The formulations displayed a hardness ranging from 10.34 to 11.47 kg depending on the levels of inulin and Eudragit RS100 and the surface of all the tablets was smooth. The formulations with higher level of inulin showed increased hardness that may be an outcome of binder effect of inulin (27). The friability in the range of 0.15–0.74% indicates sufficient mechanical strength of the tablets. The drug content of formulations closely ranged between 95.23% and 97.07% suggesting least variations due to the processing steps.
Table III.
Pharmacopoeial and Non-pharmacopoeial Characterization of Matrix Tablet of Aceclofenac (Second Pulse)
| Formulation code | Average weight (mg) ± s.d | Diameter (mm) ± s.d | Height (mm) ± s.d | Hardness (kg) ± s.d | Friability (%) ± s.d | Drug content (%) ± s.d |
|---|---|---|---|---|---|---|
| F1 | 249.97 ± 0.53 | 6.41 ± 0.05 | 9.31 ± 0.34 | 10.90 ± 0.04 | 0.71 ± 0.02 | 95.23 ± 0.04 |
| F2 | 249.87 ± 0.43 | 6.39 ± 0.07 | 8.72 ± 0.21 | 11.31 ± 0.08 | 0.41 ± 0.02 | 97.07 ± 0.18 |
| F3 | 249.81 ± 0.33 | 6.37 ± 0.08 | 8.43 ± 0.12 | 11.29 ± 0.21 | 0.31 ± 0.01 | 95.92 ± 0.03 |
| F4 | 249.71 ± 0.44 | 6.34 ± 0.10 | 8.16 ± 0.19 | 11.47 ± 0.05 | 0.20 ± 0.04 | 95.97 ± 0.32 |
| F5 | 249.90 ± 0.37 | 6.36 ± 0.07 | 8.54 ± 0.08 | 11.43 ± 0.16 | 0.15 ± 0.02 | 95.12 ± 0.31 |
| F6 | 249.90 ± 0.42 | 6.39 ± 0.09 | 8.75 ± 0.06 | 11.10 ± 0.08 | 0.41 ± 0.03 | 96.31 ± 0.12 |
| F7 | 249.98 ± 0.33 | 6.43 ± 0.07 | 9.64 ± 0.23 | 10.69 ± 0.09 | 0.72 ± 0.01 | 95.32 ± 0.42 |
| F8 | 249.65 ± 0.44 | 6.39 ± 0.04 | 9.95 ± 0.42 | 10.46 ± 0.12 | 0.67 ± 0.02 | 95.12 ± 0.55 |
| F9 | 249.98 ± 0.43 | 6.41 ± 0.09 | 9.23 ± 0.12 | 10.77 ± 0.20 | 0.74 ± 0.01 | 96.53 ± 0.43 |
Development and Evaluation of the Tablet in Capsule System
The TICS were developed with the aim to obtain variable rate pulses so that first pulse is immediately released in small intestine and the second pulse is released in sustained/controlled manner in simulated colonic conditions. The in vitro release studies were carried out sequentially in SGF, SIF, and SCF. In order to simulate the colonic conditions in vitro, the enzyme invertase (8 ml of 4% w/v) was added to the SCF, pH 6.4. Use of enzyme to simulate has been reported earlier by us in our investigations on colonic delivery of meloxicam (28) and piroxicam (29). During preliminary studies in these projects, it was observed that the incorporation of fecal content in the release test media resulted in severe interference in the spectrophotometric assay of the drug. As the aim of incorporating fecal content is to introduce colonic flora that would provide enzymatic environment for biodegradation of the carrier system, it was thought to replace the fecal content with appropriate enzyme in the test media. Thus, a suitable enzyme was incorporated in the test media in at concentration equivalent to colonic conditions without interference in assay method. The concept has been extrapolated to this project wherein the enzyme invertase has been used, that is secreted by colonic microflora and causes biodegradation of inulin in the colon (30,31).
In Vitro Release
TICS formulations showed no release in the simulated gastric fluid for 2 h due to the inertness of the enteric coat on the hard gelatin capsule. The enteric coat of Eudragit S100 remained unionized in the SGF and hence prevented the drug release. However, the coating of pH-dependent polymer Eudragit S100 dissolved in SIF liberating the first-pulse granules and drug release was initiated (Fig. 3). The in vitro release analysis in SIF showed 35.87% to 39.83% release in the third hour and more than 80% of the drug was released within 6 h and by the end of 12 h more than 97% was released. The release pattern of the first pulse was biphasic with initial fast release in 6 h followed by slow release in the later phase (Table IV). This can be explained on the basis of wetting property of microcrystalline cellulose. Its property to ingress large amount of fluid and consequently increase the dissolution rate (32), influenced the fast release of drug in the first 6 h. The later phase of slow release can be ascribed to the intrinsic poor solubility of the drug. The release rate of the drug from granules narrowly ranged between 21.74–21.08 mg h−1 in first 6 h and 1.61–2.53 mg h−1 in the next 6 h (Table IV). The drug release in SIF did not exceed beyond 100% strongly indicating that drug was not released from the matrix tablet (second pulse). The release kinetics of the first pulse from all the TICS formulations best fitted zero order, for both initial fast and later slow phase separately, with slower release rate except for TICS 2 and TICS 3 that followed first order release pattern probably due to the formulation variation.
Fig. 3.
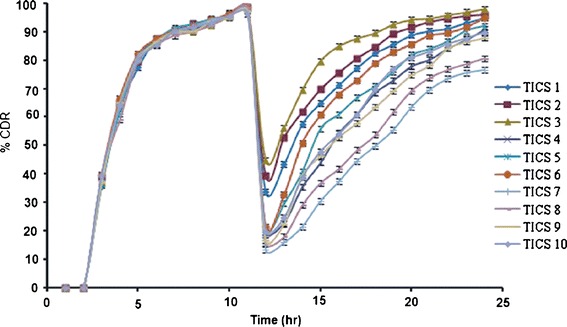
In vitro release profiles of tablet in capsule system (TICS) in simulated gastric fluid (2 h), simulated intestinal fluid (10 h) and in simulated colonic fluid (12 h)
Table IV.
In Vitro Release Parameters and Release Model Data for First Pulse (Granules) of Aceclofenac in Tablet in Capsule System
| Formulation code | %CDR (3 h) | %CDR (12 h) | Best fit model (r 2) | Release rate (mg/h) | ||
|---|---|---|---|---|---|---|
| First phase | Second phase | First phase | Second phase | |||
| TICS 1 | 35.87 ± 0.12 | 97.63 ± 0.10 | Zero order 0.9843 | Zero order 0.9764 | 21.65 | 1.93 |
| TICS 2 | 38.66 ± 0.12 | 98.64 ± 0.29 | Zero order 0.9801 | First order 0.9857 | 21.58 | 1.90 |
| TICS 3 | 37.54 ± 0.27 | 98.53 ± 0.32 | Zero order 0.9763 | First order 0.9463 | 21.74 | 2.23 |
| TICS 4 | 39.65 ± 0.27 | 98.47 ± 0.42 | Zero order 0.9631 | Zero order 0.9754 | 21.63 | 2.06 |
| TICS 5 | 36.86 ± 0.22 | 98.56 ± 0.21 | Zero order 0.9854 | Zero order 0.9666 | 21.74 | 1.76 |
| TICS 6 | 39.88 ± 0.12 | 98.68 ± 0.14 | Zero order 0.9893 | Zero order 0.9812 | 21.73 | 2.09 |
| TICS 7 | 37.88 ± 0.51 | 97.56 ± 0.26 | Zero order 0.9410 | Zero order 0.9754 | 21.39 | 1.92 |
| TICS 8 | 39.78 ± 0.4 | 98.65 ± 0.09 | Zero order 0.9650 | Zero order 0.9812 | 21.15 | 2.53 |
| TICS 9 | 36.88 ± 0.38 | 97.43 ± 0.40 | Zero order 0.9824 | Zero order 0.9718 | 21.65 | 1.98 |
The in vitro release of second pulse displayed CDR ranging from 13.34% (TICS 7) to 44.78% (TICS 3) at 13th h and the %CDR at 24 h ranged from 76.58% (TICS 7) to 97.82% (TICS 3) in the SCF. Careful analysis revealed that increase in the level of Eudragit RS100 caused decrease in cumulative drug release from TICS. This can be explained by the tendency of Eudragit RS100 to form dense matrix structure that is enhanced at high levels causing sustainment of drug release (18). Therefore, the formulations made with 10% Eudragit RS100 showed higher release than those formulated with 30% by wt of Eudragit RS100. Furthermore, when Eudragit RS100 was kept constant and level of inulin was varied, an increase in inulin level increased the cumulative drug release. This can be accounted by increase in the number of target sites available for the enzymatic action of invertase present in the release media leading to enhancement in drug release. Thus, characteristics and levels of both the two polymers, inulin and Eudragit RS100, affected the release pattern that can be observed response surface plots (Fig. 4). Thus, TICS 7 with the highest level of Eudragit RS100 and inulin at least level displayed least %CDR of 76.58% whereas TICS 3 with lowest level of Eudragit RS100 and inulin at highest level, displayed highest %CDR of 97.82%. Though both the rate controlling polymers affected the release the predominant role of inulin in governing the release cannot be ignored. Presence of the enzyme invertase in the SCF facilitated digestion of inulin causing gradual matrix erosion and at the end of 24 h very small tablet fragments could be recognized in the release test medium.
Fig. 4.
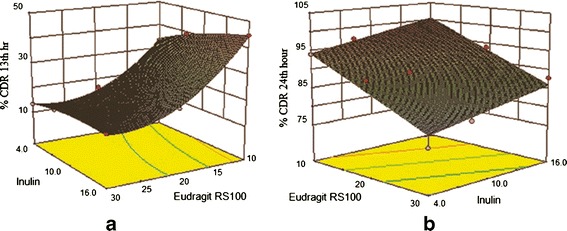
3-D Response surface plots showing the a effect of independent parameters Eudragit RS100% (X 1) and % inulin (X 2) on % dependent parameter cumulative drug release at the 13th hour. b Effect of independent parameters Eudragit RS100% (X 1) and % inulin (X 2) on dependent parameter % cumulative drug release at the 24th hour
The release profiles were subjected to modeling to identify the mechanism of drug release. All the formulations except TICS 7 and TICS 8, best fitted Peppas model. TICS 7 and TICS 8 followed Higuchi release kinetic (Table V). In order to understand the mechanism and kinetics of drug release, the data was analyzed by Peppas equation. The values of n for all the batches except TICS 1 and TICS 2 ranged between 0.447 and 0.785, indicating a non-Fickian or anomalous type of transport. Non-Fickian mechanism explains the combined effect of diffusion and erosion on drug release. In this case inulin was acted upon by invertase and its degradation led to gradual erosion of matrix. The swelling of Eudragit RS100 (one of the matrix component) was responsible for the diffusion mechanism. TICS 1 and TICS 2 with n value of 0.427 and 0.363 respectively, indicating Fickian-type diffusion.
Table V.
In Vitro Release Parameters and Release Model Data for Second Pulse (Matrix Tablet) of Aceclofenac in Tablet in Capsule System
| Formulation Code | % CDR (13 h) | % CDR (24 h) | Model | |||
|---|---|---|---|---|---|---|
| Zero order | First order | Higuchi | Peppas (n) | |||
| TICS 1 | 33.56 ± 0.12 | 94.86 ± 0.54 | 0.9093 | 0.8782 | 0.8989 | 0.9803 (0.427) |
| TICS 2 | 39.34 ± 0.32 | 96.87 ± 0.32 | 0.9107 | 0.8795 | 0.9390 | 0.9480 (0.363) |
| TICS 3 | 44.78 ± 0.54 | 97.82 ± 0.34 | 0.9822 | 0.8802 | 0.9852 | 0.9899 (0.447) |
| TICS 4 | 16.45 ± 0.12 | 89.82 ± 0.45 | 0.9134 | 0.8842 | 0.9307 | 0.9905 (0.672) |
| TICS 5 | 18.73 ± 0.12 | 90.28 ± 0.21 | 0.9850 | 0.8860 | 0.9130 | 0.9915 (0.601) |
| TICS 6 | 21.22 ± 0.34 | 94.89 ± 0.37 | 0.9572 | 0.8872 | 0.9160 | 0.9987 (0.593) |
| TICS 7 | 13.34 ± 0.33 | 76.58 ± 0.41 | 0.9680 | 0.8891 | 0.9883 | 0.9765 (0.785) |
| TICS 8 | 15.64 ± 0.45 | 80.74 ± 0.19 | 0.9205 | 0.8902 | 0.9892 | 0.9710 (0.728) |
| TICS 9 | 16.56 ± 0.54 | 87.83 ± 0.52 | 0.9583 | 0.8765 | 0.9182 | 0.9964 (0.741) |
The release rate of drug in terms of amount of aceclofenac released per unit time was deduced by the product of k0 and V (17). Where k0 is the rate of release and V is the volume of release medium (in liter). The release rate of the drug from second pulse ranged between 5.90 and 11.30 mg/h. Assuming constant release rate throughout, the duration of the release was predicted for second pulse and compared with desired release time period of 12 h. Based on this consideration TICS 2 and TICS 4 emerged as potential formulations. However TICS 4 displayed lower % CDR of 89.82 than TICS 2 (% CDR = 97.82). Therefore TICS 2 was identified as the optimized formulation.
Statistical Analysis
Statistical analysis was done by Design expert software version 8.0.5.2 (Stat-Ease, Inc., Minneapolis, USA) and the second order polynomial equations were derived specifically for second pulse that full fills the aim of colon targeting. The transformed equations are,
 |
2 |
 |
3 |
Where X1 and X2 are the independent variables. The effects of independent variables on the dependent variables are illustrated in Fig. 4. Three-dimensional response surface plots were constructed for the graphical optimization of TICS. When the levels of both inulin and Eudragit RS100 increased, % CDR at the 13th hour decreased (Fig. 4a). It was observed that as the level of inulin increased, the drug release increased and reverses if the level decreases. As the levels of Eudragit RS100 decreased and level of inulin is increased, the % CDR at the 24th hour increased (Fig. 4b). The graphical optimization is consistent with the data in Tables IV and V.
Validation of the Experimental Design
An extra design check point formulation (TICS 10) was made and the predicted value and experimental values of dependent variables were compared using pooled t test at 95% confidence interval, degree of freedom = 4 and p < 0.05. No significant difference was recorded between the % drug release at 13 h (predicted value = 20.21 and estimated value = 20.76 ± 0.42) and % drug release at 24 h (predicted value = 91.41 and estimated value = 90.78 ± 0.137) thereby establishing validity of the generated model.
Interaction Status
Compatibility was evaluated by differential scanning calorimetry studies were carried for compatibility studies. DSC thermogram of pure drug showed (Fig. 5a) a sharp endothermic peak at 155.6°C (∆H = 122.3 J/g) corresponding to its melting point (33). In Fig. 5b, the broad endothermic peak of Eudragit RS100 at 390.2°C (∆H = 645.1 J/g) indicated its purity and amorphous nature. The thermogram of inulin (Fig. 5c) displayed two peaks—one at 100.2°C (∆H = 61.01 J/g) and other at 201.9°C (∆H = 51.16 J/g). The former was the peak of water of hydration and latter corresponds to the melting point of inulin (7). The thermogram of mixture of drug and Eudragit RS100 (Fig. 5d) displayed characteristic peak of drug at 155.6°C that suggested no chemical interaction between the drug and the polymer. The thermogram of drug and inulin Fig. 5e showed the distinct peak of inulin and drug without appearance of any new peak or shifting. Furthermore, the thermogram of polymeric mixture retained original peaks (Fig. 5f). The thermogram of the optimized second pulse retained all the characteristic peaks of Eudragit RS100, inulin and drug at 390.2°C (∆H = 689.3 J/g), 201.9°C (∆H = 57.7 J/g), and 155.6°C (∆H = 102.3 J/g) respectively. This confirms no incompatibility between drug and polymer.
Fig. 5.
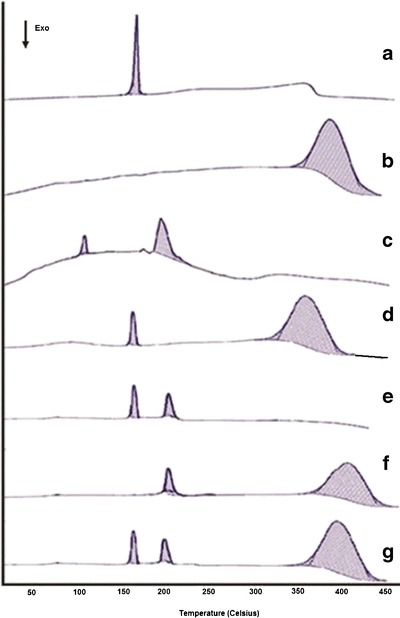
Differential scanning calorimetric spectra of (a) Aceclofenac, (b) Eudragit RS100, (c) inulin, (d) physical mixture of drug and Eudragit RS100, (e) physical mixture of drug and inulin, (f) physical mixture of inulin and Eudragit RS100, (g) physical mixture of drug, inulin and Eudragit RS100 (TICS 2 composition)
The interaction status was also determined by diffuse reflectance spectroscopy. The DRS spectra of pure drug displayed prominent peaks at 1770.81, 2970.64, 2937.85, 3319, and 669.50 cm−1 attributable to C═O stretching, OH stretching, CH stretching superimposed on OH stretching, NH stretching and peak of C–Cl, respectively (Fig. 2a). The spectra of Eudragit RS100 (Fig. 2d) displayed peaks at 3290, 2952, 1724, and 1265 cm−1. The spectra of inulin (Fig. 2e) displayed peaks at 3353, 3300, and 1732 cm−1. In the DRS spectra of optimized second-pulse F2, the characteristic peak of drug were retained and the peak at 33.19 cm−1was broadened probably due to the super imposable peaks of inulin and Eudragit RS100 at 3300 and 3290 cm−1, respectively (Fig. 2f). These studies confirmed no interaction between the matrix forming polymers of the second pulse with aceclofenac.
In Vivo Roentgenography
Keeping in view the limitation of esophageal lumen size of the experimental animal, oral administration of optimized TICS was not feasible and moreover it was the matrix tablet that was meant to traverse intact to the colon. Hence for the experimental purpose, matrix tablet (F2 of TICS 2) of the optimized TICS dosed in accordance to rabbit was subjected to roentgenographic study. X-ray images show the position of F2 in the esophageous (Fig 6a) just after the administration followed by its passage to stomach after 1.5 h (6b). The intact tablet could be traced to small intestine at 3.5 h (6c), intestinal colon junction at 5 h (6d) and finally to colon in 7.5 h(6e) . At 10 h (6f) the intact tablet could not be traced demonstrating its erosion in colon. The study is indicative of the efficiency of the inulin-based matrix tablet for its capacity to traverse the intestine intact and deliver the drug for its chronotherapeutic benefit. When extrapolated to potential clinical situation, the developed TICS can be administered during late evening hours that would deliver the first pulse of the drug after a lag time of approximately 2 h followed by second-pulse release after a lag time of 13 h with respect to dosage form administration.
Fig. 6.
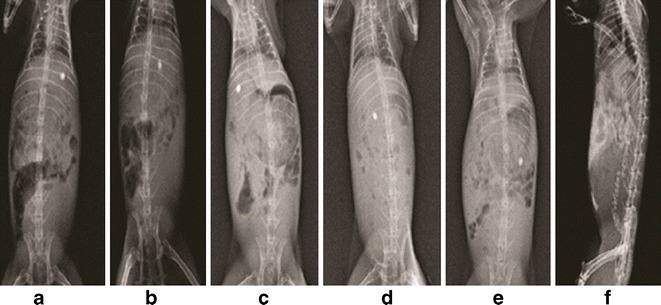
X-ray images of New Zealand rabbit administered with TICS 2 a immediately after administration, b 1.5 h (stomach), c 3.5 h (small intestine), d 5 h (intestinal colon junction), e 7.5 h (colon) f 10 h (rectum)
The literature cites development of colon targeted systems of AC and one of the prominent reports is of Qureshi et al. (34) that describes a time-specific pulsatile-release tablet of aceclofenac for morning pain in rheumatoid arthritis. The authors have reported an oral chronomodulated drug delivery system for the treatment of rheumatoid arthritis with a distinct predetermined lag time of 6 h. The design of the system consisted of an inner core, an intermediate swelling layer and an external acid-resistant enteric layer applied by pan coating. None of the reports evidence multipulse delivery of aceclofenac. Thus, the tablet in capsule system developed in the present study, has potential for the chronotherapeutic treatment of late night pain and morning stiffness associated with rheumatoid arthritis.
CONCLUSION
The TICS of aceclofenac conceptualized for the treatment of late night pain and morning stiffness associated with rheumatoid arthritis was successfully developed by appropriate integration of pH-sensitive and bacteria-responsive functions. The optimized formulation exhibited fast and complete release of aceclofenac via granules after a lag time of 2 h thus avoiding gastric delivery. Thereafter, a matrix tablet that remained intact throughout gradually released the drug. This presents an opportunity of obviating the need for two-time administration at odd hours. Conclusively, the tablet in capsule system demonstrated two distinct features: (1) the ability and suitability of inulin as a specific carrier for colon targeted system and (2) its variable multipulse nature of fast and slow pulse that appear to be tailored in accordance to the chronotherapeutic needs of rheumatoid arthritis patient.
ACKNOWLEDGMENTS
The authors are thankful to Ranbaxy Research Laboratory, Gurgaon, India for providing aceclofenac as gift sample and to All India Council for Technical Education for providing final assistance to carry out research work. The authors are highly indebted to Prof Satish Kumar Garg, Dean, Pt. Deen Dayal Upadhayaya Veterinary University, Mathura, India for extending the facilities for in vivo roentgenography study.
REFERENCES
- 1.Zhu Z, Zheng L. Development and mathematical simulation of theophylline pulsatile release tablets. Drug Dev Ind Pharm. 2005;31:1009–1017. doi: 10.1080/03639040500306278. [DOI] [PubMed] [Google Scholar]
- 2.Smolenska Z, Kaznowska Z, Zarowny D, Simmonds HA, Smolenski RT. Effect of methotrexate on blood purine and pyrimidine levels in patients with rheumatoid arthritis. Rheumatology (Oxford) 1999;38:997–1002. doi: 10.1093/rheumatology/38.10.997. [DOI] [PubMed] [Google Scholar]
- 3.Sharma P, Pathak K. Are biological targets the final goal for rheumatoid arthritis therapy? Expert Opin Biol Targets. 2012;12(12):1611–1622. doi: 10.1517/14712598.2012.721769. [DOI] [PubMed] [Google Scholar]
- 4.Saraf S. http://www.pharmainfo.net/reviews/aceclofenac-potent-non-steroidal-anti-inflammatory-drug (2012). Accessed on 18th Dec 2011.
- 5.Neagu C, Bahrim G. Inulinases—versatile tool for biotechnology. Innov Rom Food Biotechnol. 2011;9:1–11. [Google Scholar]
- 6.Akhgari A, Afrasiabi GH, Sadeghi F. Combination of inulin and time dependent polymethacrylates as a coating system to achieve colonic delivery of indomethacin. DARU J Pharm Sci. 2009;17:199–209. [Google Scholar]
- 7.Barclay T, Milena GM, Cooper P, Petrovsky N. Inulin—versatile polysaccharide with multiple pharmaceutical and food chemical uses. J Excipients Food Chem. 2010;1(3):27–55. [Google Scholar]
- 8.Aulton ME. Powder flow in pharmaceutics—the science of dosage form design. London: Churchill Livingstone; 2002. pp. 114–116. [Google Scholar]
- 9.Ministry of Health and Family Welfare . Indian pharmacopoeia. Ghaziabad: The Indian Pharmacopoeial Commission; 2007. pp. 1648–1650. [Google Scholar]
- 10.United States Pharmacopoeia 27/National Formulary 24. Rockville, MD: US Pharmacopoeia Convention, Inc; 2000. pp. 2524–5.
- 11.Gupta VK, Beckert TE, Deusch NJ, Harinaraon M, Price JC. A novel pH and time based multi potential colonic drug delivery system. Int J Pharm. 2001;213:83–91. doi: 10.1016/S0378-5173(00)00649-9. [DOI] [PubMed] [Google Scholar]
- 12.Gao C, Huang J, Jiao Y, Shan L, Liu Y, Li Y, et al. In vitro release and in vivo absorption in beagle dogs of meloxicam from Eudragit FS30D coated pellets. Int J Pharm. 2006;322:104–112. doi: 10.1016/j.ijpharm.2006.05.035. [DOI] [PubMed] [Google Scholar]
- 13.Kshirsagar SJ, Bhalekar MR, Umap RR. In vitro in vivo comparison of two pH sensitive eudragit polymers for colon specific drug delivery. J Pharm Sci Res. 2009;1:61–70. [Google Scholar]
- 14.Bussemer T, Peppas NA, Bodmeier R. Time-dependent mechanical properties of polymeric coatings used in rupturable pulsatile release dosage forms. Drug Dev Ind Pharm. 2003;29:623–630. doi: 10.1081/DDC-120021311. [DOI] [PubMed] [Google Scholar]
- 15.Shivkumar HN, Sarasiji S, Desai BG. Design and evaluation of pH sensitive multiparticulate system for choronotherapeutic delivery of diltiazem hydrochloride. Ind J Pharm Sci. 2006;68(6):781–787. doi: 10.4103/0250-474X.31015. [DOI] [Google Scholar]
- 16.Mohamad A, Dashevsky A. In vitro and in vivo performance of a multiparticulate pulsatile drug delivery system. Drug Dev Ind Pharm. 2007;33:113–119. doi: 10.1080/03639040601085433. [DOI] [PubMed] [Google Scholar]
- 17.Koteshwara KB, Thoppil SC, Naha A. Design and development of multiparticulate drug delivery of metronidazole for targeted delivery to colon. Int J Pharm. 2011;3:3580–3589. [Google Scholar]
- 18.Shah N, Patel M, Shah T, Amin A. Design, development and optimization of colon targeted drug delivery system for Crohn’s disease. J Pharm Educ Res. 2011;2:42–50. [Google Scholar]
- 19.Meghal AK, Chaudari PS, Mathur VB. Formulation and evaluation of enteric coated HPMC capsule of diclofenac sodium. Res J Pharm Biol Chem Sci. 2011;2:790–798. [Google Scholar]
- 20.Kamel S, Ali N, Jahangir K, Shah SM, El-Gendy AA. Pharmaceutical significance of cellulose: a review. Express Polym Lett. 2008;2:758–778. doi: 10.3144/expresspolymlett.2008.90. [DOI] [Google Scholar]
- 21.Tukaram BN, Rajagopalan IV, Sharatchandra PSI. The effects of lactose, microcrystalline cellulose and dicalcium phosphate on swelling and erosion ofcompressed HPMC matrix tablets: texture analyzer. Iran J Pharm Res. 2010;9(4):349–358. [PMC free article] [PubMed] [Google Scholar]
- 22.Chambin O, Champion D, Debray C, Rochat-Gonthier MH, Le MM, Pourcelot Y. Effects of different cellulose derivatives on drug release mechanism at a preformulation stage. J Control Release. 2004;95:101–108. doi: 10.1016/j.jconrel.2003.11.009. [DOI] [PubMed] [Google Scholar]
- 23.Coben LJ, Lieberman HA, Lachman L, Lieberman HA, Kanig JL. The theory and practice of industrial pharmacy. Mumbai: Varghese; 1991. pp. 241–250. [Google Scholar]
- 24.Mohsen A, Khoweysa OM, Shoukri RA. Optimization of aceclofenac once daily matrix tablets: in vitro and in vivo studies. J Pharm Res Opin. 2011;2:12–22. [Google Scholar]
- 25.Ciolacu D, Ciolacu F, Popa VI. Amorphous cellulose—structure and characterization. Cellul Chem Technol. 2011;45(1–2):13–21. [Google Scholar]
- 26.Azarmi S, Farid J, Nokhodchi A, Bahari-Saravi SM, Valizadeh H. Thermal treating as a tool for sustained release of indomethacin from Eudragit RS and RL matrices. Int J Pharm. 2002;246:171–177. doi: 10.1016/S0378-5173(02)00378-2. [DOI] [PubMed] [Google Scholar]
- 27.Eissens AC, Bolhuis GK, Hinrichs WLJ, Frijlink HW. Inulin as filler—binder for tablets prepared by direct compaction. Eur J Pharm Sci. 2002;15:31–38. doi: 10.1016/S0928-0987(01)00201-9. [DOI] [PubMed] [Google Scholar]
- 28.Srivastava R, Kumar D, Pathak K. Colonic luminal surface retention of meloxicam microsponges delivered by erosion based colon targeted matrix tablet. Int J Pharm. 2012;427:153–162. doi: 10.1016/j.ijpharm.2012.01.036. [DOI] [PubMed] [Google Scholar]
- 29.Vats A, Pathak K. Tabletted guar gum microspheres of piroxicam for targeted adjuvant therapy for colonic adenocarcinomas. Ther Deliv. 2012;3(11):1281–1295. doi: 10.4155/tde.12.116. [DOI] [PubMed] [Google Scholar]
- 30.Roberfroid M. Introducing inulin type fructans. Br J Nutr. 2005;93(Suppl 1):S13–S25. doi: 10.1079/BJN20041350. [DOI] [PubMed] [Google Scholar]
- 31.Yasuda K, Maiorano R, Welch RM, Miller DD, Lei XG. Ceacum is major degradation site of ingested inulin in young pigs. J Nutr. 2007;137(11):2399–2404. doi: 10.1093/jn/137.11.2399. [DOI] [PubMed] [Google Scholar]
- 32.Liberman HA, Lachman L, Schwartz JB. Pharmaceutical dosage forms; tablets (2) New York: Mercel Dekker; 1989. p. 210. [Google Scholar]
- 33.Kumar R, Patil SR, Patil MB, Paschapur MS, Mahalaxami R. Design and characterization of aceclofenac mouth dissolving tablets by effervescent formulation approach. Der Pharmacia Lettre. 2010;2:220–236. [Google Scholar]
- 34.Qureshi J, Ahuja A, Baboota S, Chutani K, Jain S, Ali J. Development and evaluation of a time-specific pulsatile-release tablet of aceclofenac: a solution for morning pain in rheumatoid arthritis. Methods Find Exp Clin Pharmacol. 2009;31(1):15–23. doi: 10.1358/mf.2009.31.1.1346610. [DOI] [PubMed] [Google Scholar]