Abstract
Three new solvates [mono-dimethyl sulfoxide (mono-DMSO), mono-dimethyl acetamide (mono-DMA) and mono-dimethyl formamide (mono-DMF)] of 10-Deacetyl baccatin III, were generated by slow evaporation in DMSO, DMF, and DMSO/DMA (1:1) solvent systems respectively. Two concomitant forms mono-DMSO(a new form) and di-DMSO (a known form) were obtained in the DMSO solvent system. Yet two other concomitant forms mono-DMA (a new form) and di-DMSO (a known form) were obtained in DMSO/DMA (1:1) solvent system. A fourth solvate mono-DMF (a new form) was crystallized in unimolar ratio using DMF as a solvent. These solvates were characterized using powder X-ray diffraction, differential scanning calorimeter, thermogravimetric analysis (TGA), and spectroscopic [13C solid-state nuclear magnetic spectroscopy, solution 1H NMR, and Fourier transform infrared] techniques. The interactions between host and guest molecules were elucitated by single-crystal X-ray diffraction data. In all the cases, guest molecules are connected to the host molecules by O–H···O hydrogen bonds. A remarkable difference in the desolvation onset temperatures of di- and mono-DMSO solvates was observed which was also featured by a corresponding weight loss during TGA analysis.
Key words: 10-deacetyl baccatin III, concomitant, pseudopolymorphs, solid-state characterization
Introduction
In general, the discovery of inclusion compounds is a result of serendipity, obtained during crystallization from various solvents (1). However, development in supramolecular chemistry (2) and crystal engineering reveals that host–guest compounds can be rationally designed and synthesized. Desiraju has more aptly defined crystal engineering as “the understanding of intermolecular interactions in the context of crystal packing and in the utilization of such understanding in the design of new solids with desired physical and chemical properties” (3). By understanding the history of molecular arrangements in crystals, host–guest pioneers described how to design novel host materials (4–8). The host–guest, inclusion compounds and solvates of the latter case have been called as pseudopolymorphs (9,10). The study of inclusion compounds is one of the hot topics in chemical research (11–19) since it has applications in magnetism, gas storage devices, nonlinear optical materials, targeted drug delivery, etc. (19,20).
The formation of two different forms of a same species simultaneously in the same container under identical conditions is termed as “concomitant polymorphs” or “concomitant pseudopolymorphs” (21). The situations in which polymorphs concomitantly crystallize are determined by the experimental conditions in relation to both the free energy–temperature relationships and the relative kinetic factors. The possibilities of concomitant pseudopolymorphs was explained by Dinabandhu Das et al., when a host (H) is crystallized from a solvent (S), either only one kind of solvate (H.nS) could be formed, or different solvates such as H.n1S, H.n2S, etc. can result depending on the stoichiometry of H and S (22). In principle, there are four possible structural outcomes of crystallizing H (host) from a binary mixture of solvents S1 and S2: (1) the host can crystallize in its apohost form (without solvent); (2) H can include only solvent S1 to form H.n1S1; (3) H can include only solvent S2 to form H.n2S2 and (4) both solvents can be included to yield a so-called “mixed solvate (23,24)” H.n1S1.n2S2, mixed crystal solvates are generally not observed. Concomitant pseudopolymorphs have recently been investigated in a systematic manner (9,10,22). Though, dual concomitant pseudopolymorphs occur frequently in a mixture of solvents in unimolar ratios, concomitant polymorphs of one host and two guests, one host and one guest are not very common. We have reported such rare case of concomitant crystallization of 10-DAB III, a pharmaceutically relevant compound in different stoichiometric solvates using DMSO and a mixture of DMSO and DMA.
10-DAB III ((2aR,4S,4aS,6R,9S,11S,12S,12aR,12bS)-12b-(acetyloxy)-12-(benzoyloxy)-1,2a,3,4,4a,6,9,10,11,12,12a,12b-dodecahydro-4,6,9,11-tetrahydroxy-4a,8,13,13-tetramethyl-7,11-methano-5H-cyclodeca(3,4)benz(1,2-b) oxet-5-one) (Scheme 1) is closely related to natural organic compound isolated from the Pacific yew tree (Taxus brevifolia) and related species. 10-DAB III is a key starting material of paclitaxel (Tazol) and docetaxel (Taxotere) which are used as anticancer drugs. Both paclitaxel and docetaxel possess a common tetracyclic ring and differ only in the substitution of side chains.
Scheme 1.
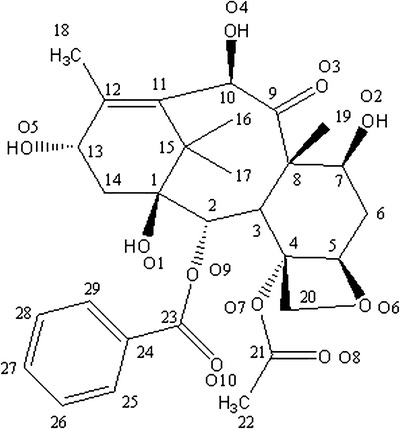
Structure of 10-DAB III
So far, only one crystal structure of 10-DAB III was reported in Cambridge Crystallographic Data Centre (CCDC), a dimethyl sulfoxide (DMSO) solvate in 1:2 ratio (Form III) (25). In the present study, we have crystallized three new solvates of 10-DAB III viz. mono-DMSO (Form I), mono-DMA (Form II), and mono-DMF (Form IV). All these forms of 10-DAB III including Form III were fully characterized by powder X-ray diffraction (PXRD), NMR (solid state and solution state), Fourier transform infrared (FT-IR), differential scanning calorimeter (DSC), and thermogravimetric analysis (TGA) techniques. Single-crystal X-ray diffraction (SXRD) studies were performed on Form I and II to elucidate the interaction between host and guest molecules in the crystal packing system. The Form IV crystallized as very thin crystals and therefore was not deemed suitable for SXRD analysis.
Materials and methods
Materials
10-DAB III (M.Wt—544, C29H36O10) was procured from Deccan Nutraceuticals private limited, Pune, India. GC-grade solvents DMSO, DMA and DMF were procured from Merck Chemicals, Darmstadt, Germany.
Preparation of 10-DAB III Solvates
Forms I and III were crystallized from a supersaturated solution of 10-DAB III. An excess amount of 10-DAB III was dissolved in DMSO at 60°C and the solution was filtered through 0.45 μm Whatman filter. The filtered solution was allowed to evaporate slowly at room temperature and after 6 days of evaporation, crystals with two different morphologies having diamond and plate shapes were observed (Fig. 1). These crystals were separated manually and dried.
Fig. 1.
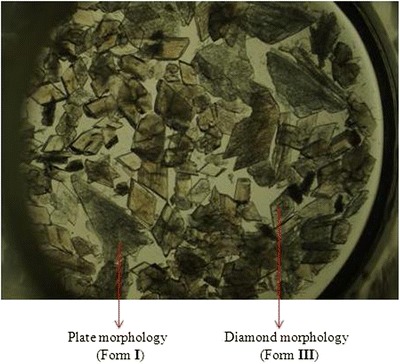
Photomicrograph of concomitant solvates of 10-DAB III (Forms I and III)
Forms II and III were crystallized from a supersaturated solution of 10-DAB III by dissolving its excess amount in equal volumes of DMA and DMSO at 60°C. The solution was filtered through 0.45 μm Whatman filter and allowed to evaporate slowly at room temperature. After 8 days, crystals with two different morphologies having needle and diamond shapes were observed (Fig. 2). These crystals were separated manually and dried.
Fig. 2.
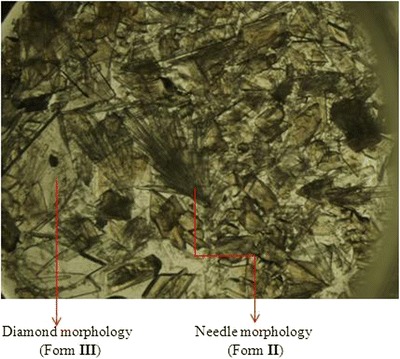
Photomicrograph of concomitant solvates of 10-DAB III (Forms II and III)
Form IV was crystallized from a saturated solution of 10-DAB III in DMF at 40°C and allowed to evaporate slowly at room temperature. After 15 days of evaporation, very thin crystals were obtained at the bottom of the conical flask. The crystals were filtered through the Buchner funnel and dried.
Methods
SXRD
X-ray reflections of Forms I and II were collected on an Oxford Xcalibur Gemini Eos CCD diffractometer using Mo-Kα, radiation. Data reduction was performed using CrysAlisPro (version 1.171.33.55). OLEX2-1.0 (26) and SHELX-TL 97 were used to solve and refine the data. All non-hydrogen atoms were refined anisotropically and C–H hydrogens were fixed. The O–H hydrogens were located from the differences in electron density maps and C–H hydrogens were fixed.
Powder X-Ray Diffractometry
PXRD patterns were recorded using a Rigaku MiniFlex (Tokyo, Japan) powder diffraction system, equipped with a horizontal goniometer in the θ/2θ mode. The X-ray source was nickel-filtered Kα emission of copper (1.54056 Å). Samples were packed into a glass holder and were scanned over the range of 3 to 45° 2θ, at a scan rate of 2.0 2θ/min.
Thermal Analysis
Thermogravimetric analysis was performed on the samples using a TA Q 500 series (TA Instruments, Newcastle, DE, USA) using Q-Advance software. Approximately 4–8 mg of sample was weighed into a platinum pan and heated in a typical temperature range of 30–250°C. Two-point calibration of the temperature was performed with ferromagnetic materials (Ni, Curie-point standards, TA instruments). Heating rates of 10°C/min were applied and dry nitrogen was used as a purge gas (sample purge: 60 mL/min and balance purge: 40 mL/min).
Differential Scanning Calorimetry (DSC) was performed using a TA Q 200 series (TA Instruments, Newcastle, DE, USA) operated through Q-Advance software. Approximately 2–4 mg of sample (solid forms) was placed into a Tzero aluminum pan. The pan was covered with a lid and then crimped. The sample cell was heated under nitrogen purge (50 mL/min) at a rate of 10°C/min, from 50°C up to a temperature of 270°C. Indium metal (TA instruments) was used as the calibration standard. Reported temperatures are the onset temperatures.
Spectroscopy
FT-IR spectra were recorded using FT-IR spectrometer (PerkinElmer, USA) equipped with Spectrum-100 analyzing software. Potassium bromide (spectroscopy grade) (Merck, Darmstadt, Germany) disk pelletization method was employed for sample preparation. The pellets were prepared by mixing of the sample with potassium bromide (1:100) in a mortar and compressed at a pressure of 6 to 8 bar. Each spectrum was derived from 16 single averaged scans collected in the mid IR region of 400–4,000 cm−1 at a spectral resolution of 2.0 cm−1.
The spectrometer was equipped with a solid-state probe, cross-polarization magic angle spinning (CP/MAS-II) and 13C Solid State Nuclear Magnetic Spectroscopy (13C SSNMR) spectra were recorded with Bruker Avance-II 75 MHz spectrometer (Bruker, Switzerland) with TOPSPIN version 2.0 software. The static field of the superconducting magnet was 7.05 T and cross-polarization total suppression of spinning side bands (CP/TOSS) pulse sequence was used to perform the experiments. The instrument was operated at a spinning rate of 5 KHz. The cross polarization magic angle and 13C signal were optimized using KBr and glycine as standards, respectively.
Solution 1H-NMR spectra were acquired at ambient temperature on a Bruker Avance-II 300 MHz spectrometer at a 1H Larmor frequency of 300.131 MHz and DMSO-d6 was used as a solvent. The spectrum was acquired with a 1H pulse width of 10.50 μs, a 3.64-s acquisition time, a 5-s delay between scans, a spectral width of 15 ppm and 32 co-added scans. The free induction decay was processed using TOPSPIN version 2.0 software and an exponential line broadening factor of 0.2 Hz to improve the signal-to-noise ratio.
Results and discussion
Crystal Structure Analysis by SXRD
Form I crystallized as plate morphs in the monoclinic crystal system (space group P21) with one molecule each of 10-DAB III and dimethyl sulfoxide in the asymmetric unit (Table I). O–H···O hydrogen bond (Table II) between the host molecules (O1–H1···O8, 2.14, 146; O2–H2A···O6, 2.00, 170 and O4–H4···O10, 2.32, 158.1) form two adjacent ring motifs  , and
, and  (Fig. 3). Guest molecules are connected to the host molecules by O–H···O11 hydrogen bond (O5–H5A···O11, 1.99, 172). The O4–H4 hydroxyl groups do not participate in any intermolecular hydrogen bonding.
Table I.
Crystallographic Parameters of Forms I, II, and III
| I | II | III CSD Ref Code:WOVSAB | |
|---|---|---|---|
| Empirical formula | C29H36O10·C2H6OS | C29H36O10·C4H9NO | C29H36O10·2C2H6OS |
| Formula weight | 622.71 | 631.70 | 700.83 |
| Crystal system | Monoclinic | Monoclinic | Monoclinic |
| Space group | P21 | C2 | P21 |
| T (K) | 298 | 298 | 293 |
| a/Å | 8.5605(8) | 42.066(7) | 9.3677(10) |
| b/Å | 13.4700(11) | 8.5246(10) | 21.991(4) |
| c/Å | 13.6383(11) | 9.2940(13) | 9.4564(11) |
| α/° | 90.00 | 90.00 | 90.00 |
| β/° | 100.284(8) | 100.959(14) | 115.827(9) |
| γ/° | 90.00 | 90.00 | 90.00 |
| V/Å3 | 1547.4(2) | 3272.0(8) | 1753.5(4) |
| Dcalcd(g cm−3) | 1.337 | 1.282 | 1.327 |
| μ(mm−1) | 0.164 | 0.096 | 0.213 |
| Z/Z′ | 1/2 | 1/4 | 1/2 |
| Reflns collected | 11537 | 6633 | 4342 |
| Unique reflns | 6306 | 3940 | 4103 |
| Observed reflns | 3785 | 5234 | 3005 |
| R 1 [I > 2 σ(I)] | 0.0575 | 0.0495 | 0.056 |
| wR 2 (all) | 0.0774 | 0.0983 | 0.136 |
| Goodness-of-fit | 0.995 | 1.034 | – |
| Size of crystal (mm3) | 0.34 × 0.30 × 0.24 | 0.42 × 0.32 × 0.30 | 0.5 × 0.4 × 0.3 |
Table II.
Hydrogen Bond Geometries in Crystal Structures of Form I and II
| Interactions | H···A/ Å | D···A/ Å | ∠D–H···A/º | Symmetry code |
|---|---|---|---|---|
| Form I | ||||
| O(1)─H(1)···O(8) | 2.14 | 2.862 | 146 | −1 + x,y,z |
| O(2)─H(2A)···O(6) | 2.00 | 2.816 | 170 | 1−x,−1/2 + y,−z |
| O(4)─H(4)···O(3) | 2.18 | 2.615 | 113 | Intramolecular |
| O(4)─H(4)···O(10) | 2.32 | 3.093 | 158 | −x,−1/2 + y,−z |
| O(5)─H(5A)···O(11) | 1.99 | 2.808 | 172 | 1−x,1/2 + y,1−z |
| C(2)─H(2)···O(10) | 2.31 | 2.739 | 106 | Intramolecular |
| C(3)─H(3)···O(8) | 2.53 | 3.093 | 116 | Intramolecular |
| C(5)─H(5)···O(10) | 2.49 | 3.441 | 163 | 1 + x,y,z |
| C(14)─H(14B)···O(9) | 2.44 | 2.882 | 107 | Intramolecular |
| C(16)─H(16B)···O(4) | 2.55 | 3.161 | 122 | Intramolecular |
| C(16)─H(16C)···O(3) | 2.51 | 3.082 | 119 | Intramolecular |
| C(17)─H(17C)···O(1) | 2.56 | 2.918 | 102 | Intramolecular |
| C(19)─H(19A)···O(6) | 2.45 | 3.312 | 149 | Intramolecular |
| C(26)─H(26)···O(5) | 2.52 | 3.266 | 137 | 1−x,1/2 + y,1−z |
| C(29)─H(29)···O(3) | 2.56 | 3.198 | 126 | −x,1/2 + y,−z |
| Form II | ||||
| O(1)─H(1)···O(8) | 2.15 | 2.892 | 150 | x,−1 + y,z |
| O(2)─H(2)···O(11) | 1.83 | 2.627 | 165 | – |
| O(4)─H(4)···O(3) | 2.07 | 2.571 | 119 | Intramolecular |
| O(5)─H(5)···O(2) | 1.98 | 2.800 | 173 | x,y,1 + z |
| C(2)─H(2A)···O(10) | 2.24 | 2.694 | 107 | Intramolecular |
| C(3)─H(3)···O(8) | 2.50 | 3.076 | 117 | Intramolecular |
| C(5)─H(5A)···O(10) | 2.43 | 3.368 | 160 | x,1 + y,z |
| C(14)─H(14A)···O(9) | 2.54 | 2.945 | 105 | Intramolecular |
| C(17)─H(17A)···O(3) | 2.58 | 3.196 | 122 | Intramolecular |
| C(17)─H(17C)···O(4) | 2.56 | 3.135 | 119 | Intramolecular |
| C(19)─H(19B)···O(6) | 2.43 | 3.287 | 148 | Intramolecular |
| C(31)─H(31C)···O(3) | 2.58 | 3.454 | 151 | x,1 + y,z |
Fig. 3.
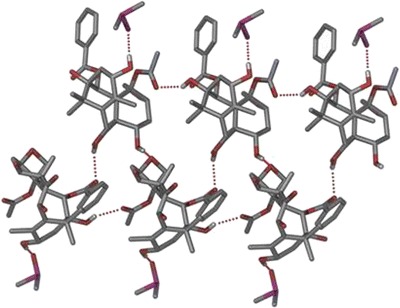
Ring motif  , and
, and  of the host molecule of Form I. Guest molecules are connected by O–H···O hydrogen bond
Form II crystallized as needles in the monoclinic crystal system (space group C2) with one molecule of each of 10-DAB III and dimethyl acetamide in the asymmetric unit (Table I). The O–H···O hydrogen bond (Table II) is the structure governing interaction although several auxiliary C–H···O hydrogen bonds are also present in the crystal structure. The O–H···O hydrogen bonding between the host molecules (O5─H5···O2, 1.98 Å, 173° and O1─H1···O8, 2.15 Å, 150°) form a ring motif  (Fig. 4a). DMA molecules are connected to 10-DAB III molecules via O–H···O hydrogen bond (O2–H2···O11, 1.83 Å, 165°) as shown in Fig. 4b. The DMA molecules are interconnected by very weak C–H···O single hydrogen bonds (C32–H32A···O11, 2.78, 117) to form a zigzag chain along C2 axis (Fig. 4c). Unlike in Form I, the O4–H4 hydroxyl groups do not participate in any intermolecular hydrogen bonding. Another contrasting feature is that there is no interaction between the guest molecules as observed in Form I. The conformational differences are shown in Fig. 5.
Fig. 4.
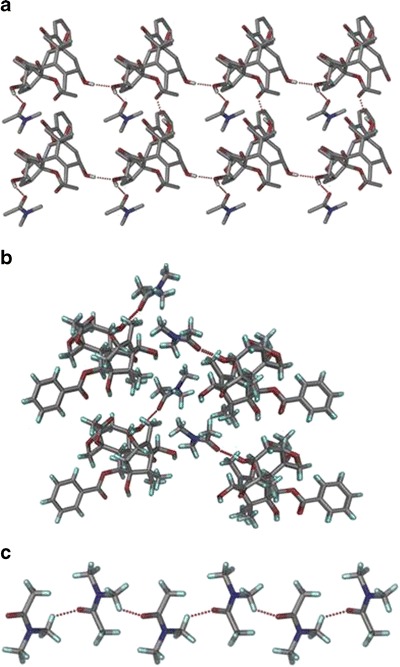
a O–H···O hydrogen bond forms the ring motif  . b 10-DAB III molecules are connected DMA via O─H···O hydrogen bond. c Zig zag chains of DMA molecules connected by C–H···O hydrogen bond along C2 rotation axis
Fig. 5.
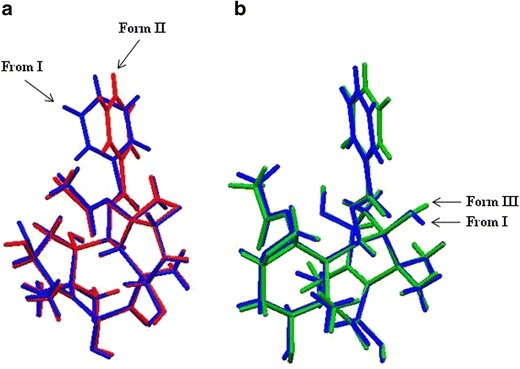
Overlay diagram showing the differences in conformation of a O–H groups of C13 and benzoate group. b O–H directions of C1
PXRD
The crystals of 10-DAB III solvates were gently ground in a mortar pestle and the powdered samples were analyzed by PXRD. The PXRD patterns of all the solvated forms of 10-DAB III are shown in Fig. 6a. The distinct patterns show that the solvates posses different crystal structures. The following characteristic 2θ peak positions can be used to discriminate the solid forms. Form I: 6.66, 9.32, 12.44, 13.26, 14.74, 16.78, 16.86, 19.92, 20.92, 21.80, 23.90, 24.12, and 27.48° 2θ; II: 4.16, 8.40, 9.58, 14.48, 17.90, 19.02, 19.48, 21.10, 21.70, 22.34, and 22.66° 2θ; III: 8.00, 10.30, 11.08, 11.22, 13.66, 16.06, 16.34, 19.18, 19.44, 20.56, 21.12, 22.40, 22.50 and 21.14° 2θ;IV: 6.40, 9.10, 12.96, 13.14, 14.44, 14.70, 16.48, 16.74, 19.18, 20.42, 23.66, 24.86, and 27.00° 2θ. The experimental PXRD patters of Form I, II, and III were compared with the simulated patterns from the single-crystal diffraction structures. Figure 6b–d shows excellent agreement between experimental and simulated patterns for the three solvates.
Fig. 6.
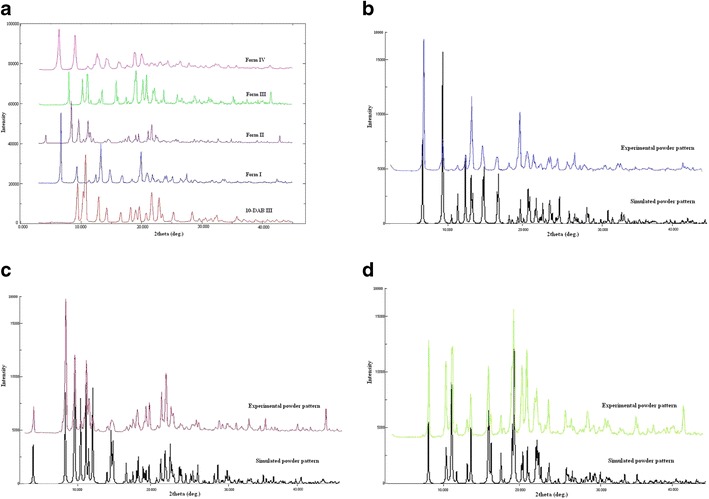
a Overlaid PXRD diffractograms of 10-DAB III and its solid forms. b Overlay of simulated and experimental powder patterns of Form I. c Overlay of simulated and experimental powder patterns of Form II. d Overlay of simulated and experimental powder patterns of Form III
TGA
The data on weight loss obtained by thermogravimetric analysis was evaluated for determining the solvent to solute ratios of the solvated forms of 10-DAB III. The experimental results of thermogravimetric analysis are tabulated in Table III and the thermograms of 10-DAB III with its corresponding solvate are presented in Fig. 7.
-
Forms I and III
The TGA curve of DABM-DMSO represent weight loss beginning at about 91°C probably due to the loss of solvent. The weight loss obtained for Forms I and III are about 12.8% and 21.6%, respectively. This loss in weight can be correlated to a stoichiometric release of 1.02 and 1.94 mol of DMSO. Thus, it can be inferred from the TGA data that 10-DAB III accommodates DMSO solvent in a 1:1 and 1:2 stoichiometric molar ratios in Forms I and III, respectively.
-
Form II
From TGA analysis, the weight loss observed for DABDMA was 12.9% at about 74°C. This weight loss corresponds to 0.94 mol of DMA solvent. Thus, it can be concluded that the 10-DAB III can accommodate DMA solvent in a 1:1 stoichiometric molar ratio in Form II.
-
Form IV
From TGA analysis, the weight loss observed for DABDMF was 11.5% at about 92°C. This weight loss corresponds to 0.97 mol of DMF solvent. Thus, it can be concluded that the 10-DAB III can accommodate DMF solvent in a 1:1 stoichiometric molar ratio in Form IV.
Table III.
Comparison of the DSC and TGA Data of 10-DAB III and its Solid Forms
| Compound | Endotherm (°C)a | ΔH (J/g) | Endotherm (°C)b | ΔH (J/g) | Weight loss (%) | |
|---|---|---|---|---|---|---|
| Experimental | Expected | |||||
| 10-DAB III | – | – | 247.97 | 54.51 | – | – |
| Form I | 129.86 | 35.54 | 246.01 | 50.99 | 12.84 | 12.54 |
| Form II | 138.60 | 102.80 | 252.67 | 56.33 | 12.92 | 13.80 |
| Form III | 166.05 | 93.77 | 248.20 | 57.20 | 21.60 | 22.28 |
| Form IV | 115.70 | 102.40 | 249.36 | 57.29 | 11.46 | 11.83 |
aEndotherms correspond to loss of solvent
bEndotherms correspond to onset temperature of solid forms
Fig. 7.
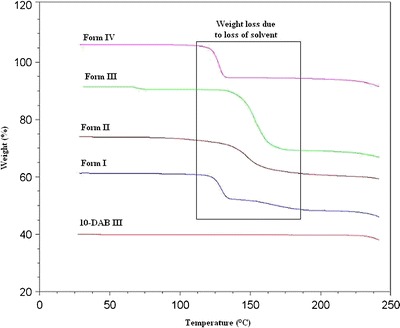
TGA thermograms of 10-DAB III and its solid forms
In Table III, a comparison has been made between the theoretical weight loss and the experimental weight loss from TGA data. From Table III, it can be seen that there is a good agreement between the experimental and theoretical weight loss, indicating that the solvent molecules exist in stoichiometric ratios within the crystal lattices.
DSC
DSC thermograms of 10-DAB III and its solid forms are shown in Fig. 8 and the onset temperatures and its enthalpies are tabulated in Table III. All the four forms exhibit two endotherms, the first broad endotherm obtained in each form can be attributed to the desolvation while the second endotherm at a much higher temperature corresponds to the melting with decomposition.
Fig. 8.
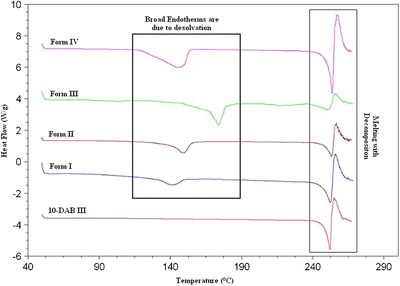
DSC thermograms of 10-DAB III and its solid forms
On comparing the results obtained from the DSC data of Forms I and III, distinct differences are observed in onset temperature as well as enthalpy; even though these two forms are crystallized from the same solvent, DMSO. In Forms I and III, the onset temperatures of first endotherm are at 129.9°C and 166.1°C, respectively. Similarly, the enthalpies of Forms I and III calculated from the first endotherm are 35.5 and 93.8 J/g, respectively. The differences in the onset temperatures and the enthalpies for the two forms are probably due to the different affinities of the solvent towards the solute. It can be inferred from the onset temperature and the enthalpy that DMSO is weakly bound to 10-DAB III in Form I, whereas DMSO solvent is strongly bound to 10-DAB III in Form III. This also indicates that there is a probable difference in the crystal packing of the two forms.
In the case of Forms II and IV observed onset temperatures of first endotherm at 138.6°C and 115.7°C, respectively. After desolvation, all the four solvates are found to melt at about 249°C, which in turn correspond to the melting temperature of 10-DAB III. Based on the above results, it can be concluded that after desolvation of all the forms are converted into a most stable form of 10-DAB III.
FT-IR
FT-IR spectroscopy has been successfully used for exploring the differences in molecular conformations, crystal packing and hydrogen bonding arrangements for different solid-state forms of organic compounds. The shift and splitting pattern of absorption bands in FT-IR spectrum usually indicate a change in force constant, corresponding to a change in the environment of the corresponding bond, such as the bond length and bond angle. Figure 9 shows the FT-IR spectra of 10-DAB III and its solvates (Forms I to IV). The spectra of 10-DAB III and its solvates display clear differences in the region 3,600–3,300 (–OH stretching) cm−1 and 1,724–1,682 (C═O) cm−1. The FT-IR spectra of both Forms I and IV demonstrate two C═O stretching frequencies apart from an amide C═O stretching. In case of 10-DAB III, Forms II and III, three C═O stretching frequencies are observed which could be due to the formation intramolecular hydrogen bond between C═O and the adjacent hydroxyl group. The amide C═O stretching frequencies at 1,667 and 1,630 cm−1are observed in Forms II and IV solid forms and stretching frequencies resulting from S═O are observed at 1,048 and 1,019 cm−1 in Forms I and III solvates. These stretching frequencies indicate that the solvent molecules are occluded in the crystal lattices. The observed wavenumbers are tabulated in Table IV.
Fig. 9.
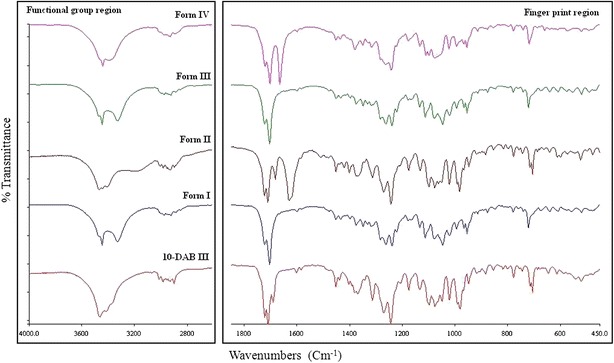
FT-IR spectra of 10-DAB III and its solid forms
Table IV.
Characteristic IR Bands of 10-DAB III and its Solid Forms
| Compound | –OH stretching frequency | C═O stretching frequencies |
|---|---|---|
| 10-DAB III | 3466 | 1723b, 1711b, 1691a |
| Form I | 3448, 3331 | 1724b, 1705b |
| Form II | 3442, 3396 | 1722b, 1703b, 1667c |
| Form III | 3550, 3412, 3280 | 1725b, 1708b, 1682a |
| Form IV | 3470, 3401 | 1724b, 1712b, 1683a, 1630c |
aWeek stretching vibration
bStrong stretching vibration
cAmide C═O stretching
13C SSNMR
In 13C SSNMR spectroscopy, the chemical shifts are influenced by molecular packing, molecular conformation, molecular mobility, molecular structure and other solid-state effects. This method can be quite useful in developing an understanding of structural differences between different polymorphs or pseudopolymorphs (27,28). The differences in SSNMR carbon chemical shifts have been exploited by researchers to identify and quantify different polymorphs in mixture which are formed concomitantly (29).
13C SSNMR spectra of 10-DAB III and its solid forms are shown in Fig. 10. The peak assignments based on liquid state 13C NMR spectroscopy are presented in Table V. As expected, the spectra of 10-DAB III and its solid forms (Forms I to IV) exhibited significant differences in their chemical shifts. In 10-DAB III, Forms I, II, III, and IV the carbonyl carbon C9 assigned to the resonance at 211.72, 210.15, 214.36, 215.33, and 210.38 ppm, respectively. In case of Forms II and III the carbonyl carbon C9 assigned to the resonance farthest downfield when compared to the other forms, which could be due to the formation of intra and intermolecular hydrogen bonding. On the other hand, in 10-DAB III, Forms I and IV the carbonyl carbon C9 does not participate in any hydrogen bonding which was also confirmed by the solution state 13C NMR data. In Forms I and III, the phenyl ring carbon atoms are expected to have typically four sets of signals but exhibited six different types of signals one from each carbon which is due to the differences in their torsion angles. The resonances of C2, C5, C9, C11, C12, C20, C21, and C23 are relatively well separated from those of other carbons; the chemical shifts of these carbons are chosen to distinguish the different morphs. The phenyl ring carbons (C24–C29) are assigned to the peaks between 127 and 135 ppm. For CH3, CH2, aliphatic CH and aliphatic quaternary carbons are assigned below 86.00 ppm. The peaks for other forms can be assigned similarly.
Fig. 10.
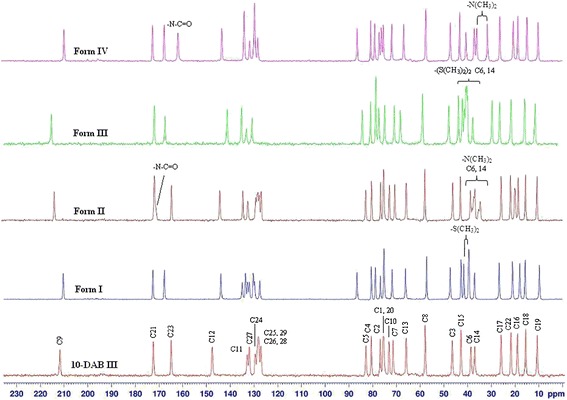
Carbon-13 CPMAS spectra of 10-DAB III and its solid forms
Table V.
SS NMR13C Chemical Shifts (δ/ppm) for 10-DAB III, Forms I to IV and Solution State of 10-DAB III
| Carbon atom | Solution state | Solid state | ||||
|---|---|---|---|---|---|---|
| 10-DAB III | 10-DAB III | I | II | III | IV | |
| 1 | 77.31 | 76.80 | 78.76 | 76.77 | 78.08 | 79.15 |
| 2 | 75.23 | 75.41 | 76.64 | 75.48 | 76.87 | 76.36 |
| 3 | 46.90 | 46.46 | 47.21 | 46.33 | 47.21 | 47.17 |
| 4 | 80.47 | 80.63 | 80.49 | 80.59 | 80.33 | 80.83 |
| 5 | 84.13 | 82.83 | 86.49 | 83.01 | 83.87 | 86.54 |
| 6 | 39.84 | 38.59 | 39.33 | 38.85 | 39.27 | 40.57 |
| 7 | 71.29 | 71.40 | 71.73 | 70.70 | 70.30 | 71.93 |
| 8 | 57.42 | 57.86 | 57.12 | 58.06 | 58.27 | 57.50 |
| 9 | 210.68 | 211.72 | 210.15 | 214.36 | 215.53 | 210.38 |
| 10 | 74.74 | 73.12 | 75.14 | 73.05 | 74.42 | 75.54 |
| 11 | 134.86 | 132.83 | 133.48 | 134.83 | 134.93 | 131.99 |
| 12 | 141.92 | 147.58 | 143.83 | 144.55 | 140.98 | 143.74 |
| 13 | 66.44 | 65.85 | 66.02 | 65.90 | 67.69 | 66.85 |
| 14 | 36.94 | 36.97 | 36.96 | 36.98 | 37.03 | 37.07 |
| 15 | 42.83 | 42.76 | 42.64 | 43.10 | 43.12 | 43.19 |
| 16 | 20.53 | 18.90 | 17.86 | 18.65 | 20.80 | 18.56 |
| 17 | 27.13 | 25.91 | 26.63 | 25.94 | 28.88 | 26.28 |
| 18 | 15.15 | 15.49 | 15.58 | 15.61 | 15.04 | 14.72 |
| 19 | 10.07 | 10.60 | 9.63 | 10.78 | 10.58 | 10.05 |
| 20 | 75.84 | 75.41 | 75.14 | 75.48 | 78.08 | 77.26 |
| 21 | 169.88 | 172.43 | 172.45 | 172.17 | 171.90 | 173.03 |
| 22 | 22.66 | 21.70 | 20.94 | 21.92 | 25.67 | 20.49 |
| 23 | 165.61 | 164.85 | 167.61 | 164.88 | 167.36 | 168.09 |
| 24 | 130.69 | 129.48 | 127.46 | 127.13 | 130.47 | 128.53 |
| 25 | 129.87 | 128.14 | 134.84 | 129.36 | 134.93 | 134.29 |
| 29 | 132.64 | 128.79 | ||||
| 26 | 129.01 | 127.12 | 131.86 | 128.47 | 132.87 | 129.88 |
| 28 | 129.67 | 127.95 | ||||
| 27 | 133.53 | 131.97 | 130.22 | 132.74 | 129.88 | |
The peaks resulting from solvents are clearly demarcated at δ 39.33 and 41.51 ppm in Form I; 20.05, 34.72, 35.40, 37.42, 38.15 and 171.63 ppm in II; 39.65, 40.00, 40.61 and 41.45 ppm in III and 31.53, 35.99 and 162.19 ppm in IV. In Form II, the nitrogen attached carbon atoms ((CH3)2) resonates four peaks instead of two with an approximate equal intensity due to coupling to 14N. Further, in Form III, four carbon signals are observed due to the presence of two molecules of DMSO located in different environments in the crystal packing system. Thus, the SSNMR provides valuable information for confirming the type of occluded solvent.
1H NMR
1H-NMR spectra (Fig. 11) were recorded in order to quantify the molecular proportions of solvate present in the solid-state forms of 10-DAB III. The stoichiometric ratios of solvents assessed by 1H NMR experiments are consistent with the weight loss measurements observed by TGA and also concord with the theoretical values (Table VI).
Fig. 11.
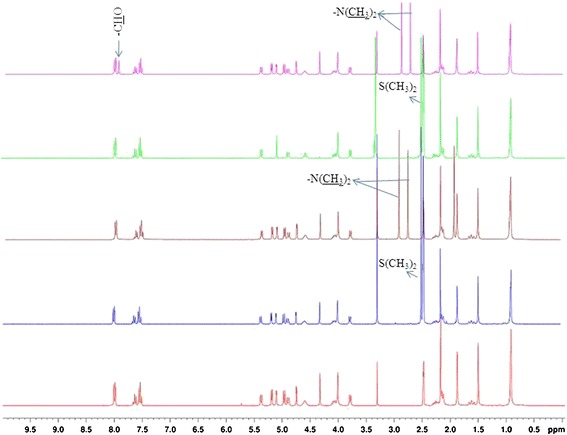
1H NMR spectra of 10-DAB III and its solid forms
Table VI.
Quantitative Analysis Results from Solution-State NMR Experiments of 10-DAB III Solvates
| Compound | Chemical shift, δH/ppm | Assignment | Molar ratio solvent: docetaxel |
|---|---|---|---|
| Form I | 2.514 | (CH3)2 | 1.01 |
| Form II | 2.917 | CH3 | 0.96 |
| 2.760 | CH3 | ||
| Form III | 2.514 | 2(CH3)2 | 2.07 |
| Form IV | 2.863 | CH3 | 0.97 |
| 2.784 | CH3 | ||
| 7.925 | CHO |
Conclusions
Pseudopolymorphs of 10-DAB III namely mono-DMSO (Form I), di-DMSO (Form III), mono-DMA (Form II), and mono-DMF (Form IV) were prepared by crystallization experiments. Crystallization of 10-DAB III from a single solvent (DMSO) resulted in formation of concomitant solvates mono-DMSO, di-DMSO, and crystallization in a binary mixture of solvents (DMSO/DMA, 1:1) resulted in formation of mono-DMA and di-DMSO solvates. Mono-DMF solvate was obtained by the crystallization of 10-DAB III in DMF solvent. All these four solvates are fully characterized by X-ray diffraction, thermal analysis, and spectroscopic techniques. Significant differences observed in the PXRD patterns of all the solid forms indicate the formation of distinct solid forms. From the thermal analysis, the author could confirm that the solvates, Forms I, II and IV, are having stoichiometric ratio of 1:1. But in case of Form III, the composition of 10-DAB III with DMSO solvent is found to be 1:2 stoichiometric ratio. The spectroscopic features of these solvates have been examined using FT-IR and SS 13C NMR. In all the three crystal structures of Forms I, II, and III molecules form a host framework and the solvent molecules form the guest framework. From the above experimental data, it can be stated that the hydroxyl moieties (acceptor) of 10-DAB III are involved in hydrogen bonding with the donor solvent molecules and hence it can be concluded that 10-DAB III forms pseudopolymorphs with different solvents. In summary, we have highlighted the rare occurrence of the formation of two different stoichiometric solvates concomitantly from a single solvent and also from a binary mixture of solvents.
Acknowledgments
We are grateful to the management of Aptuit Laurus Pvt. Ltd., for their encouragement and support to this research. We thank Dr. Naba Kamal Nath for single-crystal structure refinement.
Footnotes
Electronic supplementary information available: CCDC reference numbers 863865–863866
References
- 1.Hagan M. Clathrate inclusion compounds. New York: Reinhold; 1962. [Google Scholar]
- 2.Lehn J-M. Supramolecular chemistry. Weinheim: VCH; 1995. [Google Scholar]
- 3.Desiraju GR. Crystal engineering: the design of organic solids. Amsterdam: Elsevier; 1989. [Google Scholar]
- 4.Weber E. Shape and symmetry in the design of new hosts. In: MacNicol DD, Toda F, Bishop R, editors. Comprehensive supramolecular chemistry. Oxford: Pergamon; 1996. pp. 535–592. [Google Scholar]
- 5.Weber E. Scissor-type hosts: molecular design and inclusion behaviour. In: Atwood JL, Davies JED, MacNicol DD, editors. Inclusion compounds. Oxford: Oxford University Press; 1991. pp. 188–262. [Google Scholar]
- 6.Nangia A. Organic host–guest structures in the solid-state. In: Lu GQ, Zhao XS, editors. Nanoporous materials: science and engineering. London: Imperial College Press; 2004. pp. 165–187. [Google Scholar]
- 7.Bishop R. Designing new lattice inclusion hosts. Chem Soc Rev. 1996;25:311–319. doi: 10.1039/cs9962500311. [DOI] [Google Scholar]
- 8.MacNicol DD, Downing GA. Symmetry in the evolution of host design. In: MacNicol DD, Toda F, Bishop R, editors. Comprehensive supramolecular chemistry. Oxford: Pergamon; 1996. pp. 421–464. [Google Scholar]
- 9.Sumarna O, Seidel J. Crystal structure, thermal decomposition behavior, and order-disordertransition of the guest component of concomitant pseudodimorphic clathrates between 2,2′-bis(9-hydrozy-9-fluorenyl)biphenyl host and chloroform guest, 2003. Cryst Growth Des. 2003;3(4):541–546. doi: 10.1021/cg034013a. [DOI] [Google Scholar]
- 10.Ashmore J, Bishop R, Craig DC, Scudder ML. Comparison of the X-ray structures of concomitant pseudodimorphs formed between diquinoline host and d-chloroform guest. Mendeleev Commun. 2003;13:144. doi: 10.1070/MC2003v013n03ABEH001764. [DOI] [Google Scholar]
- 11.Fabbiani FPA, Byrne LT, McKinnon JJ, Spackman MA. Solvent inclusion in the structural voids of Form II carbamazepine: single-crystal X-ray diffraction, NMR spectroscopy and Hirshfeld surface analysis. CrystEngComm. 2007;9:728–731. doi: 10.1039/b708303n. [DOI] [Google Scholar]
- 12.Banerjee R, Bhatt PM, Desiraju GR. Solvates of sildenafil saccharinate. A new host material. Cryst Growth Des. 2006;6(6):1468–1478. doi: 10.1021/cg0601150. [DOI] [Google Scholar]
- 13.Sarma B, Nangia A. Tetrakis(4-sulfophenyl)methane didecahydrate. Reversible and selective water inclusion and release in an organic host. CrystEngComm. 2007;9:628–631. doi: 10.1039/b706194c. [DOI] [Google Scholar]
- 14.Organo VG, Rudkevich DM. Emerging host–guest chemistry of synthetic nanotubes. Chem Commun. 2007;38:3891–3899. doi: 10.1039/b704231k. [DOI] [PubMed] [Google Scholar]
- 15.Sarma RJ, Baruah JB. Supramolecular and host–guest chemistry of bis-phenol and analogues. Cryst Growth Des. 2007;7(5):989–1000. doi: 10.1021/cg060899h. [DOI] [Google Scholar]
- 16.Jacobs A, Roex T, Nassimbeni LR, Toda F. Inclusion of volatile guests by a tetrapedal host: structure and kinetics. Org Biomol Chem. 2006;4(12):2452–2457. doi: 10.1039/b602367n. [DOI] [PubMed] [Google Scholar]
- 17.Cabeza AJC, Day GM, Motherwell WDS, Jones W. Solvent inclusion in Form II of carbamazepine. Chem Commun. 2007;1600–1602. doi:10.1039/b701299c. [DOI] [PubMed]
- 18.Burchell TJ, Soldatov DV, Enright GD, Ripmeester JA. The ability of lower peptides to form co-crystals: inclusion compounds of Leu-Leu-Leutripeptide with pyridine and picolines. CrystEngComm. 2007;9:922–929. doi: 10.1039/b708695d. [DOI] [Google Scholar]
- 19.Dalrymple SA, Shimizu GKH. Selective guest inclusion in a non-porous H-bonded host. Chem Commun. 2006;9:956–958. doi: 10.1039/b515735h. [DOI] [PubMed] [Google Scholar]
- 20.Atwood JL, Barbour LJ, Jerga A. Storage of methane and freon by interstitial van der Waals confinement. Science. 2002;296(5577):2367–2369. doi: 10.1126/science.1072252. [DOI] [PubMed] [Google Scholar]
- 21.Bernstein J, Davey RJ, Henck JO. Polymorphism in pharmaceutical industry. Angew Chem Int Ed. 1999;38:3440–3461. doi: 10.1002/(SICI)1521-3773(19991203)38:23<3440::AID-ANIE3440>3.0.CO;2-#. [DOI] [PubMed] [Google Scholar]
- 22.Das D, Barbour LJ. Concomitant formation of two different solvates of a hexa-host form a binary mixture of solvents. ChemCommun. 2008;5110–5112. [DOI] [PubMed]
- 23.le Roux T, Nassimbeni LR, Weber E. Clathrates with mixed guests. Chem. Commun. 2007;1124–1126. [DOI] [PubMed]
- 24.le Roux T, Nassimbeni LR, Weber E. Selectivity and structure of mixed guest clathrates. New J Chem. 2008;32:856–863. doi: 10.1039/b718397f. [DOI] [Google Scholar]
- 25.Harper JK, Dalley NK, Mulgrew AE, West FG, Grant DM. 10-Deacetyl baccatin III dimethyl sulfoxidedesolvate. Acta Cryst. 2001;C57:64–65. doi: 10.1107/s0108270100011781. [DOI] [PubMed] [Google Scholar]
- 26.Dolomanov OV, Blake AJ, Champness NR, Schröder M. J Appl Cryst. 2003;3:1283. doi: 10.1107/S0021889803015267. [DOI] [Google Scholar]
- 27.Brittain HG. Physical characterization of pharmaceutical solids. New York, NY: Marcel Dekker; 1995. [DOI] [PubMed] [Google Scholar]
- 28.Padden BE, Zell MT, Dong Z, Schroeder SA, Grant DJW, Munson EJ. Anal Chem. 1999;71:3325–3331. doi: 10.1021/ac9902446. [DOI] [Google Scholar]
- 29.Vickery RD, Nemeth GA, Maurin MB. J Pharmaceut Biomed Anal. 2002;30:125–129. doi: 10.1016/S0731-7085(02)00203-0. [DOI] [PubMed] [Google Scholar]


