

Abstract
Nicotine and a variety of other drugs and toxins are metabolized by cytochrome P450 (CYP) 2A6. The aim of the present study was to build a quantitative structure-activity relationship (QSAR) model to predict the activities of nicotine analogues on CYP2A6. Kernel partial least squares (K-PLS) regression was employed with the electro-topological descriptors to build the computational models. Both the internal and external predictabilities of the models were evaluated with test sets to ensure their validity and reliability. As a comparison to K-PLS, a standard PLS algorithm was also applied on the same training and test sets. Our results show that the K-PLS produced reasonable results that outperformed the PLS model on the datasets. The obtained K-PLS model will be helpful for the design of novel nicotine-like selective CYP2A6 inhibitors.
Keywords: Kernel partial least squares, CYP2A6, nicotine derivatives, inhibitors
1. Introduction
Cytochrome P450 2A6 (CYP2A6), the major coumarin 7-hydroxylase present in human liver (Cashman, etc., 1992; Pearce, etc., 1992; Shimada, etc., 1996), is known to metabolize a variety of compounds including quinoline (Reigh, etc., 1996), nicotine (Nakajima, etc., 1996), cotinine (Nakajima, etc., 1996), and various N-nitroso compounds present in cigarette smoke (Guengerich, etc., 1994). Hepatic CYP2A6 catalyses the major route of nicotine metabolism via the intermediacy of the aldehyde oxidase-catalyzed iminium ion that is converted to the metabolite, cotinine. (Cashman, etc., 1992; Tricker, 2003; Hukkanen, etc., 2005). The efficiency of CYP2A6-mediated metabolism of nicotine is closely related to the specific concentration of nicotine in blood for keeping addiction liability. Potent and specific inhibitors of the CYP2A6 enzyme might improve nicotine bioavailability and thus make oral nicotine administration feasible in smoking cessation therapy. The inhibition of CYP2A6 may decrease the number of cigarettes a person needs to smoke to obtain their desired blood nicotine concentration. Nowadays, a number of compounds tested as CYP2A6 inhibitors possess strong inhibitory effects (Draper, etc., 1997; Maenpaa, etc., 1993; Fujita, etc., 2003). However, to our knowledge, no compounds have been characterized as both potent and selective CYP2A6 inhibitors. In the present study QSAR models were established based on a series of nicotine derivatives, with the ultimate aim of aiding the prediction and development of a potent and specific CYP2A6 inhibitor. The in silico methods were built employing electrotopological state descriptors by using kernel partial least squares (K-PLS), a relatively novel method in chemometrics compared to the partial least squares (PLS) method.
The partial least squares method (Wold, 1975; Wold, etc., 1984) has been a popular modeling, regression, discrimination and classification technique in its domain of origin chemometrics. In its general form PLS creates orthogonal score vectors by using the existing correlations between different sets of variables while also keeping most of the variance of all sets. It is a statistical tool specifically designed to deal with multiple regression problems, where the number of observations is limited, the missing data are numerous and the correlations between the predictor variables are high.
PLS has proven to be useful in situations where the number of observed variables is much greater than the number of observations and high multicollinearity among the variables exists. This situation is quite common in the case of kernel-based learning where the original data are mapped to a highdimensional feature space corresponding to a reproducing kernel Hilbert space. Too high dimensions also cause problems like overfitting, thus leading to the decrease of the prediction accuracy of the external data. As an alternative to PLS, a nonlinear PLS has been newly developed based on kernel methods, i.e., kernel partial least squares. In the next section, a detailed description of K-PLS was offered.
The outline of the paper is as follows. The kernel partial least squares analysis was introduced based on an optimization-derived method. QSAR models were built for nicotine analogues employing K-PLS for a library of 58 nicotine analogues as CYP2A6 selective inhibitors (Denton, etc., 2005). Finally, PLS and K-PLS were compared to determine which exhibits superior performance.
2. Material and methods
2.1. Kernel partial least squares
As a generic kernel regression method, kernel partial least squares has been proven to be more competitive, and even more stable than other kernel regression algorithms such as support vector machines (SVM) and kernel ridge regression, and this method is also much more easily implemented (John and Nello, 2004).
The idea of the kernel PLS is developed based on the mapping of the original Ξ-space data into a high-dimensional feature space. A kernel is a continuous function κ: Ξ × Ξ → P for which there exists an Φ inner product space as a representation space and a map φ : Ξ → Φ such that for all x, yε Ξ
| (1) |
This definition allows us to perform calculations in the Φ space in an implicit way, by substituting the scalar product operation with its corresponding kernel version.
In the following part, a derivation of Direct Kernel Partial Least Squares (DK-PLS) based on the optimization algorithm (Bennett and Embrechts, 2003) for nonlinear regression is introduced. The DKPLS is developed on the basis of a direct factorization of the kernel matrix. DK-PLS has the advantage that the kernel does not need to be square, which factorizes the kernel matrix directly and then the final regression function is computed based on this factorization. We provide here the simplified algorithm for one response variable, which is more popular in QSAR modeling.
Lets consider the data sample (X, Y) where X εRm×n, Y εRm×1 ; X and Y represent the variable matrix and the response matrix (normally a one-dimensional vector), respectively. First to define a Gram matrix in feature space: K0 = Φ(X )Φ(X ′), i.e., Kij = K (Xi, Xj). Let Kc be the centered form of K0, the Y′ = y has been normalized to have mean 0 and standard deviation 1. Let M be the desired number of latent variables.
from k = 1 to M
Kij = K (Xi, Xj)
um = KmKm′ym
um = um/||um||
Km+1 = Km − umum′Km
ym+1 = ym − umum′Ym
ym+1 = ym+1/||ym+1||
-
The final regression coefficients r are calculated by the following formula
where the mth columns of Y and U are ym and um respectively.
-
The final predictions are
It should be noted that the test data should be centralized before, according to the following formula:
where 1 is the vector of element 1, I is the unit matrix. As we can see that this algorithm is easy to be complemented using C- or other languages. This derivation should make the PLS algorithm more accessible to machine learning researchers and popularly used for chemometrics applications.
Meanwhile, in order to compare the performances of K-PLS and PLS methods on the data set, the Partial Least Squares regression using the SIMPLS algorithm is also proposed (Jong, 1993). The same training and test sets are applied for both K-PLS and PLS models.
2.2. Data set
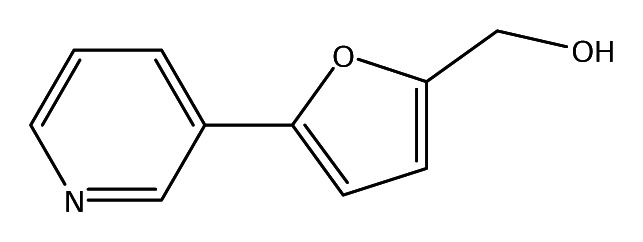
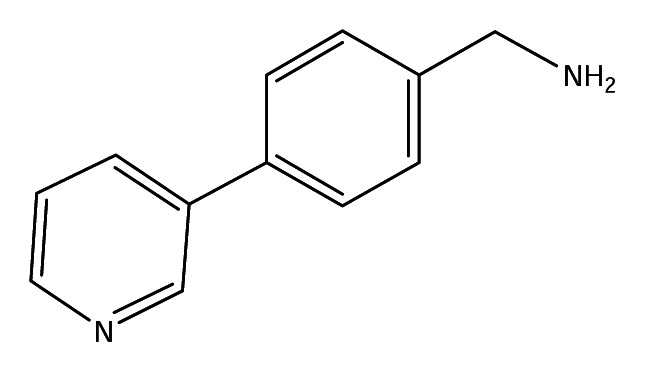
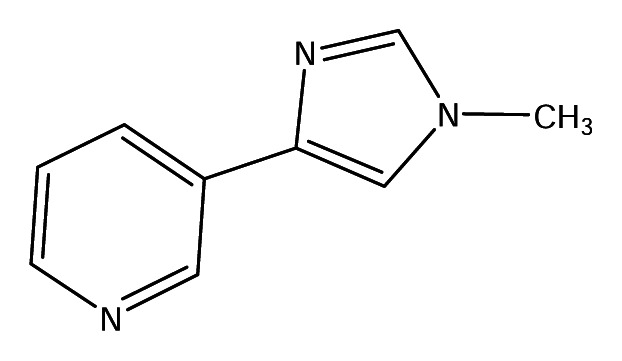
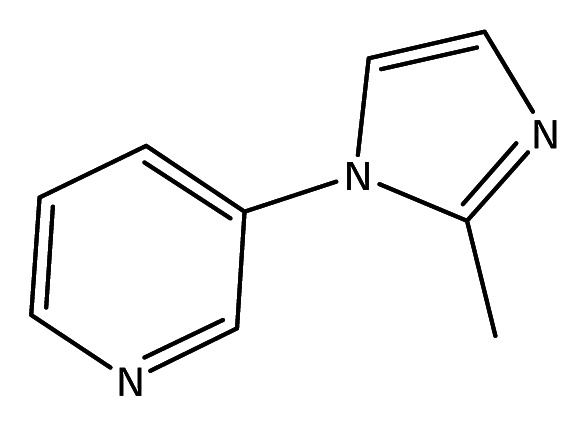
In the present study, we used a data set of 55 nicotine analogues whose selective inhibition on CYP2A6 was reported in the literature (Denton, etc., 2005). All these compounds were shown in Tables 1 and 2. The relative potency of the analogues, expressed by Ki values, on the functional activity of cDNA-expressed human CYP2A6 were determined by examining coumarin 7-hydroxylation (Denton, etc., 2005). Several molecules (Tables 1, 2) with un-deterministic chemical structure such as molecule 38b in the original paper (Denton, etc., 2005) were omitted in this work. In order to guarantee the linear distribution of the biological data, the Ki values were transformed into -LogKi.
Table 1.
-LogKi values and molecular descriptors for nicotine analogues
| name | pKi | sumdelI | sumI | Qv | nHBd | nHBa | nwHBa | SHBd | SHBa | SwHBa | Hmax | Gmax | Hmin | nrings |
|---|---|---|---|---|---|---|---|---|---|---|---|---|---|---|
| S1 | 0.68 | 6.783 | 31.5 | 0.969 | 0 | 3 | 9 | 0 | 17.783 | 11.68 | 1.447 | 12.521 | 0.62 | 2 |
| S2 | −1.83 | 3.894 | 29 | 1.319 | 0 | 3 | 9 | 0 | 10.923 | 14.346 | 1.424 | 5.009 | 0.614 | 2 |
| S3 | −0.18 | 2.921 | 26.25 | 1.396 | 0 | 2 | 9 | 0 | 5.892 | 14.826 | 1.364 | 4.141 | 0.605 | 2 |
| S4 | 0.10 | 5.504 | 30.833 | 0.933 | 0 | 3 | 10 | 0 | 15.938 | 14.895 | 1.431 | 10.446 | 1.237 | 2 |
| S5* | −0.15 | 6.29 | 32.5 | 1.05 | 0 | 3 | 10 | 0 | 16.626 | 14.292 | 1.379 | 11.085 | 0.686 | 2 |
| S6 | 0.66 | 1.829 | 22.167 | 1.168 | 0 | 2 | 9 | 0 | 5.752 | 16.415 | 1.328 | 4.045 | 1.186 | 2 |
| S7 | 0.01 | 6.481 | 29.833 | 0.849 | 0 | 3 | 9 | 0 | 17.61 | 12.223 | 1.434 | 12.42 | 1.212 | 2 |
| S8 | −0.99 | 3.656 | 27.333 | 1.188 | 0 | 3 | 9 | 0 | 10.799 | 14.917 | 1.411 | 4.978 | 0.723 | 2 |
| S9 | −0.65 | 2.701 | 24.583 | 1.251 | 0 | 2 | 9 | 0 | 5.795 | 15.4 | 1.351 | 4.098 | 1.198 | 2 |
| S10* | 0.60 | 2.086 | 23.833 | 1.331 | 0 | 2 | 9 | 0 | 5.82 | 15.89 | 1.336 | 4.086 | 0.593 | 2 |
| S11 | −0.42 | 6.826 | 31.5 | 0.969 | 0 | 3 | 9 | 0 | 17.778 | 11.685 | 1.442 | 12.52 | 0.62 | 2 |
| S12 | −0.82 | 3.937 | 29 | 1.319 | 0 | 3 | 9 | 0 | 10.897 | 14.373 | 1.419 | 5.008 | 0.614 | 2 |
| S13 | −1.83 | 7.093 | 32.5 | 0.84 | 0 | 3 | 10 | 0 | 19.5 | 13 | 1.479 | 10.342 | 1.255 | 2 |
| S14 | −0.89 | 2.833 | 25.333 | 1.074 | 0 | 2 | 10 | 0 | 8.23 | 17.103 | 1.364 | 4.209 | 1.187 | 2 |
| S15* | −1.65 | 3.2 | 27 | 1.217 | 0 | 2 | 10 | 0 | 8.371 | 16.578 | 1.372 | 4.309 | 0.63 | 2 |
| S16* | −0.71 | 3.23 | 27 | 1.217 | 0 | 2 | 10 | 0 | 8.321 | 16.622 | 1.37 | 4.27 | 0.585 | 2 |
| S17 | −0.43 | 3.261 | 27 | 1.217 | 0 | 2 | 10 | 0 | 8.352 | 16.62 | 1.368 | 4.309 | 0.576 | 2 |
| S18 | −0.99 | 3.301 | 27 | 1.217 | 0 | 2 | 10 | 0 | 8.454 | 16.56 | 1.37 | 4.403 | 0.621 | 2 |
| S19 | −0.26 | 3.659 | 26.333 | 0.994 | 0 | 3 | 9 | 0 | 12.177 | 14.157 | 1.395 | 4.098 | 1.243 | 2 |
| S20 | −1.44 | 3.458 | 26.333 | 0.994 | 0 | 3 | 9 | 0 | 11.85 | 14.483 | 1.384 | 4.006 | 1.235 | 2 |
| S21 | −0.80 | 4.537 | 29.111 | 1.047 | 0 | 3 | 10 | 0 | 13.688 | 15.423 | 1.407 | 5.672 | 1.234 | 2 |
| S22* | −0.04 | 2.732 | 25.333 | 1.074 | 0 | 2 | 10 | 0 | 8.067 | 17.267 | 1.353 | 4.033 | 1.221 | 2 |
| S23 | −1.65 | 3.82 | 32.667 | 1.093 | 0 | 2 | 14 | 0 | 8.543 | 24.124 | 1.429 | 4.43 | 1.206 | 3 |
| S24 | 0.605 | 3.047 | 23.833 | 1.01 | 1 | 3 | 8 | 1.693 | 10.967 | 12.866 | 1.693 | 4.091 | 1.225 | 2 |
| S25 | −0.795 | 3.55 | 25.5 | 1.163 | 1 | 3 | 8 | 1.715 | 11.33 | 12.24 | 1.715 | 4.285 | 0.631 | 2 |
| S26 | 0.62 | 5.154 | 32.833 | 0.955 | 1 | 4 | 10 | 2.629 | 16.947 | 15.886 | 2.629 | 8.363 | 1.244 | 2 |
| S27 | 0.15 | 6.739 | 34.5 | 0.865 | 1 | 4 | 10 | 2.647 | 20.509 | 13.991 | 2.647 | 8.297 | 1.262 | 2 |
| S28 | −0.14 | 6.739 | 34.5 | 0.865 | 1 | 4 | 10 | 2.647 | 20.509 | 13.991 | 2.647 | 8.297 | 1.262 | 2 |
| S29 | 1.40 | 5.323 | 29 | 1.055 | 1 | 3 | 9 | 1.49 | 14.891 | 13.679 | 1.49 | 5.454 | 0.792 | 2 |
| S30 | 1.70 | 3.697 | 27.333 | 1.188 | 1 | 3 | 9 | 1.463 | 11.329 | 15.389 | 1.463 | 5.536 | 0.744 | 2 |
| S31 | 0.55 | 4.736 | 29.5 | 1.182 | 1 | 3 | 9 | 1.54 | 12.688 | 14.167 | 1.54 | 5.608 | 0.556 | 2 |
| S32 | 0.75 | 2.931 | 27.833 | 1.328 | 1 | 3 | 9 | 1.513 | 9.059 | 15.877 | 1.513 | 4.107 | 0.539 | 2 |
| S33 | −1.35 | 2.594 | 29.333 | 1.473 | 0 | 3 | 9 | 0 | 8.14 | 16.015 | 1.359 | 4.128 | 0.561 | 2 |
| S34* | −1.67 | 4.515 | 31 | 1.319 | 0 | 3 | 9 | 0 | 11.835 | 14.305 | 1.386 | 5.699 | 0.579 | 2 |
| S35 | −0.75 | 5.053 | 29.333 | 1.031 | 1 | 3 | 9 | 2.463 | 14.529 | 14.688 | 2.463 | 8.893 | 0.869 | 2 |
| S36 | −1.55 | 6.68 | 31 | 0.923 | 1 | 3 | 9 | 2.49 | 18.091 | 12.978 | 2.49 | 8.788 | 0.917 | 2 |
| S37 | 1.05 | 3.317 | 23.167 | 1.086 | 1 | 2 | 7 | 1.45 | 9.077 | 13.692 | 1.45 | 5.182 | 0.74 | 1 |
| S38* | 0.05 | 2.731 | 23.667 | 1.247 | 1 | 2 | 7 | 1.5 | 6.884 | 14.192 | 1.5 | 3.941 | 0.527 | 1 |
| S39 | −1.36 | 2.643 | 25.167 | 1.415 | 0 | 2 | 7 | 0 | 5.997 | 14.387 | 1.335 | 3.966 | 0.549 | 1 |
| S40 | −0.15 | 3.839 | 29.5 | 1.182 | 1 | 2 | 11 | 1.45 | 9.605 | 19.304 | 1.45 | 5.526 | 0.72 | 2 |
| S41 | −1.04 | 2.419 | 25.5 | 1.479 | 0 | 2 | 9 | 0 | 5.959 | 15.339 | 1.349 | 4.188 | 0.589 | 2 |
| S42* | 0.77 | 2.215 | 23.833 | 1.331 | 0 | 2 | 9 | 0 | 5.857 | 15.918 | 1.336 | 4.145 | 0.583 | 2 |
| S43* | 0.23 | 3.516 | 25.833 | 1.133 | 1 | 3 | 9 | 1.569 | 11.229 | 14.605 | 1.569 | 5.614 | 1.22 | 2 |
| S44* | 0.89 | 2.833 | 25.333 | 1.178 | 0 | 3 | 8 | 0 | 10.149 | 13.233 | 1.367 | 4.209 | 0.641 | 2 |
| S45 | 0.28 | 3.343 | 26.833 | 1.232 | 0 | 3 | 8 | 0 | 10.371 | 13.419 | 1.371 | 4.28 | 0.498 | 2 |
| S46 | 0.64 | 4.042 | 36.5 | 1.127 | 0 | 3 | 14 | 0 | 10.592 | 25.067 | 1.445 | 4.406 | 0.928 | 3 |
| S47 | 0.77 | 4.042 | 36.5 | 1.127 | 0 | 3 | 14 | 0 | 10.592 | 25.067 | 1.445 | 4.406 | 0.928 | 3 |
| S48 | 0.60 | 2.853 | 25.333 | 1.178 | 0 | 3 | 8 | 0 | 10.154 | 13.214 | 1.376 | 4.128 | 0.664 | 2 |
| S49 | 0.21 | 2.329 | 23.667 | 1.025 | 0 | 3 | 8 | 0 | 9.836 | 13.831 | 1.387 | 3.992 | 1.227 | 2 |
| S50* | −1.81 | 3.285 | 25.833 | 0.86 | 1 | 5 | 6 | 1.936 | 17.196 | 8.637 | 1.936 | 3.925 | 1.256 | 2 |
| S51* | −1.83 | 2.978 | 25.667 | 0.871 | 0 | 5 | 6 | 0 | 16.181 | 9.485 | 1.498 | 3.924 | 1.261 | 2 |
| S52 | −0.08 | 1.787 | 22.167 | 1.168 | 0 | 2 | 9 | 0 | 5.783 | 16.383 | 1.333 | 4.047 | 1.159 | 2 |
| S53 | −0.51 | 2.773 | 23.167 | 1.069 | 0 | 3 | 8 | 0 | 9.797 | 13.369 | 1.364 | 4.165 | 1.226 | 2 |
| S54 | 1.00 | 2.044 | 23.833 | 1.331 | 0 | 2 | 9 | 0 | 5.851 | 15.858 | 1.341 | 4.088 | 0.593 | 2 |
| S55* | −0.64 | 4.94 | 37.667 | 1.058 | 0 | 3 | 15 | 0 | 12.617 | 25.05 | 1.458 | 4.375 | 1.262 | 3 |
Compounds used in test sets.
Table 2.
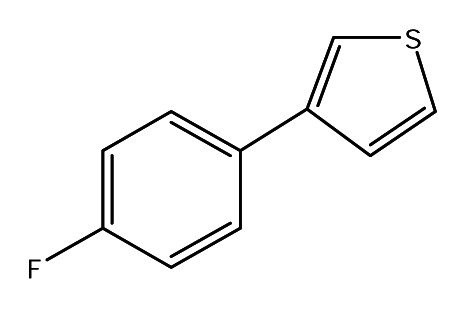
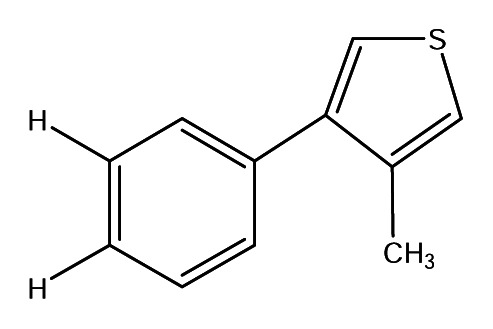
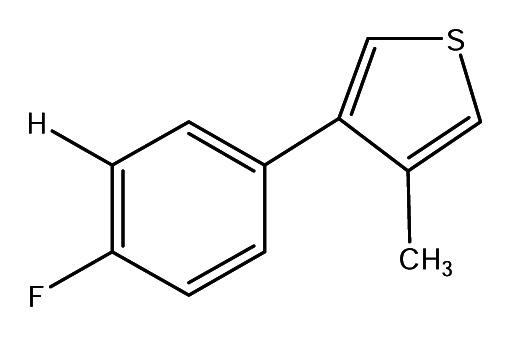
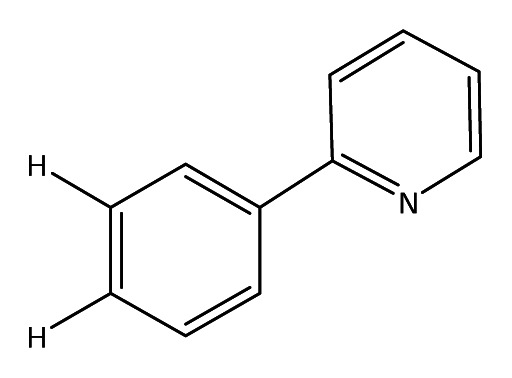
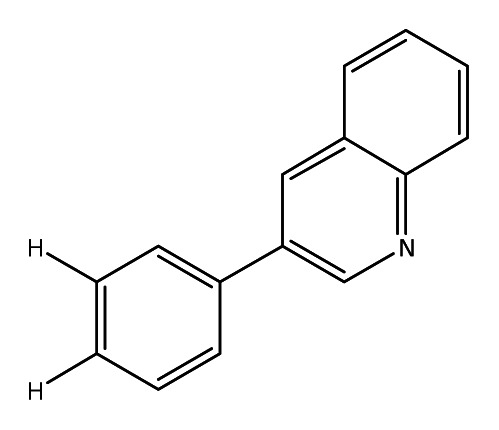
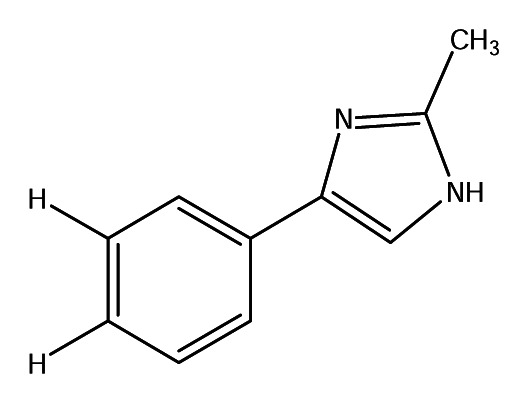
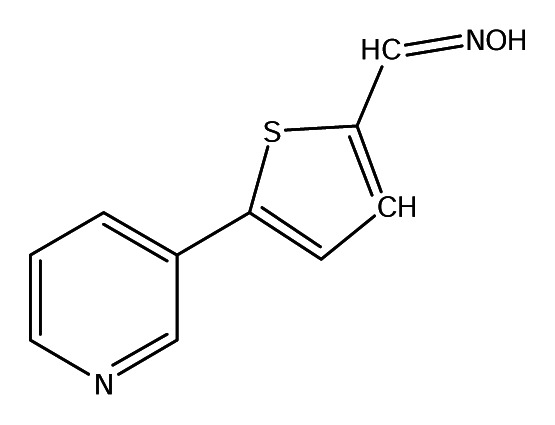
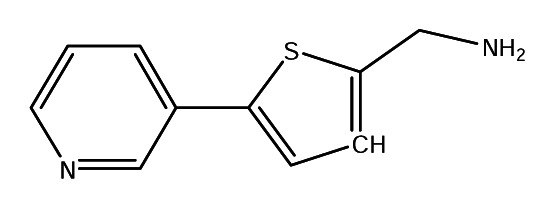
All compounds used in this work
| S1 |

|
S2 |

|
S3 |

|
| S4 |

|
S5 |

|
S6 |

|
| S7 |
|
S8 |

|
S9 |

|
| S10 |
|
S11 |
|
S12 |

|
| S13 |

|
S14 |
|
S15 |

|
| S16 |

|
S17 |

|
S18 |

|
| S19 |

|
S20 |

|
S21 |

|
| S22 |

|
S23 |
|
S24 |

|
| S25 |
|
S26 |
|
S27 |

|
| S28 |

|
S29 |

|
S30 |
|
| S31 |

|
S32 |

|
S33 |

|
| S34 |

|
S35 |

|
S36 |
|
| S37 |

|
S38 |

|
S39 |

|
| S40 |
|
S41 |

|
S42 |

|
| S43 |

|
S44 |
|
S45 |

|
| S46 |

|
S47 |

|
S48 |
|
| S49 |
|
S50 |

|
S51 |

|
| S52 |

|
S53 |

|
S54 |

|
| S55 |

|
P1 |

|
P2 |

|
The molecular descriptors in Table 3 were computed using MolconnZ program. The model has been trained by a training set (3/4 of the whole data) and validated by an independent test set (1/4) (Table 1).
Table 3.
The definition of the molecular descriptors used in this work
| Descriptor | Definition |
|---|---|
| sumdelI | Sum of delta-I values (Intrinsic State and E-State values). |
| sumI | Sum of intrinsic state values (I). |
| Qv | Qv is based on the E-State sumI values. It is the ratio of sumI’s for two extremes of the structure, i.e., molecule’s position along a line from Q calculated for the iso-structural alkane on one end and the most polar iso-skeletal version of the structure. |
| nHBd, nHBa nwHBa, nwHBd |
Hydrogen bond donor and acceptor counts (nwHBd and nwHBa are the weak hydrogen bonds). |
| SHBa | Acceptor descriptor for molecule (sum of E-state values for all hydrogen bond acceptors in the molecule). The following groups are classified as acceptors: -OH, =NH, -NH2, -NH-, >N-, -O-, =O, -Salong with -F and -Cl. |
| SHBd | Donor descriptor for molecule (sum of hydrogen E-State values for all hydrogen bond donors in the molecule). The following groups are classified as donors: -OH, =NH, -NH2, -NH-, -SH, and #CH. |
| SwHBa | Descriptor for weak hydrogen bond acceptor (sum of E-State values for all weak hydrogen bond acceptors). Aromatic and otherwise unsaturated carbons are considered to be weak acceptors. |
| Hmax, Gmax, Hmin | Extreme atom level E-State values in molecule:
|
| nrings | Number of rings. |
3. Results and discussion
3.1. Molecular descriptors
In the past decade, electrotopological state (E-state) indices have been used for correlating a variety of physicochemical and biological properties of chemical compounds. The E-state indices are computed for each atom in a molecule and encode information about both the topological environment of that atom and the electronic interactions due to all other atoms in the molecule (Kier and Hall, 1990). E-state indices have been found to be very useful in building QSAR models (Wang, etc., 2004; Wang, etc., 2005a; Wang, etc., 2005b). In this work, the E-state descriptors with detailed definitions are indicated in Table 3. For the present data, the sum of intrinsic state (sumI) and the sum of delta-I values (sum-delI), the extreme atom level E-State values (Hmax, Gmax and Hmin), as well as the number of hydrogen bond (H-bond) donor and acceptor are found to be useful in construction of a reliable K-PLS model. The intrinsic state encodes the valence state electronegativity of the atom as well as its local topology, which are particularly useful for describing the chemical features of a series of compounds. It has been found that the H-bonding and aromatic-aromatic interactions are very important for the binding of nicotine analogues with CYP2A6 enzyme (Yano, etc, 2006). Our present model, similarly, demonstrates that two descriptors of nHBa and nwHBa describing the hydrogen bonding interaction, as well as another descriptor of SwHBa describing aromatic carbons, are crucial for the functioning of nicotine inhibitors. All these descriptors possibly revealed that the nicotine derivatives play a main role of hydrogen-bond donor when interacting with the P450 enzyme. The importance of these descriptors also proved the previous results obtained by Yano, etc. (Yano, etc, 2006).
3.2. K-PLS parameters
K-PLS performs as well as or better than support vector regression for moderately-sized problems with the advantages of simple implementation, less training cost, and easier tuning of parameters. The most critical and demanding phase of any K-PLS model is the definition of kernels and the determination of parameters.
From the functions available, three types of kernels are popularly used in both SVM and K-PLS, i.e., linear, polynomial (a quadratic kernel function is normally applied) and radial basis function (Gaussian kernel), or to obtain complex kernels by combining simpler ones. The Gaussian kernel is possibly the simplest and effective kernel functions used in many cases. Therefore, in this work in the case of the kernel transformations we used a Gaussian RBF kernel function, which has the form:
| (2) |
Before generating the kernel, all the data have been firstly Mahalanobis scaled to have mean 0 and standard deviation 1. The value of w (width) for the Gaussian kernel should be tuned before the calculations proceed. In this work, the w values varying from 1 to 8 are assigned for the Gaussian function. The number of components was randomly assigned as 3, as this value did not influence the optimal choice of w values. Correlation coefficients (R) of predicted versus measured -logKis, as well as the mean squared errors (MSE) were determined for each method to reflect their bias and precision, respectively. Fig. 1 illustrates that the MSE and the R vary with the w value for the training and test data.
Figure 1.

Modeling results for the training and test sets with different w values of the Gaussian kernel.
As can be seen from Fig. 1, with the increase of the w value, the regression errors and coefficients of both data sets come approaching to each other with small fluctuations. Although their MSEs are not identical there is no real difference in their performance. These experiments illustrated that K-PLS was less sensitive to the tuning procedure. From this figure, we can find that the K-PLS model performs best for the present case when w =4.5, with the coefficients of 0.95 and 0.70, and errors of 0.07 and 0.63 for the training and test sets, respectively (Table 4).
Table 4.
The statistical results for K-PLS and PLS optimum models
| K-PLS | PLS | |||
|---|---|---|---|---|
|
|
||||
| R | MSE | R | MSE | |
| Training | 0.95 | 0.07 | 0.62 | 0.47 |
| Test | 0.70 | 0.63 | 0.09 | 1.29 |
A second aspect for application of K-PLS regression analysis is the optimal choice of the number of latent components (N). The optimal parameters could result in a better K-PLS performance. Fig. 2 illustrates what happens if a different choice of the number of the latent variables of K-PLS is made. When the number of the latent variables ranges from 1 to 6, reliable number is detected, i.e., N=3, which is reasonable for both training and test sets. From Fig. 2, one can find that the correlation coefficients for the training sets increase with the increase of the number of latent variables, which result in the decrease of regression errors. However, for test sets, R keeps almost constant, whereas resulting in a continuous increase of MSE.
Figure 2.

The coefficients and residues for the training and test sets when w =4.5 for the K-PLS model.
3.3. Interpretation of the K-PLS model
The structure of the optimum K-PLS achieving the highest R coefficient was determined. Meanwhile, a leave-one out cross-validated Q2 (0.41) was also obtained for the model. Fig. 3 shows the performance of this model. As can be seen from this figure, all compounds of training and test sets are equally distributed around the diagonal line y = x. The results indicate that the proposed K-PLS based model can be used in virtual screening or optimization of nicotine-like lead compounds for the inhibition of CYP2A6.
Figure 3.

The kernel partial least squares analysis of pKi for nicotine derivatives.
From this figure, we can find that the most potent compounds like S29, S30 and S37 in the training set, or like S10 and S44 in the test set are correctly modeled. However, we also find that the prediction errors of the model for compounds S50 and S51 are big. One major reason is that the two compounds are the ones with the weakest inhibitory effects on CYP2A6. Thus, the chemical space of the model might not be big enough to cover these two compounds, although in the training sets several compounds with the same biggest Ki values (S2 and S13) were deliberately included. However, even for a series of synthesized compounds, it is possible that they are sparsely distributed through the chemical space, thus making the model resulted from the study of these compounds inapplicable to other molecules (Sun, 2006). Being renovated by addition of new data in the future, the model may expand its coverage to a new applicability. Another possible reason is that those compounds with the same biggest Ki values are structurally different. It is just those molecules with different structures but same activities in one data set that might cause difficulties for the derived-model to correctly predict the activity using structure-based method. In addition, the two compounds possess negative charges at physiologic pH, which may also cause the prediction in-capablility of the model, since the descriptors applied in the present model do not work with negatively charged compounds.
Based on the obtained model, we have attempted the prediction of lots of new virtual compounds for their binding abilities. Two compounds (P1, P2) with their structures shown in Table 2 were obtained with relatively potent binding affinities with CYP2A6, and their predicted pKi values are −1.35 and −0.80 respectively. The prediction attempt might be useful for advancing our work for synthetic studies of this series of compounds.
3.4. Comparisons between K-PLS and PLS
A kernel version of PLS has some important advantages, such as the ability to find non-linear, global solutions and to work with high dimensional input vectors. Different from the PLS involving two orders of correlation for the latent components, K-PLS has three or more orders of correlation for the nonlinear components. As a relatively new method K-PLS has not gained the popularity as PLS in the field of chemometrics and other relevant fields. For a comparison of performance of both PLS and K-PLS, PLS approach was also applied to build QSAR models using the same training and test tests in the present work. The number of latent components was assigned 4 based on the optimum R and MSE obtained for both training and test sets (data not shown). Finally, the structure of the optimum PLS achieving the highest R coefficient was determined. Upon inspecting the results the first thing one notices is that the nonlinear K-PLS outperforms its linear conversion.
Fig. 4 depicts the optimum PLS modeling results and all of the statistical results were shown in Table 4. PLS has been widely used in the modeling of biochemical databases, but the technique is often unsuitable for predicting very complex phenomena such as the ADME/T properties of drugs. Basically, partial least squares regression is an extension of the multiple linear regression method. However, the present case is quite complex, where many compounds are structurally different, but with identical activities, such as the Ki values for S2, S13 and S51 are all 67, for S5 and S40 are both 1.4, for S10, S24 and S48 are all 0.25, and for S42 and S47 are both 0.17. This fact indicates that the relationship between the structure and activity of nicotine analogues may be nonlinear. And a linear technique is usually inapplicable for the study of data sets with nonlinear relationships. This might be the reason why the K-PLS model is successful but PLS fails to produce reasonable results on the data sets. For these data sets, and even for the training set, PLS model performs badly. Based on the results depicted in Figures 3 and 4, one might conclude that K-PLS is a preferable method to PLS on these datasets, where K-PLS exhibits obvious advantages over PLS.
Figure 4.

The partial least squares analysis of pKi for nicotine derivatives.
4. Conclusion
The main goal of this paper was to build a QSAR model for nicotine derivatives as selective CYP2A6 inhibitors. Another goal was also to compare the performances of kernel partial least squares and partial least squares analysis methods when being applied to QSAR modeling. Due to the nonlinearity of the data, K-PLS outperforms PLS in the present work. The above successful application of K-PLS method on nicotine derivatives will be helpful for quantitative design of nicotine analogues as selective CYP2A6 inhibitors.
This work also proposes a derivation of K-PLS based on optimization algorithms, which makes the K-PLS approach more easily applied for chemometrics field, and also more accessible to machine learning researchers. All these will promote the kernel partial least squares algorithm, a relatively novel method, to gain popularities in chemometrics applications and other fields.
Acknowledgements
This paper was supported by the Youth Teacher Fund of Dalian University of Technology.
References
- 1.Bennett K.P., Embrechts M. J. In: Advances in Learning Theory: Methods, Models and Applications, NATO Science Series III: Computer & Systems Sciences. Suykens J. A. K., Horvath G., Basu S., Micchelli C., Vandewalle J., editors. Vol. 190. IOS Press; Amsterdam: 2003. p. 227. [Google Scholar]
- 2.Cashman J.R., Park S.B., Yang Z.-C., Wrighton S.A., Jacob P., III, Benowitz N.L. Metabolism of nicotine by human liver microsomes: Stereoselective formation of trans-nicotine N′-oxide. Chem. Res. Toxicol. 1992;5:639–646. doi: 10.1021/tx00029a008. [DOI] [PubMed] [Google Scholar]
- 3.de Jong S. SIMPLS: an alternative approach to partial least squares regression. Chemometr. Intell. Lab. 1993;18:251–263. [Google Scholar]
- 4.Denton T. T., Zhang X., Cashman J. R. 5-Substituted, 6-substituted, and unsubstituted 3- heteroaromatic pyridine analogues of nicotine as selective inhibitors of cytochrome P-450 2A6. J. Med. Chem. 2005;48:224–239. doi: 10.1021/jm049696n. [DOI] [PubMed] [Google Scholar]
- 5.Draper A. J., Madan A., Parkinson A. Inhibition of coumarin 7-hydroxylase activity in human liver microsomes. Arch. Biochem. Biophys. 1997;341:47–61. doi: 10.1006/abbi.1997.9964. [DOI] [PubMed] [Google Scholar]
- 6.Fujita K., Kamataki T. Screening of organosulfur compounds as inhibitors of human CYP2A6. Drug Metab. Dispos. 2001;29:983–989. [PubMed] [Google Scholar]
- 7.Guengerich F. P., Shimada T., Yun C., Yamazaki H., Raney K. D., Thier R., Coles B., Harris T. M. Interactions of ingested food, beverage, and tobacco components involving human cytochrome P4501A2, 2A6, 2E1, and 3A4 enzymes. Environ. Health Perspect. 1994;102:49–53. doi: 10.1289/ehp.94102s949. [DOI] [PMC free article] [PubMed] [Google Scholar]
- 8.Hukkanen J., Jacob P., III, Benowitz N.L. Metabolism and Disposition Kinetics of Nicotine. Pharmacol. Rev. 2005;57:79–115. doi: 10.1124/pr.57.1.3. [DOI] [PubMed] [Google Scholar]
- 9.John S. T., Nello C. Kernel methods for pattern analysis. Cambridge Univ Pr; 2004. pp. 137–189. [Google Scholar]
- 10.Kier L. B., Hall L. H. An electrotopological-state index for atoms in molecules. Pharm. Res. 1990;7:801–807. doi: 10.1023/a:1015952613760. [DOI] [PubMed] [Google Scholar]
- 11.Nakajima M., Yamamoto T., Nunoya K., Yokoi T., Nagashimi K., Inque K., Funae Y., Shimada N., Kamataki T., Kuroiwa Y. Role of human cytochrome P4502A6 in C-oxidation of nicotine. Drug Metab. Dispos. 1996;24:1212–1217. [PubMed] [Google Scholar]
- 12.Maenpaa J., Sigusch H., Raunio H., Syngelma T., Vuorela P., Vuorela H., Pelkonen O. Differential inhibition of coumarin 7-hydroxylase activity in mouse and human liver microsomes. Biochem. Pharmacol. 1993;45:1035–1042. doi: 10.1016/0006-2952(93)90247-t. [DOI] [PubMed] [Google Scholar]
- 13.Nakajima M., Yamamoto T., Nunoya K., Yokoi T., Nagashimi K., Inque K., Funae Y., Shimada N., Kamataki T., Kuroiwa Y. Characterization of CYP2A6 involved in 39- hydroxylation of cotinine in human liver microsomes. J. Pharmacol. Exp. Ther. 1996;277:1010– 1015. [PubMed] [Google Scholar]
- 14.Pearce R., Greenway D., Parkinson A. Species differences and interindividual variation in liver microsomal cytochrome P450 2A enzymes: effects on coumarin, dicoumarol, and testosterone oxidation. Arch. Biochem. Biophys. 1992;298:211–225. doi: 10.1016/0003-9861(92)90115-d. [DOI] [PubMed] [Google Scholar]
- 15.Reigh G., McMahon H., Ishizaki M., Ohara T., Shimane K., Esumi Y., Green C., Tyson C., Ninomiya S. Cytochrome P450 species involved in the metabolism of quinoline. Carcinogenesis. 1996;17:1989–1996. doi: 10.1093/carcin/17.9.1989. [DOI] [PubMed] [Google Scholar]
- 16.Shimada T., Yamazaki H., Guengerich F. P. Ethnic-related differences in coumarin 7- hydroxylation activities catalyzed by cytochrome P4502A6 in liver microsomes of Japanese and Caucasian populations. Xenobiotica. 1996;26:395–403. doi: 10.3109/00498259609046718. [DOI] [PubMed] [Google Scholar]
- 17.Sun H. M. Predicting ADMET properties by projecting onto chemical space-benefits and pitfalls. Curr. Comput. Aided Drug D. 2006;2:179–193. [Google Scholar]
- 18.Tricker A. R. Nicotine metabolism, human drug metabolism polymorphisms, and smoking behaviour. Toxicology. 2003;183:151–173. doi: 10.1016/s0300-483x(02)00513-9. [DOI] [PubMed] [Google Scholar]
- 19.Yano J. K., Denton T. T., Cerny M. A., Zhang X., Johnson E. F., Cashman J. R. Synthetic Inhibitors of Cytochrome P-450 2A6: Inhibitory Activity, Difference Spectra, Mechanism of Inhibition, and Protein Cocrystallization. J. Med. Chem. 2006;49:6987–7002. doi: 10.1021/jm060519r. [DOI] [PubMed] [Google Scholar]
- 20.Wang Y. H., Han K. L., Yang S. L., Yang L. Structural determinants of steroids for cytochrome P4503A4-mediated metabolism. J. Mol. Struct. (THEOCHEM) 2004;710:215–221. [Google Scholar]
- 21.Wang Y. H., Li Y., Li Y.H., Yang S. L., Yang L. Modeling Km values using electrotopological state: substrates for cytochrome P450 3A4-mediated metabolism. Bioorg. Med. Chem. Lett. 2005a;15:4076–4084. doi: 10.1016/j.bmcl.2005.06.015. [DOI] [PubMed] [Google Scholar]
- 22.Wang Y. H., Li Y., Yang S.L., Yang L. Classification of substrates and inhibitors of Pglycoprotein using unsupervised machine learning approach. J. Chem. Inf. Model. 2005b;45:750–757. doi: 10.1021/ci050041k. [DOI] [PubMed] [Google Scholar]
- 23.Wold H. In: Perspectives in Probability and Statistics. Gani J., editor. Academic Press; London: 1975. p. 520. [Google Scholar]
- 24.Wold S., Ruhe H., Wold H., Dunn W. J. The collinearity problem in linear regression. The PLS approach to generalized inverse. SIAM J. Sci. Statist. Comput. 1984;5:735–743. [Google Scholar]