

Abstract
A previous modelling study predicted that the forces applied by the extensor muscles to stabilise the lumbar spine would be greater in spines that have a larger sagittal curvature (lordosis). Because the force-generating capacity of a muscle is related to its size, it was hypothesised that the size of the extensor muscles in a subject would be related to the size of their lumbar lordosis. Magnetic resonance imaging (MRI) data were obtained, together with age, height, body mass and back pain status, from 42 female subjects. The volume of the extensor muscles (multifidus and erector spinae) caudal to the mid-lumbar level was estimated from cross-sectional area measurements in axial T1-weighted MRIs spanning the lumbar spine. Lower lumbar curvature was determined from sagittal T1-weighted images. A stepwise linear regression model was used to determine the best predictors of muscle volume. The mean lower lumbar extensor muscle volume was 281 cm3 (SD = 49 cm3). The mean lower lumbar curvature was 30 ° (SD = 7 °). Five subjects reported current back pain and were excluded from the regression analysis. Nearly half the variation in muscle volume was accounted for by the variables age (standardised coefficient, B = −3.2, P = 0.03) and lower lumbar curvature (B = 0.47, P = 0.002). The results support the hypothesis that extensor muscle volume in the lower lumbar spine is related to the magnitude of the sagittal curvature; this has implications for assessing muscle size as an indicator of muscle strength.
Keywords: extensor muscle size, lumbar lordosis, magnetic resonance imaging
Introduction
The extensor muscles of the lumbar spine, located posteriorly to the vertebral bodies, play an important role in controlling movement and providing mechanical stability. They comprise two main muscle groups: the transversospinalis (multifidus, rotatores, interspinales and intertransversarii) and the erector spinae (iliocostalis and longissimus). The transversospinalis are located deeply, attaching to the lumbar vertebrae, and are considered responsible for small movements stabilising the spine (Macintosh & Bogduk, 1986; Hansen et al. 2006; Ward et al. 2009; Cornwall et al. 2011). The erector spinae, situated more superficially, spanning larger sections of the spine, are considered to have a greater role in producing spinal movement (Macintosh & Bogduk, 1991; Hansen et al. 2006).
The mechanical stability of the lumbar spine is achieved when the resultant forces in the spine travel tangentially to the sagittal spinal curvature (Aspden, 1989); these allow the lumbar spine to support the weight of the upper body without buckling and have been termed ‘follower loads’ (Patwardhan et al. 1999). Several modelling studies have investigated the mechanisms by which follower loads can be achieved, and have demonstrated that the extensor muscles could play a role in providing the forces needed to generate a follower load, maintaining the stability of the spine with little deformation, shear or bending (Kim et al. 2007; Kim & Kim, 2008; Han et al. 2011).
A recent modelling study has investigated how the forces required to produce a follower load would be affected by differences in the magnitude of the curvature (Meakin & Aspden, 2012). The range of lumbar sagittal curvature, lordosis, in the normal population is considerable (Berthonnaud et al. 2005; Boulay et al. 2006; Meakin et al. 2008) and, although the curvature is modified by changes in posture (Meakin et al. 2009), it has been suggested that a proportion of the inter-subject variability is due to intrinsic factors such as the bony anatomy (Meakin et al. 2009). The model considered the spine as a two-dimensional structure with forces applied at each vertebral level in a simplified representation of the extensor muscles and did not investigate individual muscle groups. It predicted, however, that a lumbar spine with a large lordosis would require larger forces to produce a follower load in the standing posture than a spine with a small lordosis (Meakin & Aspden, 2012). This was particularly so in the lower regions of the spine where the majority of the lumbar lordosis is usually located, and the predictions have implications for understanding how the muscles provide biomechanical stability to the lumbar spine in a range of individuals.
The maximum force that a muscle can apply is limited by its size; this is because the force-generating capacity of a muscle is, in theory, directly proportional to the number and size of the muscle fibres within it (Brinckmann et al. 2000). In practice, this relationship is modified (positively or negatively) by various factors, including the type of muscle fibres present, their length and their arrangement in the tissue (Brinckmann et al. 2000; Jones et al. 2008), together with the neural control of the muscle and the presence of non-contractile tissue such as fat (Jones et al. 2008). It is generally accepted, however, that muscle strength is proportional to muscle size (Brinckmann et al. 2000; Folland & Williams, 2007; Jones et al. 2008), and many studies have found the size of a muscle (measured as an area or a volume) to be highly correlated with its ability to apply force (Akagi et al. 2009; Blazevich et al. 2009).
Measurements of lumbar extensor muscle size show that, similarly to spine shape, there is considerable variability in size in the normal population, especially in the lower lumbar regions (Danneels et al. 2000; Kamaz et al. 2007; Hides et al. 2008; Wallwork et al. 2009). This variation in muscle size indicates a concomitant variation in muscle strength such that an individual with small extensor muscles will not be able to generate the same magnitude of spine stabilisation force as an individual with large extensor muscles. The relationship between muscle size and lumbar lordosis has not previously been investigated but, based on the predictions of the recent modelling study (Meakin & Aspden, 2012), we hypothesised that subjects with larger lumbar lordosis, particularly in the lower half, would have more muscle (thus enabling them to stabilise their spine appropriately). The aim of the study reported here was to test this hypothesis in a sample of volunteer subjects.
Materials and methods
Data
Magnetic resonance imaging (MRI) data from 42 female subjects were acquired together with the age, height, body mass and back pain status of the subjects. The images, which were collected for a previous study (Knapp et al. 2012), were acquired using a Philips Gyroscan Intera 1.5 T MRI scanner (Philips Medical Systems, The Netherlands). Back pain status was ascertained from the answer to the question ‘Do you, or have you in the past suffered from back pain?’ that was administered via a written questionnaire. Approval for the study was given by Devon and Torbay Research Ethics Committee (08/H0202/109), and all subjects gave their written informed consent.
Muscle size
Images acquired in the axial plane were used to determine extensor muscle size in the lower part of the lumbar spine. These images were obtained using a gradient echo sequence with a repetition time (TR) of approximately 55 ms and an echo time (TE) of 1.9 ms. Forty 8-mm-thick slices, with a 1-mm gap were acquired; the in-plane resolution was between 1.76 and 1.95 mm pixel−1, depending on subject size.
The MRIs were saved in TIFF format and regions of interest corresponding to the extensor muscles were segmented, by one observer, using gimp software (GNU Image Manipulation Programme, version 2.6.10, http://www.gimp.com). The regions of interest (Fig. 1) included the iliocostalis, longissimus and multifidus muscles, and may have included the rotatores, interspinales and intertransversarii muscles. Macroscopic infiltrations of fat were excluded. No attempt was made to segment the muscles separately as the demarcation between them was not clear on all the images. The number of segmented pixels was multiplied by the in-plane resolution to give the cross-sectional area.
Fig 1.
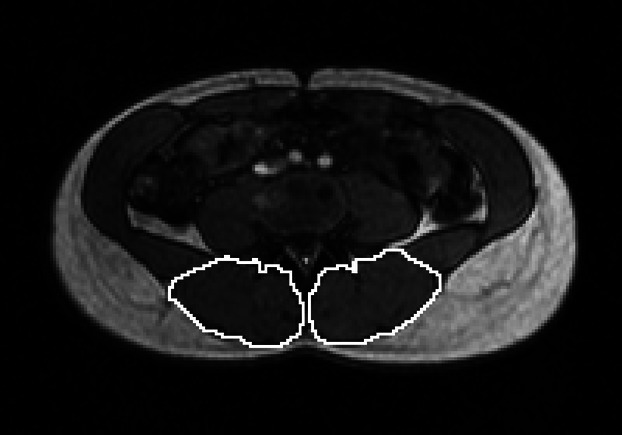
Segmentation of the lumbar extensor muscles at the level of L3/L4.
The extensor muscle volume caudal to the level of L3/L4 was estimated by multiplying the cross-sectional areas by the effective slice thickness (acquired slice thickness plus slice gap = 9 mm) and summing across the relevant number of slices. The first of these slices was defined as that in which the presence of the L3/L4 disc was observed; the last was defined as the most caudal slice in which extensor muscle was observed. The L3/L4 disc was chosen to define the upper boundary of the muscle volume because it provided an identifiable anatomical plane that was approximately parallel to the axial slices in all the subjects (thus minimising inter-subject artefacts in the volume measurement). The variation in the height of the subjects meant that the number of slices varied from 10 to 15 (mean = 13).
The segmentation of the slice at the level of L3/L4 was performed twice by one observer so that intra-observer reliability and measurement error could be assessed. The segmentation of this slice was also performed by a second observer so that inter-observer reliability could be assessed.
Spine shape
Images acquired in the sagittal plane were used to determine the curvature of the lower lumbar spine. These images were acquired using a T1-weighted turbo-spin echo sequence with a TR of approximately 198 ms and a TE of 7 ms. Slices were 4 mm thick with an in-plane pixel size between 0.59 and 0.68 mm, depending on body size. The slice that was as close as possible to the mid-line of the lumbar spine was identified (by observing the presence of the conus medullaris and/or the spinous processes) and saved in BMP format (Fig. 2). For eight subjects, these sagittal images did not show the full length of the lumbar spine and so survey images, used for positioning the axial slices, were used instead. The survey images included 10 slices, acquired in the sagittal plane, with a slice thickness of 10 mm and an in-plane pixel size of 1.76 mm. The survey slice closest to the mid-line of the lumbar spine was identified as described above.
Fig 2.
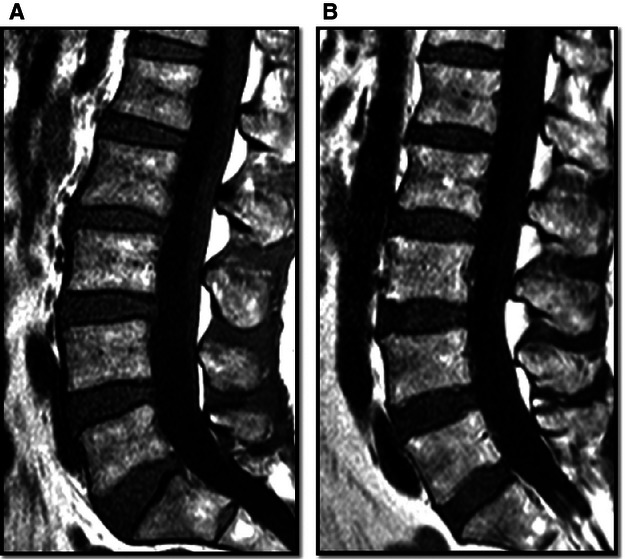
Sagittal images showing the curvature of the lumbar spine for two subjects. Subject A aged 47 years: θL4S1 = 47º, muscle volume = 352 cm3. Subject B aged 58 years: θL4S1 = 36º, muscle volume = 236 cm3.
The curvature was characterised as the angle between the superior endplates of L4 and S1 (θL4S1). This angle was determined using a procedure described in a previous paper (Ali et al. 2012), where output from an active shape model is used to determine the end-plate angles. The active shape model was generated using freely available software tools from the University of Manchester, UK in the same way as described previously (Meakin et al. 2008). This involved one observer placing 168 landmark points around the periphery of the vertebral bodies from L1 to S1 in each image. The software then transformed the data, to remove scale and rigid body movement, and performed principle component analysis to give ‘modes of variation’ describing patterns of variation in the spine shape. The output from this model was subsequently processed using in-house matlab code (version R2010a, The MathWorks, Natick, MA, USA) to determine the superior end-plate angles. Based on our previous work (Meakin et al. 2008; Ali et al. 2012), and the resolution of the MRI data, we estimate that the angle θL4S1 could be determined to within 1 or 2º.
Data analysis and statistics
Statistical analysis of the data was performed using spss software (version 18, IBM, New York, USA). The Kolmogorov–Smirnov test was used to establish whether data followed a normal distribution. The inter- and intra-observer reliability of the cross-sectional area measurements was assessed by determining the single measures intra-class correlation coefficient (using a one-way random model). Measurement error was determined as 2.77 times the within-subject standard deviation calculated using a one-way analysis of variance of the repeat measurements made by the first observer. The volume measurement error was estimated by multiplying the cross-sectional area measurement error by the square root of 13 (mean number of slices measured). Analysis of variance was used to assess differences between groups; post hoc testing of differences was performed with the Sidak correction for multiple comparisons. The strength of the relationship between variables was assessed from the Pearson correlation coefficient. Stepwise linear regression was used to determine the best model for muscle volume using input variables age, height, body mass and θL4S1.
Results
The 42 subjects had a mean age of 50 years (SD = 13 years), a mean height of 165 cm (SD = 7 cm) and a median mass of 70 kg (inter-quartile range = 18 kg). Their mean lower lumbar curvature, θL4S1, was 30° (SD = 7°) and their mean extensor muscle volume caudal to L3/L4 was 281 cm3 (SD = 49 cm3). The reliability of the cross-sectional area measurements was excellent, with an intra-observer intra-class correlation (ICC) of 0.97 [95% confidence interval (CI) 0.94–0.98] and an inter-observer ICC of 0.77 (95% CI 0.61–0.87). The measurement error was 3 cm2 for cross-sectional area and 10 cm3 for volume.
Eleven subjects reported no back pain, 26 subjects reported back pain in the past, and five subjects reported current back pain. Table 1 shows the subject characteristics broken down by back pain status. There was a statistically significant difference in the muscle volume between the three groups but not for the other parameters (Table 1); post hoc testing showed that the muscle volume of the group with current back pain was significantly smaller (95% CI 11–135 cm3) than the group that reported no back pain.
Table 1.
Age, height, mass, lower lumbar curvature (θL4S1) and muscle volume for all 42 subjects
| Back pain status | |||||
|---|---|---|---|---|---|
| All subjects (n = 42) | None (n = 11) | Previous (n = 26) | Current (n = 5) | anova | |
| Age (years) | 50 (13) | 44 (11) | 51 (13) | 53 (12) | F = 1.5 P = 0.25 |
| 20–75 | 23–59 | 20–75 | 36–69 | ||
| Height (cm) | 165 (7) | 167 (6) | 164 (7) | 163 (4) | F = 0.8P = 0.48 |
| 151–178 | 158–177 | 151–178 | 157–167 | ||
| Mass (kg) | 68 (18) | 73 (18) | 70 (13) | 76 (30) | F = 0.1P = 0.92 |
| 52–128 | 57–106 | 52–107 | 55–128 | ||
| θL4S1 (º) | 39 (4) | 40 (3) | 38 (4) | 39 (4) | F = 1.1P = 0.34 |
| 28–47 | 35–44 | 28–47 | 33–43 | ||
| Volume (cm3) | 281 (49) | 303 (34) | 281 (48) | 230 (57) | F = 4.4 |
| 169–358 | 237–348 | 195–358 | 169–299 | P = 0.02* | |
Normally distributed values reported as a mean (standard deviation) and range; non-normally distributed values as a median (inter-quartile range) and range.
Statistical significance is noted as *P < 0.05.
Excluding the subjects with current back pain, the muscle volume was found to be negatively correlated with age and positively correlated with height, body mass and lower lumbar curvature (Table 2). The relationships were statistically significant, with the exception of that between volume and body mass. Of the variables included in the stepwise linear regression (age, height, body mass and lower lumbar curvature), only age and lower lumbar curvature were found to be significant predictors of muscle volume (Table 3). These two parameters accounted for 46% of the variation in muscle volume. The relationship between the variables is visually demonstrated in Fig. 2, which shows the sagittal lumbar curvature for two subjects with differing lumbar muscle volumes.
Table 2.
Correlation between age, height, mass, lower lumbar curvature (θL4S1) and muscle volume
| Age | Height | T_mass | θL4S1 | Volume | |
|---|---|---|---|---|---|
| Age | 1.00 | −0.31 | 0.14 | −0.44** | −0.53** |
| 0.06 | 0.40 | < 0.01 | < 0.01 | ||
| Height | 1.00 | 0.24 | 0.17 | 0.38* | |
| 0.15 | 0.32 | 0.02 | |||
| T_mass | 1.00 | 0.25 | 0.15 | ||
| 0.14 | 0.38 | ||||
| θL4S1 | 1.00 | 0.61** | |||
| < 0.01 | |||||
| Volume | 1.00 |
The Pearson correlation coefficients (R) are given together with the statistical significance. Only the data for the 37 subjects who did not have current back pain were included in this analysis.
Statistical significance is noted as *P < 0.05 and **P < 0.01.
Table 3.
Predictors of muscle volume determined from stepwise linear regression model
| Unstandardised coefficients | Standardised coefficients | P | |
|---|---|---|---|
| Constant | 128.617 | 0.107 | |
| θL4S1 | 5.522 | 0.47 | 0.002 |
| Age | −1.103 | −0.32 | 0.030 |
Only the data for the 37 subjects who did not have current back pain were included in this analysis.
Discussion
The aim of this study was to test the hypothesis that there would be a relationship between the size of the extensor muscles and the magnitude of the sagittal curvature of the lumbar spine. The hypothesis that a relationship would exist resulted from a model that investigated the effect of lumbar spine shape on the forces required to produce a stabilising follower load in standing (Meakin & Aspden, 2012). The model predicted that larger muscle forces would be required to provide stability in lumbar spines that had larger curvatures and, because the force-generating capacity of a muscle is related to its physical size, this then suggested that variation in extensor muscle size (Danneels et al. 2000; Kamaz et al. 2007; Hides et al. 2008; Wallwork et al. 2009) might be related to variation in lumbar curvature (Berthonnaud et al. 2005; Boulay et al. 2006; Meakin et al. 2008). The results of the current study support the hypothesis in that larger extensor muscles caudal to L3/L4 were associated with subjects who had a greater degree of lumbar curvature between L4 and S1. Although, in the current study, the subjects were supine, the results are relevant to the predictions of the model as the shape of the lumbar spine in standing is highly correlated to that in the supine posture (Meakin et al. 2009), and changes in curvature at the lower lumbar levels have been shown to be only a few degrees (Wood et al. 1996; Andreasen et al. 2007).
The correlations between lower lumbar muscle volume and the age, height and body mass of the subjects (Table 2) are consistent with other studies reported in the literature. Ageing is known to be associated with a reduction in the quantity of muscle throughout the body (Janssen et al. 2000; Lang et al. 2010) due to various cellular and molecular changes (Ryall et al. 2008). Skeletal muscle mass is known to be greater in subjects who are taller and heavier (Janssen et al. 2000), and previous studies focusing on lumbar muscles have found a positive correlation with physical size (Chaffin et al. 1990; Jorgensen et al. 2003). In the current study, however, height and body mass were not found to be significant predictors of lower lumbar muscle volume. This may be because, in our sample, there was a correlation between age and height (Table 2), which had a P-value of 0.06; although not statistically significant at the 5% level, this suggests some covariance between the two variables.
The smaller muscle volume in the subjects that reported current back pain (Table 1) is also consistent with the literature. A number of studies have shown that patients with chronic low back pain have small lumbar muscles (usually defined by their cross-sectional area) in comparison to normal volunteers (Danneels et al. 2000; Kamaz et al. 2007; Hides et al. 2008; Wallwork et al. 2009) and patients with non-chronic low back pain (Stokes et al. 1992). This difference in size is particularly prevalent in the multifidus muscles at the lower lumbar levels (Danneels et al. 2000; Hides et al. 2008; Wallwork et al. 2009), although it has also been found in the erector spinae muscles (Stokes et al. 1992; Kamaz et al. 2007). The subjects who reported current back pain in the current study were excluded from the analysis of the relationship between muscle size and lumbar curvature as they formed a very small (n = 5) subgroup, and no information was available as to whether their back pain was acute or chronic. Future investigation into the relationship between muscle volume and lumbar curvature in subjects with and without chronic back pain could be useful, however, in furthering our understanding of the relevance of these observations.
It is impossible to establish the nature of the causal relationship between spine curvature and muscle size from the current study; however, there are plausible mechanisms that can be inferred from the literature. The first, which was the hypothesis of the current study, is that the curvature of an individual's spine is an intrinsic property and that inter-subject variation in this intrinsic shape then requires a variety of stabilising forces, which manifest as a variety of muscle sizes. Previous studies have suggested that an individual's spine shape is an intrinsic property (Stagnara et al. 1982; Meakin et al. 2009) and the causes for this include the morphology of the vertebrae (Meakin et al. 2009), which is known to vary in terms of size and shape of the vertebral bodies and the size and angulation of the posterior elements (Berry et al. 1987). The relationship between vertebral morphology and spinal curvature has not been previously explored and so we intend to investigate this in a future study. This is an important further step as vertebral morphology may also affect the line of action of the extensor muscles, modifying the forces they apply to the spine (Nussbaum et al. 1995).
An alternative mechanism to explain the relationship between spine curvature and muscle size is that the size of an individual's muscles is dictated by various factors, including their body size, gender and lifestyle. This variation in muscle size gives rise to a variation in the ability of the muscles to provide stabilisation to the spine, and this causes the spine to conform to a shape that can be successfully stabilised by the available muscle forces. The effect of age on the relationship can then be explained by the age-related loss of muscle mass, described above, having the effect of reducing the strength of the spinal muscles and leading to a reduction in lumbar curvature. A reduction in lumbar lordosis with age has been observed in cross-sectional (Hammerberg & Wood, 2003) and longitudinal studies (Takeda et al. 2009); however, the mechanism of this phenomenon may also be explained by other age-related changes in the spine, such as an increase in spinous process height (Aylott et al. 2012) or a decrease in disc height and anterior wedging (Takeda et al. 2009).
In the study reported here, extensor muscle size was defined as the volume caudal to the level of L3/L4 as estimated from measurements of cross-sectional area. Most previous studies concerned with lumbar muscle size have considered the cross-sectional area: either in the form of the anatomical cross-sectional area (perpendicular to the long axis of the muscle) or the physiological cross-sectional area (perpendicular to the muscle fibres). In our study, cross-sectional area was measured from images acquired in the axial plane and, due to the varying orientations of the extensor muscles being considered, was not a true anatomical or true physiological cross-sectional area. One problem in defining muscle size by the cross-sectional area, whether it be anatomical or physiological, is that it is influenced by a number of extrinsic factors. Active contraction of a muscle will increase the cross-sectional area from the relaxed state and passive elongation (due to movement of the muscle attachment sites with joint movement) will decrease the area. This second issue is particularly relevant to the spine, as it has a large degree of flexibility, and it has been shown that trunk flexion leads to a reduction in the measured cross-sectional area of the extensor muscles (Jorgensen et al. 2003). Many studies that have measured muscle cross-sectional area have therefore tried to ensure that their subjects were placed in the same posture (Stokes et al. 1992) or have attempted to position their subjects so as to minimise the lordosis (Wallwork et al. 2009). In the current study, every subject was imaged in the supine position with her legs extended; this still resulted in a range of lower lumbar curvatures from 28 ° to 47 °. Attempting to equalise this curvature would have required subjects to adopt different postures and may have been an unrealistic goal in some subjects. By measuring volume, we believe that the problem of passive elongation will be minimised as it is generally considered that muscle tissue is incompressible (Ehret et al. 2011) because of its high water content. This means that although passive elongation would be expected to increase length and reduce area, it would not be expected to alter volume. Although this hypothesis has not been tested in the spine, it is supported by measurements of gastrocnemii volume and length at a range of ankle flexion angles (Barber et al. 2009). In addition to the issue of passive elongation, a further advantage of measuring volume is that it may provide a better indicator of lumbar muscle strength than cross-sectional area (Akagi et al. 2009; Blazevich et al. 2009), thus having more relevance for indicating the ability of the extensor muscles to apply force.
One of the limitations of the study was that the resolution of the axial MRI images, although sufficient to segment the muscles as a whole, would ideally have been higher to allow individual muscle groups to be identified. This would have allowed us to establish whether the relationship found between muscle volume and curvature was the same in both the multifidus and erector spinae. A second limitation is that our subjects were exclusively female and we cannot be certain that our results would be the same in male subjects as the size of the lumbar muscles is generally larger in male subjects than female (Marras et al. 2001; Jorgensen et al. 2003; Stokes et al. 2005), and previous studies have found the anthropometric predictors of lumbar muscle size to differ between the sexes (Marras et al. 2001).
Despite these limitations, the results of the study show the quantity of extensor muscle present in a subject is related to the magnitude of their lumbar lordosis. This supports the predictions of a recent model that suggested that the muscle forces required for biomechanical stability via a follower load depend on the spinal curvature (Meakin & Aspden, 2012). These results may have implications for assessing the size of muscles in patients with back pain. Several studies have found the extensor muscles of patients with back pain to be smaller than in normal volunteers (Danneels et al. 2000; Kamaz et al. 2007; Hides et al. 2008; Wallwork et al. 2009) but with some overlap between the two groups. Taking the lumbar curvature into account (together with the other factors that affect muscle size, such as age) may allow the relevance of muscle size to be evaluated, providing a better assessment of whether their muscles are adequate for their needs or would benefit from intensive therapy.
Concluding remarks
The conclusions from this study are that the volume of the lumbar extensor muscles in the lower half of the lumbar spine (caudal to the level of the L3/L4 disc) has a positive correlation with the magnitude of the sagittal lumbar curvature over the same region.
Acknowledgments
The authors thank the following students, who were on the Medical Imaging (Diagnostic Radiography) programme at the University of Exeter, for helping to collect the data that was used in this study: Susan Hopkins, Sophie Holl, Andrew Bartlett and Soukina May.
Conflict of interest
There are no conflicts of interest to declare.
Author contributions
Judith Meakin developed the hypothesis underlying the study, performed the measurements of muscle size and spine curvature, analysed the data, and wrote the initial drafts of the manuscript. Jonathan Fulford acquired the MRI data, was involved with interpretation of the results, and edited and approved the manuscript. Richard Seymour was involved in the data collection and the interpretation of the results, and edited and approved the manuscript. Joanne Welsman was involved in the data collection and the interpretation of the results, and edited and approved the manuscript. Karen Knapp was involved in the data collection, performed the measurements of muscle size for the calculating of inter-observer error, was involved in the interpretation of the results, and edited and approved the current manuscript.
References
- Akagi R, Takai Y, Ohta M, et al. Muscle volume compared to cross-sectional area is more appropriate for evaluating muscle strength in young and elderly individuals. Age Ageing. 2009;38:564–569. doi: 10.1093/ageing/afp122. [DOI] [PubMed] [Google Scholar]
- Ali A, Cowan A-b, Gregory J, et al. The accuracy of active shape modelling and end-plate measurements for characterising the shape of the lumbar spine in the sagittal plane. Comput Methods Biomech Biomed Eng. 2012;15:167–172. doi: 10.1080/10255842.2010.518962. [DOI] [PubMed] [Google Scholar]
- Andreasen ML, Langhoff L, Jensen TS, et al. Reproduction of the lumbar lordosis: a comparison of standing radiographs versus supine magnetic resonance imaging obtained with straightened lower extremities. J Manipulative Physiol Ther. 2007;30:26–30. doi: 10.1016/j.jmpt.2006.11.009. [DOI] [PubMed] [Google Scholar]
- Aspden RM. The spine as an arch. A new mathematical model. Spine. 1989;14:266–274. doi: 10.1097/00007632-198903000-00005. [DOI] [PubMed] [Google Scholar]
- Aylott CE, Puna R, Robertson PA, et al. Spinous process morphology: the effect of ageing through adulthood on spinous process size and relationship to sagittal alignment. Eur Spine J. 2012;21:1007–1012. doi: 10.1007/s00586-011-2029-6. [DOI] [PMC free article] [PubMed] [Google Scholar]
- Barber L, Barrett R, Lichtwark G. Validation of a freehand 3D ultrasound system for morphological measures of the medial gastrocnemius muscle. J Biomech. 2009;42:1313–1319. doi: 10.1016/j.jbiomech.2009.03.005. [DOI] [PubMed] [Google Scholar]
- Berry JL, Moran JM, Berg WS, et al. A morphometric study of human lumbar and selected thoracic vertebrae. Spine. 1987;12:362–367. doi: 10.1097/00007632-198705000-00010. [DOI] [PubMed] [Google Scholar]
- Berthonnaud E, Dimnet J, Roussouly P, et al. Analysis of the sagittal balance of the spine and pelvis using shape and orientation parameters. J Spinal Disord Tech. 2005;18:40–47. doi: 10.1097/01.bsd.0000117542.88865.77. [DOI] [PubMed] [Google Scholar]
- Blazevich A, Coleman D, Horne S, et al. Anatomical predictors of maximum isometric and concentric knee extensor moment. Eur J Appl Physiol. 2009;105:869–878. doi: 10.1007/s00421-008-0972-7. [DOI] [PubMed] [Google Scholar]
- Boulay C, Tardieu C, Hecquet J, et al. Sagittal alignment of spine and pelvis regulated by pelvic incidence: standard values and prediction of lordosis. Eur Spine J. 2006;15:415–422. doi: 10.1007/s00586-005-0984-5. [DOI] [PMC free article] [PubMed] [Google Scholar]
- Brinckmann P, Frobin W, Leivseth G. Musculoskeletal Biomechanics. Stuttgart: Thieme; 2000. [Google Scholar]
- Chaffin DB, Redfern DR, Erig M, et al. Lumbar muscle size and locations from CT scans of 96 women of age 40 to 63 years. Clin Biomech. 1990;5:9–16. doi: 10.1016/0268-0033(90)90026-3. [DOI] [PubMed] [Google Scholar]
- Cornwall J, Stringer MD, Duxson M. Functional morphology of the thoracolumbar transversospinal muscles. Spine. 2011;36:E1053–E1061. doi: 10.1097/BRS.0b013e3181f79629. [DOI] [PubMed] [Google Scholar]
- Danneels LA, Vanderstraeten GG, Cambier DC, et al. CT imaging of trunk muscles in chronic low back pain patients and healthy control subjects. Eur Spine J. 2000;9:266–272. doi: 10.1007/s005860000190. [DOI] [PMC free article] [PubMed] [Google Scholar]
- Ehret AE, Böl M, Itskov M. A continuum constitutive model for the active behaviour of skeletal muscle. J Mech Phys Solids. 2011;59:625–636. [Google Scholar]
- Folland J, Williams A. The adaptations to strength training: morphological and neurological contributions to increased strength. Sports Med. 2007;37:145–168. doi: 10.2165/00007256-200737020-00004. [DOI] [PubMed] [Google Scholar]
- Hammerberg EM, Wood KB. Sagittal profile of the elderly. J Spinal Disord Tech. 2003;16:44. doi: 10.1097/00024720-200302000-00008. [DOI] [PubMed] [Google Scholar]
- Han K-S, Rohlmann A, Yang S-J, et al. Spinal muscles can create compressive follower loads in the lumbar spine in a neutral standing posture. Med Eng Phys. 2011;33:472–478. doi: 10.1016/j.medengphy.2010.11.014. [DOI] [PubMed] [Google Scholar]
- Hansen L, de Zee M, Rasmussen J, et al. Anatomy and biomechanics of the back muscles in the lumbar spine with reference to biomechanical modeling. Spine. 2006;31:1888–1899. doi: 10.1097/01.brs.0000229232.66090.58. [DOI] [PubMed] [Google Scholar]
- Hides J, Gilmore C, Stanton W, et al. Multifidus size and symmetry among chronic LBP and healthy asymptomatic subjects. Man Ther. 2008;13:43–49. doi: 10.1016/j.math.2006.07.017. [DOI] [PubMed] [Google Scholar]
- Janssen I, Heymsfield SB, Wang Z, et al. Skeletal muscle mass and distribution in 468 men and women aged 18–88 yr. J Appl Physiol. 2000;89:81–88. doi: 10.1152/jappl.2000.89.1.81. [DOI] [PubMed] [Google Scholar]
- Jones E, Bishop P, Woods A, et al. Cross-sectional area and muscular strength: a brief review. Sports Med. 2008;38:987–994. doi: 10.2165/00007256-200838120-00003. [DOI] [PubMed] [Google Scholar]
- Jorgensen MJ, Marras WS, Gupta P. Cross-sectional area of the lumbar back muscles as a function of torso flexion. Clin Biomech. 2003;18:280–286. doi: 10.1016/s0268-0033(03)00027-5. [DOI] [PubMed] [Google Scholar]
- Kamaz M, Kireşi D, Oğuz H, et al. CT measurement of trunk muscle areas in patients with chronic low back pain. Diagn Interv Radiol. 2007;13:144–148. [PubMed] [Google Scholar]
- Kim K, Kim YH. Role of trunk muscles in generating follower load in the lumbar spine of neutral standing posture. J Biomech Eng. 2008;130:041005. doi: 10.1115/1.2907739. 7p. [DOI] [PubMed] [Google Scholar]
- Kim K, Kim YH, Lee S. Increase of load-carrying capacity under follower load generated by trunk muscles in lumbar spine. J Eng Med. 2007;221:229–235. doi: 10.1243/09544119JEIM229. [DOI] [PubMed] [Google Scholar]
- Knapp KM, Welsman JR, Hopkins SJ, et al. Obesity increases precision errors in dual-energy x-ray absorptiometry measurements. J Clin Densitom. 2012;15:315–319. doi: 10.1016/j.jocd.2012.01.002. [DOI] [PubMed] [Google Scholar]
- Lang T, Streeper T, Cawthon P, et al. Sarcopenia: etiology, clinical consequences, intervention, and assessment. Osteoporos Int. 2010;21:543–559. doi: 10.1007/s00198-009-1059-y. [DOI] [PMC free article] [PubMed] [Google Scholar]
- Macintosh JE, Bogduk N. The biomechanics of the lumbar multifidus. Clin Biomech. 1986;1:205–213. doi: 10.1016/0268-0033(86)90147-6. [DOI] [PubMed] [Google Scholar]
- Macintosh JE, Bogduk N. The attachments of the lumbar erector spinae. Spine. 1991;16:783–792. doi: 10.1097/00007632-199107000-00017. [DOI] [PubMed] [Google Scholar]
- Marras WS, Jorgensen MJ, Granata KP, et al. Female and male trunk geometry: size and prediction of the spine loading trunk muscles derived from MRI. Clin Biomech. 2001;16:38–46. doi: 10.1016/s0268-0033(00)00046-2. [DOI] [PubMed] [Google Scholar]
- Meakin JR, Aspden RM. Modeling the effect of variation in sagittal curvature on the force required to produce a follower load in the lumbar spine. J Mech Med Biol. 2012;12:1–10. [Google Scholar]
- Meakin JR, Gregory JS, Smith FW, et al. Characterizing the shape of the lumbar spine using an active shape model: reliability and precision of the method. Spine. 2008;33:807–813. doi: 10.1097/BRS.0b013e31816949e6. [DOI] [PubMed] [Google Scholar]
- Meakin JR, Gregory JS, Aspden RM, et al. The intrinsic shape of the human lumbar spine in the supine, standing and sitting postures: characterization using an active shape model. J Anat. 2009;215:206–211. doi: 10.1111/j.1469-7580.2009.01102.x. [DOI] [PMC free article] [PubMed] [Google Scholar]
- Nussbaum MA, Chaffin DB, Rechtien CJ. Muscle lines-of-action affect predicted forces in optimization-based spine muscle modeling. J Biomech. 1995;28:401–409. doi: 10.1016/0021-9290(94)00078-i. [DOI] [PubMed] [Google Scholar]
- Patwardhan AG, Havey RM, Meade KP, et al. A follower load increases the load-carrying capacity of the lumbar spine in compression. Spine. 1999;24:1003–1009. doi: 10.1097/00007632-199905150-00014. [DOI] [PubMed] [Google Scholar]
- Ryall JG, Schertzer JD, Lynch GS. Cellular and molecular mechanisms underlying age-related skeletal muscle wasting and weakness. Biogerontology. 2008;9:213–228. doi: 10.1007/s10522-008-9131-0. [DOI] [PubMed] [Google Scholar]
- Stagnara P, Claude de Mauroy J, Dran G, et al. Reciprocal angulation of vertebral bodies in a sagittal plane: approach to references for the evaluation of kyphosis and lordosis. Spine. 1982;7:335–342. doi: 10.1097/00007632-198207000-00003. [DOI] [PubMed] [Google Scholar]
- Stokes MJ, Cooper RG, Morris G. Selective changes in multifidus dimensions in patients with chronic low back pain. Eur Spine J. 1992;1:38–42. doi: 10.1007/BF00302141. [DOI] [PubMed] [Google Scholar]
- Stokes M, Rankin G, Newham DJ. Ultrasound imaging of lumbar multifidus muscle: normal reference ranges for measurements and practical guidance on the technique. Man Ther. 2005;10:116–126. doi: 10.1016/j.math.2004.08.013. [DOI] [PubMed] [Google Scholar]
- Takeda N, Kobayashi T, Atsuta Y, et al. Changes in the sagittal spinal alignment of the elderly without vertebral fractures: a minimum 10-year longitudinal study. J Orthop Sci. 2009;14:748–753. doi: 10.1007/s00776-009-1394-z. [DOI] [PubMed] [Google Scholar]
- Wallwork TL, Stanton WR, Freke M, et al. The effect of chronic low back pain on size and contraction of the lumbar multifidus muscle. Man Ther. 2009;14:496–500. doi: 10.1016/j.math.2008.09.006. [DOI] [PubMed] [Google Scholar]
- Ward SR, Kim CW, Eng CM, et al. Architectural analysis and intraoperative measurements demonstrate the unique design of the multifidus muscle for lumbar spine stability. J Bone Joint Surg Am. 2009;91:176–185. doi: 10.2106/JBJS.G.01311. [DOI] [PMC free article] [PubMed] [Google Scholar]
- Wood KB, Kos P, Schendel M, et al. Effect of patient position on the sagittal-plane profile of the thoracolumbar spine. J Spinal Disord. 1996;9:165–169. [PubMed] [Google Scholar]