Abstract
Musical knowledge is ubiquitous, effortless, and implicitly acquired all over the world via exposure to musical materials in one’s culture. In contrast, one group of individuals who show insensitivity to music, specifically the inability to discriminate pitches and melodies, is the tone-deaf. In this study, we asked whether difficulties in pitch and melody discrimination among the tone-deaf could be related to learning difficulties, and, if so, what processes of learning might be affected in the tone-deaf. We investigated the learning of frequency information in a new musical system in tone-deaf individuals and matched controls. Results showed significantly impaired learning abilities in frequency matching in the tone-deaf. This impairment was positively correlated with the severity of tone deafness as assessed by the Montreal Battery for Evaluation of Amusia. Taken together, the results suggest that tone deafness is characterized by an impaired ability to acquire frequency information from pitched materials in the sound environment.
Keywords: statistical learning, frequency, probability, tone deafness, amusia, music, pitch
Introduction
Music is celebrated across all cultures and across all ages. Sensitivity to the basic principles of music is present regardless of formal musical training. The ubiquity of music begs the question of where our knowledge in music might originate at multiple levels of analysis:1 At a computational level, what types of information are represented in music? At an algorithmic level, how is music represented? And at an implementation level, what are the brain structures that give rise to musical knowledge?
While these questions get at the core of music cognition and neuroscience, more generally, answers have been offered at many levels as well. Most would agree that part of musical competence is the ability to perceive pitch,2 which is at least partially disrupted in tone-deaf (TD) individuals.3,4 But we also know that pitches do not exist in isolation, but are strung together with different frequencies and probabilities that give rise to structural aspects of music such as melody and harmony. Thus, the frequencies and probabilities that govern the cooccurrences of pitches are extremely important toward our understanding of the source of musical knowledge, and may offer a unified view between the constructs of pitch, melody, and harmony.
In the attempt to understand how knowledge of various musical constructs is acquired, researchers have pursued developmental approaches5,6 as well as cross-cultural approaches.7,8 However, both of these approaches are difficult to interpret: development unfolds with huge variability due to maturational constraints as well as differences in the complexities of environmental exposure, whereas cross-cultural differences may arise from multiple historical, cultural, and genetic and environmental causes. Even within the controlled environment of the laboratory, most test subjects have already had so much exposure to Western music that even people without musical training show implicit knowledge of the frequencies and probabilities of Western musical sounds as evidenced by electrophysiological studies.9–11 To study the source of musical knowledge as it emerges de novo, we need a new system of pitches with frequencies and probabilities that are different from Western music, but that are not confounded by long-term memory and other factors. A new musical system would give us a high degree of experimental control, so that we can systematically manipulate the frequencies and probabilities within subjects’ environment, and then compare TD and control subjects to see how TD individuals might differ in the way they learn the statistics of music.
To that end, in the past few years we have developed a new musical system based on an alternative musical scale known as the Bohlen–Pierce scale.4,12,13 The Bohlen–Pierce scale is different from the existing musical systems in important ways. Musical systems around the world are based on the octave, which is a 2:1 frequency ratio; thus, an octave above a tone that is 220 Hz is 2 × 220 Hz = 440 Hz. The equal-tempered Western musical system divides the 2:1 frequency ratio into 12 logarithmically even steps, resulting in the formula F = 220 × 2(n/12), where n is the number of steps away from the starting point of the scale (220 Hz) and F is the resultant frequency of each tone. In contrast, the Bohlen–Pierce scale is based on the 3:1 frequency ratio, so that one “tritave” (instead of one octave) above 220 Hz is 3 × 220 Hz = 660 Hz, and within that 3:1 ratio there are 13 logarithmically even divisions, resulting in the formula F = 220 × 3(n/13). The 13 divisions were chosen such that dividing the tritave into 13 logarithmically even divisions results in certain tones, such as 0, 6, and 10 (each of which plugs into n in the Bohlen–Pierce scale equation to form a tone with a single frequency), which form approximate low-integer ratios relative to each other, so that when played together these three tones sound psychoacoustically consonant, i.e., “smooth” like a chord. Together, the numbers 0, 6, and 10 form the first chord. Three other chords can follow this first chord to form a four-chord progression. We can use this chord progression to compose melodies by applying rules of a finite-state grammar:13 given the 12 chord tones that represent nodes of a grammar, each tone can either repeat itself, move up or down within the same chord, or move forward toward any note in the next chord. This can be applied to all of the 12 tones in the chord progression, resulting in thousands of possible melodies that can be generated in this new musical environment. We can also conceive of an opposite but parallel musical environment where we also have four chords, but they are in retrograde (reversed order). These two musical environments are equal in event frequency—that is, each note happens the same number of times—but are different in conditional probability, in that the probability of each note given the one before it is completely different.
Having defined a robust system with which we can compose many possible melodies, we can now ask a number of questions with regard to music learning in TD individuals and controls. The first question we ask is: Can TD subjects learn from event frequencies of pitches in their sound environment? Frequency, also known as zero-order probability, represents the number of events in a sequence of stimuli. As an example in language, the word “the” has the highest frequency in the English language. In contrast to first-order and higher-order probabilities, which refer to the probabilities of events given other events that occur before them, zero-order probability is simply a count of the occurrence of each event given a corpus of input.
Frequency information is an important source of musical knowledge14 as well as linguistic knowledge and competence.15,16 Sensitivity to frequency and probability in music has been demonstrated using behavioral17 and electrophysiological techniques.12,18 In particular, the probe tone paradigm is a reliable behavioral indicator of sensitivity or implicit knowledge of event frequencies in music, so much so that it has been described as a functional listening test for musicians.19 In this study, we compared frequency learning performance between TD subjects and controls by using the probe tone test17 adapted for the new musical system.13
Methods
Subjects
Sixteen healthy volunteers, eight TD individuals and eight non-tone-deaf (NTD) controls, were recruited from schools and online advertisements from the Boston area for this study. The two groups were matched for age (mean ± SE: TD = 27 ± 1.0, NTD = 26 ± 2.1), sex (TD = five females, NTD = four females), amount of musical training (TD = 1.8 ± 1.3 years, NTD = 1.3 ± 0.8 years), and scaled IQ as assessed by the Shipley scale of intellectual functioning20 (TD = 117 ± 2.6, NTD = 118 ± 2.0). However, pitch discrimination, as assessed by a three-up one-down staircase procedure around the center frequency of 500 Hz, showed significantly higher thresholds in the TD group (TD = 24 ± 10.7 Hz, NTD = 11 ± 3.4 Hz), and performance on the Montreal Battery for Evaluation of Amusia (MBEA) was significantly impaired in the TD group (average performance on the three melody subtests (scale, interval, and contour): TD = 63 ± 3%, NTD = 85 ± 2%), thus confirming that the TD group was impaired in pitch and melody discrimination.
Stimuli
All auditory stimuli were tones in the new musical system, which were based on the Bohlen–Pierce scale as outlined in the introduction (see also Ref. 13). Each tone was 500 ms, with rise and fall times of 5 ms each. Melodies consisted of eight tones each, and a 500 ms silent pause was presented between successive melodies during the exposure phase. All test and exposure melodies were generated and presented using Max.21
Procedure
The experiment was conducted in three phases: pretest, exposure, and posttest. The pre-exposure test was conducted to obtain a baseline level of performance prior to exposure to the new musical system. This was followed by a half-hour exposure phase, during which subjects heard 400 melodies in the new musical system. After the exposure phase, a posttest was conducted in the identical manner as the pretest. The pre- and posttests consisted of 13 trials each in the probe tone paradigm.17 In each trial, subjects heard a melody followed by a “probe” tone, and their task was to rate how well the probe tone fit the preceding melody. Probe tone ratings were done on a scale of 1–7, 7 being the best fit and 1 being the worst. Previous results had shown that the profiles of subjects’ ratings reflect the frequencies of musical composition.17
Data analysis
Ratings from both pre- and posttests were regressed on the exposure corpus (i.e., the “ground truth”) to obtain a single r-value score as a measure of performance in frequency matching. Postexposure test scores (r-values) were then compared against the pre-exposure scores to assess learning due to exposure. Finally, pre-exposure and postexposure test scores were compared between groups to determine whether TD subjects were indeed impaired in learning frequency information. In an additional analysis, the melodic context used to obtain the probe tone ratings was partialed out from the correlation between pre- or postexposure ratings and the exposure corpus, such that the contribution of the melody presented before the probe tone ratings was removed.13 The resultant partial-correlation scores were again compared before and after exposure, and between TD and NTD groups.
Results
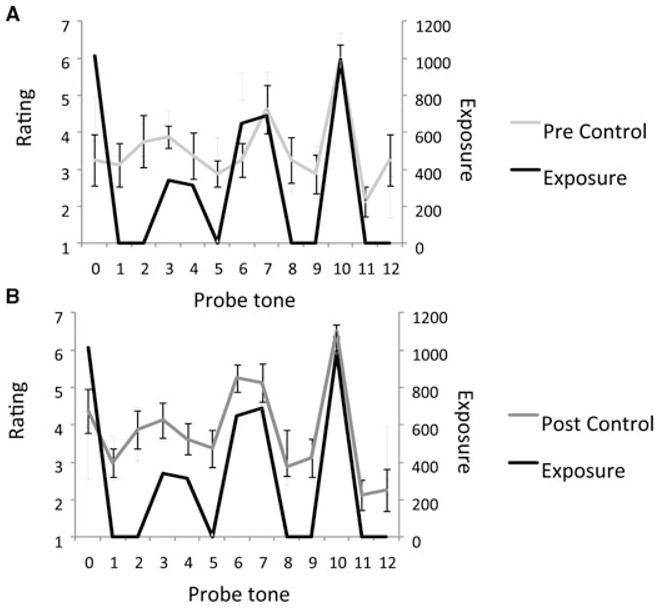
Figure 1A shows the results of NTD control subjects’ ratings done before exposure, whereas Figure 1B shows the same subjects’ ratings after exposure. The exposure profile (“ground truth”) is plotted in black for comparison purposes in both cases. Compared to pretest ratings, posttest ratings are more highly correlated with exposure, suggesting that within half an hour of exposure, subjects acquired sensitivity to the frequency structures of the new musical system.
Figure 1.

Probe tone ratings and exposure profiles in control subjects. (A) Pre-exposure. (B) Postexposure. Ratings are plotted as a function of probe tone, where each of the tones corresponds to a single note in the Bohlen–Pierce scale. In both panels, the black line is a histogram of what subjects heard during the exposure phase (i.e., the “ground truth”). The gray line is subjects’ averaged ratings. Error bars indicate ±1 between-subject standard error. The postexposure ratings are highly correlated with the ground truth, suggesting that within half an hour of exposure, subjects acquired sensitivity to the frequency structures of the new musical system.
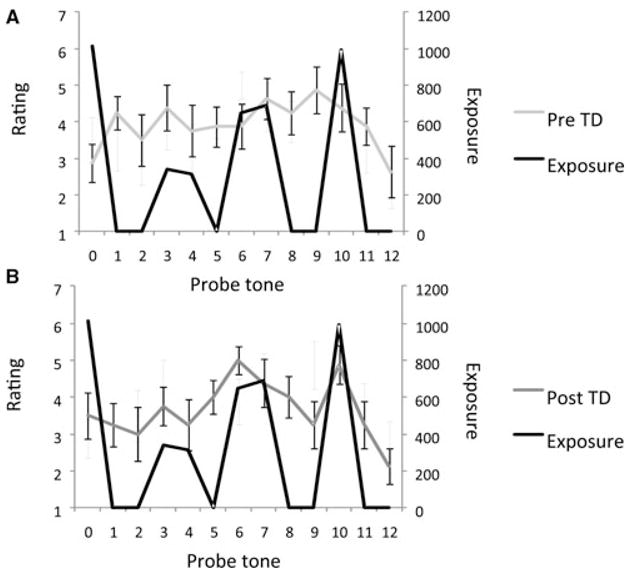
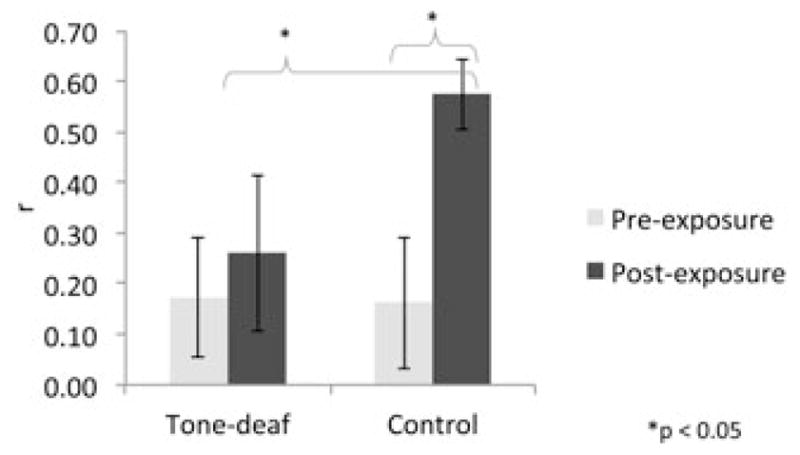
In contrast, ratings by the TD individuals were not so highly correlated with exposure (Fig. 2A shows pre-exposure ratings; Fig. 2B shows postex-posure ratings). When the two groups of subjects are compared in their frequency-matching scores (calculated as an r-value expressing the correlation between ratings and exposure profile; Fig. 3), it becomes clear that the controls acquired sensitivity to tone frequencies after exposure as evidenced by the improvement in correlation between probe tone ratings and exposure, whereas TD individuals showed no such improvement, suggesting that TD individuals are impaired in frequency learning.
Figure 2.

Probe tone ratings and exposure profiles in TD subjects. (A) Pre-exposure. (B) Postexposure.
Figure 3.

Frequency-matching scores for pre- and postexposure tests comparing tone-deaf and control groups.
A t-test comparing pre- and postexposure frequency-matching scores was significant (t(15) = 2.55, P = 0.022) for NTD controls, confirming successful learning in the controls (Fig. 1). In contrast, TD subjects were unable to learn the frequency structure of the new musical system, as shown by ratings that were uncorrelated with exposure frequencies both before and after exposure (Fig. 2), as well as statistically indistinguishable performance between pre- and postexposure frequency-matching scores (t(15) = 1.41, P = 0.18). A direct comparison of postexposure frequency-matching scores between TD subjects and controls was significant (t(15) = 2.25, P = 0.038), confirming that TD individuals performed worse than controls after exposure (Fig. 3). With small sample sizes with nonparamet-ric distributions, the Friedman test is appropriate as an alternative to the two-way analysis of variance (ANOVA). The Friedman test is marginally significant for the correlation scores (Q(28) = 3.45, P = 0.06); however, when the effects of the melodic context are partialed out, then the Friedman’s is highly significant (Q(28) = 22.6, P < 0.001), suggesting that NTD controls learned the frequency structure of the new musical system, whereas the TD subjects did not.
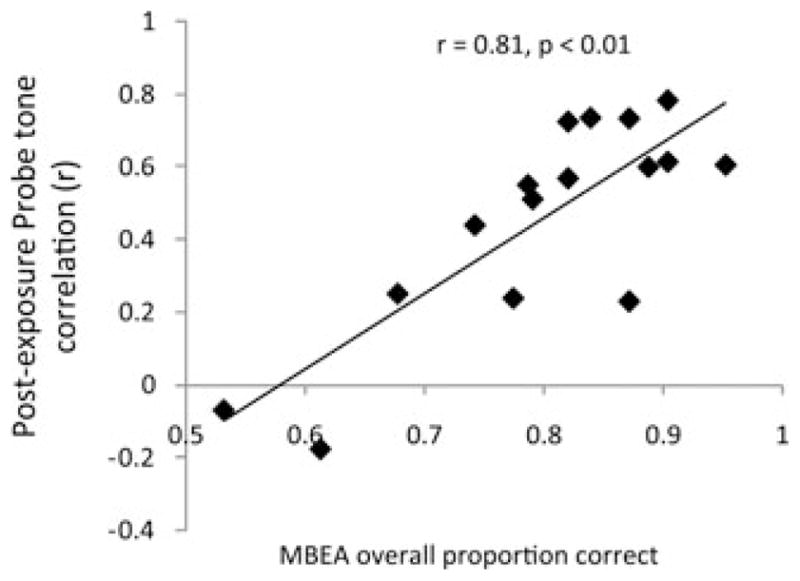
If tone deafness is truly linked to a disrupted ability to learn from the event frequencies of different pitches, then individuals who are more TD should be worse learners. To test the hypothesis that individuals who are more severely TD might be more severely impaired in frequency learning, we correlated the performance score (r-values) in the post-exposure test with the scale subtest of the MBEA.22 Results showed a significant inverse correlation between MBEA score and learning performance score (Fig. 4). This confirms that the more severely TD subjects are less able to learn the event frequencies of pitches from exposure, consistent with the hypothesis that tone deafness is characterized by the inability to acquire the frequency structure of music.
Figure 4.

Relationship between postexposure frequency-matching scores and performance on the scale subtest of the MBEA.
Discussion
While NTD subjects learned the frequency structure of the new musical system within half-an-hour of exposure, TD individuals failed to learn the same frequency structure. Furthermore, learning scores as obtained from the present frequency-matching probe tone task is correlated with the MBEA, confirming that the impairment of the statistical learning mechanism is related to the severity of tone deafness.
Taken together, the results suggest that insensitivity to musical pitch in the TD could arise from learning difficulties, specifically in the learning of event frequency information. To answer our original question of what gives rise to the lack of musical knowledge in the TD population, we have shown that TD individuals, who possess known disabilities in pitch perception, are also impaired in frequency learning (but not necessarily in probability learning). This frequency learning ability is crucial in music acquisition as frequency information governs how pitches are combined to form melodies and harmonies, structural aspects of music that are fundamental to the perception and cognition of music.
One important design aspect of the current study is that it distinguishes frequency learning from probability learning, a distinction that has been made in the previous literature on language acquisition.23 While conditional probability (also known as first-order probability, i.e., the probability that one event follows another) is important for speech segmentation16 and is most commonly tested in statistical learning studies, event frequency (also known as zero-order probability, i.e., the number of occurrences within a corpus) is important in language for word learning24,25 as well as in music for forming a sense of key.26 Sensitivity to frequency information can be assessed using the probe tone ratings task.14,17,19 The present results show that sensitivity to event frequency is impaired in tone deafness; in this regard, our results dovetail with results from Peretz, Saffran, Schön, and Gosselin (in this volume), who show an inability to learn from conditional probabilities among congenital amusics. At a computational level, results relate to language-learning abilities and provide further support for the relationship between tone deafness and language-learning difficulties such as dyslexia.27 At an implementation level, results on the learning of the new musical system are compatible with diffusion tensor imaging results that relate pitch-related learning abilities to the temporal-parietal junction in the right arcuate fasciculus,28 thus offering a possible neural substrate that enables the music-learning ability.
Taken together, the current results contribute to a growing body of literature in linking music learning to language learning, and more specifically in linking tone deafness—a type of musical disability—to learning disorders that are frequently described in language development. By investigating the successes and failures in which our biological hardware enables us to absorb the frequencies and probabilities of a novel musical system, we hope to capture both the universality and the immense individual variability of the human capacity to learn from events in our sound environment.
Acknowledgments
This research was supported by funding from NIH (R01 DC 009823), the Grammy Foundation, and the John Templeton Foundation.
Footnotes
Conflicts of interest
The authors declare no conflicts of interest.
References
- 1.Marr D. Vision: A Computational Investigation into the Human Representation and Processing of Visual Information. W.H. Freeman and Company; New York, NY: 1982. [Google Scholar]
- 2.Krumhansl CL, Keil FC. Acquisition of the hierarchy of tonal functions in music. Mem Cognit. 1982;10:243–251. doi: 10.3758/bf03197636. [DOI] [PubMed] [Google Scholar]
- 3.Foxton JM, Dean JL, Gee R, et al. Characterization of deficits in pitch perception underlying ‘tone deafness’. Brain. 2004;127:801–810. doi: 10.1093/brain/awh105. [DOI] [PubMed] [Google Scholar]
- 4.Loui P, Wessel DL. Learning and liking an artificial musical system: effects of set size and repeated exposure. Music Sci. 2008;12:207–230. doi: 10.1177/102986490801200202. [DOI] [PMC free article] [PubMed] [Google Scholar]
- 5.Trainor L, Trehub SE. Key membership and implied harmony in Western tonal music: developmental perspectives. Percept Psychophys. 1994;56:125–132. doi: 10.3758/bf03213891. [DOI] [PubMed] [Google Scholar]
- 6.Hannon EE, Trainor LJ. Music acquisition: effects of enculturation and formal training on development. Trends Cogn Sci. 2007;11:466–472. doi: 10.1016/j.tics.2007.08.008. [DOI] [PubMed] [Google Scholar]
- 7.Krumhansl CL, et al. Cross-cultural music cognition: cognitive methodology applied to North Sami yoiks. Cognition. 2000;76:13–58. doi: 10.1016/s0010-0277(00)00068-8. [DOI] [PubMed] [Google Scholar]
- 8.Castellano MA, Bharucha JJ, Krumhansl CL. Tonal hierarchies in the music of north India. J Exp Psychol Gen. 1984;113:394–412. doi: 10.1037//0096-3445.113.3.394. [DOI] [PubMed] [Google Scholar]
- 9.Koelsch S, Gunter T, Friederici AD, Schroger E. Brain indices of music processing: “non-musicians” are musical. J Cogn Neurosci. 2000;12:520–541. doi: 10.1162/089892900562183. [DOI] [PubMed] [Google Scholar]
- 10.Loui P, Grent-’t-Jong T, Torpey D, Woldorff M. Effects of attention on the neural processing of harmonic syntax in Western music. Cogn Brain Res. 2005;25:678–687. doi: 10.1016/j.cogbrainres.2005.08.019. [DOI] [PubMed] [Google Scholar]
- 11.Winkler I, Haden GP, Ladinig O, et al. Newborn infants detect the beat in music. Proc Natl Acad Sci USA. 106:2468–2471. doi: 10.1073/pnas.0809035106. [DOI] [PMC free article] [PubMed] [Google Scholar]
- 12.Loui P, Wu EH, Wessel DL, Knight RT. A generalized mechanism for perception of pitch patterns. J Neurosci. 2009;29:454–459. doi: 10.1523/jneurosci.4503-08.2009. [DOI] [PMC free article] [PubMed] [Google Scholar]
- 13.Loui P, Wessel DL, Hudson Kam CL. Humans rapidly learn grammatical structure in a new musical scale. Music Percept. 2010;27:377–388. doi: 10.1525/mp.2010.27.5.377. [DOI] [PMC free article] [PubMed] [Google Scholar]
- 14.Huron D. Sweet Anticipation: Music and the Psychology of Expectation. 1. Vol. 1. MIT Press; Cambridge, MA: 2006. [Google Scholar]
- 15.Hudson Kam CL. More than words: adults learn probabilities over categories and relationships between them. Lang Learn Dev. 2009;5:115–145. doi: 10.1080/15475440902739962. [DOI] [PMC free article] [PubMed] [Google Scholar]
- 16.Saffran JR, Aslin RN, Newport E. Statistical learning by 8-month-old infants. Science. 1996;274:1926–1928. doi: 10.1126/science.274.5294.1926. [DOI] [PubMed] [Google Scholar]
- 17.Krumhansl C. Cognitive Foundations of Musical Pitch. Oxford University Press; New York, NY: 1990. [Google Scholar]
- 18.Kim SG, Kim JS, Chung CK. The effect of conditional probability of chord progression on brain response: an MEG study. PLoS ONE. 2011;6:e17337. doi: 10.1371/journal.pone.0017337. [DOI] [PMC free article] [PubMed] [Google Scholar]
- 19.Russo FA. Towards a functional hearing test for musicians: the probe tone method. In: Chasin M, editor. Hearing Loss in Musicians. Plural Publishing; San Diego, CA: 2009. pp. 145–152. [Google Scholar]
- 20.Shipley WC. A self-administering scale for measuring intellectual impairment and deterioration. J Psychol. 1940;9:371–377. [Google Scholar]
- 21.Zicarelli D. Proceedings of the International Computer Music Conference. University of Michigan; Ann Arbor, MI, USA: 1998. pp. 463–466. [Google Scholar]
- 22.Peretz I, Champod AS, Hyde K. Varieties of musical disorders. The Montreal Battery of Evaluation of Amusia. Ann NY Acad Sci. 2003;999:58–75. doi: 10.1196/annals.1284.006. [DOI] [PubMed] [Google Scholar]
- 23.Aslin R, Saffran JR, Newport E. Computation of conditional probability statistics by 8-month old infants. Psychol Sci. 1998;9:321–324. [Google Scholar]
- 24.Hall JF. Learning as a function of word-frequency. Am J Psychol. 1954;67:138–149. [PubMed] [Google Scholar]
- 25.Hochmann JR, Endress AD, Mehler J. Word frequency as a cue for identifying function words in infancy. Cognition. 2010;115:444–457. doi: 10.1016/j.cognition.2010.03.006. [DOI] [PubMed] [Google Scholar]
- 26.Temperley D, Marvin EW. Pitch-class distribution and the identification of key. Music Percept. 2008;25:193–212. doi: 10.1525/mp.2008.25.3.193. [DOI] [Google Scholar]
- 27.Loui P, Kroog K, Zuk J, et al. Relating pitch awareness to phonemic awareness in children: implications for tone-deafness and dyslexia. Front Psychol. 2011;2 doi: 10.3389/fpsyg.2011.00111. [DOI] [PMC free article] [PubMed] [Google Scholar]
- 28.Loui P, Li HC, Schlaug G. White matter integrity in right hemisphere predicts pitch-related grammar learning. NeuroImage. 2011;55:500–507. doi: 10.1016/j.neuroimage.2010.12.022. [DOI] [PMC free article] [PubMed] [Google Scholar]


