Metabolites, typically recognized as small molecules that are involved in cellular reactions, provide a functional signature of phenotype that is complimentary to the upstream biochemical information obtained from genes, transcripts, and proteins. The high-level of correlation between metabolites and phenotype has created a surge of interest in the field that is reflected in the number of metabolomic publications growing from just a few articles in 1999 to over five thousand in 2011. Although relatively new compared to its genomic and proteomic predecessors, already metabolomics has led to the discovery of biomarkers for disease, fundamental insights into cellular biochemistry, and clues related to disease pathogenesis.1,2
The success of metabolomics over the past decade has largely relied on advances in mass spectrometry instrumentation, which make it possible to detect thousands of metabolites simultaneously from a biological sample. Coupled with developments in bioinformatic tools such as XCMS-Online3,4, it has now become relatively routine to comprehensively compare the levels of thousands of metabolite peaks in one sample group to another in an untargeted manner. This approach, called untargeted metabolomics, has the potential to implicate unexpected pathways with a unique phenotype or disease process.
Despite the attractiveness of having a comprehensive and unbiased approach for profiling metabolites that is analogous to the other ‘omic sciences, an overwhelming proportion of the metabolomics community exclusively uses a targeted platform in which only a specified list of metabolites is measured. The benefit of such a targeted platform is speed. Unlike the untargeted platform, after the targeted mass spectrometry methods are established, minimal effort and resources are required to profile these specific metabolites over a large number of samples. The major bottleneck of untargeted metabolomics, in contrast, has been the challenge of determining the identities of the peaks found to be dysregulated in untargeted profiling data.
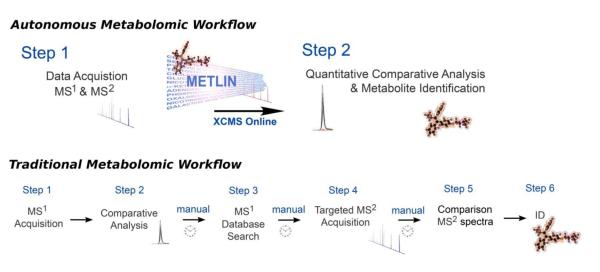
Traditionally, the untargeted metabolomic platform involves multiple steps as represented in Figure 1 (bottom). The first step is acquiring global mass spectrometry data (MS1) for each of the samples. Next, these data are analyzed by using bioinformatic software which performs quantitative analysis to find peaks that are significantly changing between sample groups. The investigator then typically searches the mass-to-charge ratio of the peaks of interest manually in metabolite databases. Searches that return hits within the mass accuracy of the instrument are considered putative identifications. To confirm the identifications, tandem mass spectral data (i.e., MS2 data) from the research sample is then compared to that of a commercial standard. To obtain MS2 data, a targeted MS2 analysis is typically performed on one of the research samples in which the peak was determined to be up-regulated. The fragmentation pattern of these MS2 data is then manually compared to the MS2 data from a commercial standard (it should be noted that not all commercial standards can be resolved by MS2 data alone, such as stereoisomers).
Figure 1.
Schematic representation of the traditional metabolomic workflow involving six steps and the new METLIN-based workflow with only two steps. In the two-step autonomous workflow, MS1 and MS2 data are acquired simultaneously during profiling and searched in the METLIN database for automated identification, thereby reducing the time of the workflow from days/weeks to minutes/hours.
To facilitate metabolite identification in the untargeted workflow, in 2004 we launched a freely accessible metabolite database called METLIN5 (http://metlin.scripps.edu) which incorporates tandem mass spectral data from model compounds. Recently, other metabolite databases such as the Human Metabolome Database (HMDB)6, MassBank7, and LipidMaps8 have also begun incorporating MS2 data for standard compounds. These repositories allow investigators to compare MS2 data from their research samples to MS2 data from model compounds catalogued in the database and thereby improve the speed, efficiency, and cost effectiveness of untargeted studies.
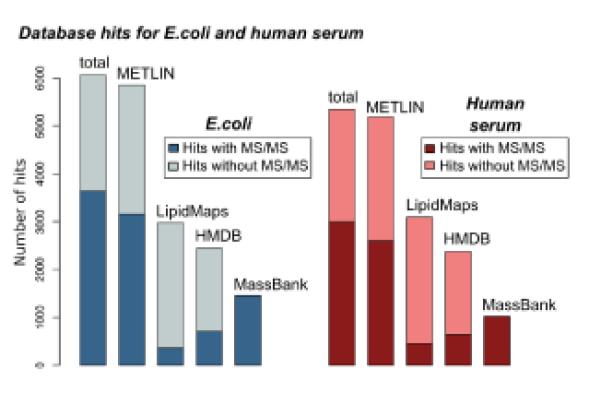
Over the past 7 years, our objective has been to generate a sufficiently large MS2 library that could be used in an automated fashion to revise the traditional untargeted metabolomic workflow (Figure 1, bottom). Since we originally published METLIN in 2005, we have increased the number of MS2 spectra included in the database by a factor of 150. As of April 2012, METLIN contains tandem mass spectral data on more than 10,000 distinct metabolites at 4 different collision energies. These data were collected by using an electrospray ionization-quadrupole time-of-flight (ESI-QTOF) mass spectrometer in both positive and negative detection mode, representing a total number of more than 48,000 high-resolution spectra. To estimate the current coverage of physiologically relevant metabolites in METLIN and the other 3 largest databases available, metabolites were isolated from E.coli and standard human serum by using defined protocols9. Samples were analyzed in both positive and negative mode with an ESI-QTOF mass spectrometer (see Supplemental Information). Each peak detected (excluding isotopes) was searched in each of the 4 databases. Figure 2 shows the number of hits for each database and also the subset of these hits for which MS2 data are available to confirm the metabolite identification.
Figure 2.

Estimate of physiological relevance of metabolite coverage in metabolomic databases. Metabolites from human serum and E.coli were isolated, analyzed in both positive and negative mode by ESI-QTOF mass spectrometry, and the mass of each was searched with a tolerance of 5 ppm in METLIN, LipidMaps, HMDB, and MassBank. LipidMaps contains primarily data on lipids, a subset of the metabolome, but was included in the comparison for the sake of completeness. The total number of features detected that were searched was 12,170 for human serum and 11,641 for E.coli. The number of hits on the basis of accurate mass is shown in light blue and light red. The subset of those hits that also contain tandem mass spectral data is shown in dark blue and dark red, respectively.
In addition to its increased size, here we describe a new version of the METLIN database that we have developed with advanced functionality to automate metabolite identification and reduce the labor-intensive bottleneck that has traditionally been associated with untargeted metabolite profiling. Instead of comparing MS2 data from research samples to MS2 data of commercial standards manually, the new version of METLIN allows metabolomic investigators to upload their MS2 data to the METLIN database so that the comparisons can be performed in an automated way. By having automated MS2 matching, metabolite identities can be confirmed much more efficiently and faster compared to the traditional untargeted metabolomic workflow. The quality of the match between the MS2 data from the research sample and the MS2 data from the METLIN library is measured by a newly introduced METLIN scoring system, which is based on a modified version of the established X-Rank scoring system10. To evaluate the correlation of METLIN MS2 data to MS2 data acquired by using different instrument platforms, a comparative experiment was performed using 23 metabolite standards. The compounds were measured on five different instruments and the resulting spectra were matched against the METLIN database. The correct result was returned based on the X-Rank scoring system as the first hit for 90 out of the 101 spectra (89.1%, see Supplemental Information).
Some classes of metabolites produce characteristic fragments or neutral losses in their MS2 spectra that can be used as signatures for unique chemical functional groups. For example, the MS2 spectra of phosphatidylcholines are characterized by a fragment at m/z 184.07. For instances in which the MS2 data uploaded by a user does not match any compound in the database, the new version of the METLIN database will search the MS2 data for characteristic fragments that can be used for molecular classification. The search can also be performed manually by accessing the “fragment search” or “neutral loss search” options. These tools provide a novel mechanism by which unknown metabolites can be chemically classified and take advantage of the large number of MS2 data in the library.
To highlight the new database functionalities, we performed MS2 on select peaks from the metabolite extracts of E. coli and human serum. These MS2 data were uploaded to the METLIN database and fragment matching was performed by using the automated feature described above. Representative examples of metabolites identified on the basis of MS1 and MS2 data by using this method are shown in Supplementary Information. Identified compounds ranged from lipids to smaller, polar metabolites. Additionally, representative examples of unknown compounds that were classified by characteristic fragments are also shown.
With the combination of the METLIN functionalities described here and the increasing speed of QTOF instrumentation for performing MS2, there is potential to reduce the untargeted metabolomic workflow to just two steps (Figure 1, top). By using high-scan speed QTOF instruments, MS1 and MS2 data can be acquired simultaneously in a single run. Quantitative information can then be extracted from the data by using the bioinformatic software XCMS-Online3 and metabolites can be identified simultaneously by matching the MS2 data against the METLIN MS2 database in an automated fashion, an approach that is self-directed or autonomous in nature. With this truncated workflow, the time needed to perform untargeted profiling and subsequent metabolite identification may be reduced to minutes to hours compared to the days or weeks needed with the traditional workflow. The results shown here from automated MS2 matching highlight the applicability of the method for performing high-throughput, untargeted metabolomics by using such an accelerated workflow. Moreover, we have shown that the coverage of the METLIN database enables the characterization and identification of thousands of naturally occurring metabolites in biological samples. Thus, the new METLIN database has the potential to expedite the workflow by which we do untargeted metabolomics as more investigators obtain mass spectrometry instrumentation that can produce high-quality MS2 data with increasing speed and sensitivity.
Supplementary Material
ACKNOWLEDGEMENTS
This work was supported by the California Institute of Regenerative Medicine (TR1-01219), the National Institutes of Health (R24 EY017540, P30 MH062261, RC1 HL101034 and P01 DA026146), and NIH/NIA L30 AG0 038036 (G.J.P.). Financial support was also received from the Department of Energy (Grants FG02-07ER64325 and DE-AC0205CH11231).
References
- 1.Yanes O, et al. Metabolic oxidation regulates embryonic stem cell differentiation. Nat Chem Biol. 2010;6:411–417. doi: 10.1038/nchembio.364. doi:10.1038/nchembio.364. [DOI] [PMC free article] [PubMed] [Google Scholar]
- 2.Patti GJ, et al. Metabolomics Implicates Altered Sphingolipid Metabolites in Chronic Pain of Neuropathic Origin. Nature Chemical Biology. doi: 10.1038/nchembio.767. (in press) [DOI] [PMC free article] [PubMed] [Google Scholar]
- 3. https://xcmsonline.scripps.edu.
- 4.Smith CA, Want EJ, O’Maille G, Abagyan R, Siuzdak G. XCMS: processing mass spectrometry data for metabolite profiling using nonlinear peak alignment, matching, and identification. Anal Chem. 2006;78:779–787. doi: 10.1021/ac051437y. doi:10.1021/ac051437y. [DOI] [PubMed] [Google Scholar]
- 5.Smith CA, et al. METLIN: a metabolite mass spectral database. Ther Drug Monit. 2005;27:747–751. doi: 10.1097/01.ftd.0000179845.53213.39. [DOI] [PubMed] [Google Scholar]
- 6.Wishart DS, et al. HMDB: a knowledgebase for the human metabolome. Nucleic Acids Res. 2009;37:D603–610. doi: 10.1093/nar/gkn810. doi:10.1093/nar/gkn810. [DOI] [PMC free article] [PubMed] [Google Scholar]
- 7.Horai H, et al. MassBank: a public repository for sharing mass spectral data for life sciences. J Mass Spectrom. 2010;45:703–714. doi: 10.1002/jms.1777. doi:10.1002/jms.1777. [DOI] [PubMed] [Google Scholar]
- 8.Sud M, et al. LMSD: LIPID MAPS structure database. Nucleic Acids Res. 2007;35:D527–532. doi: 10.1093/nar/gkl838. doi:10.1093/nar/gkl838. [DOI] [PMC free article] [PubMed] [Google Scholar]
- 9.Yanes O, Tautenhahn R, Patti GJ, Siuzdak G. Expanding coverage of the metabolome for global metabolite profiling. Anal Chem. 2011;83:2152–2161. doi: 10.1021/ac102981k. doi:10.1021/ac102981k. [DOI] [PMC free article] [PubMed] [Google Scholar]
- 10.Mylonas R, et al. X-Rank: a robust algorithm for small molecule identification using tandem mass spectrometry. Anal Chem. 2009;81:7604–7610. doi: 10.1021/ac900954d. doi:10.1021/ac900954d. [DOI] [PubMed] [Google Scholar]
Associated Data
This section collects any data citations, data availability statements, or supplementary materials included in this article.


