Summary
According to the force-length relationship, cat soleus optimal sarcomere length should lie between 2.3–2.5μm. Rack and Westbury (1969) found optimal sarcomere length around 2.8– 3.0μm. The purpose of this study was to repeat their study to check for these discrepancies between the expected and the measured optimal length. The soleus muscle of both hindlimbs of three cats was supra-maximally stimulated. Isometric forces were measured for lengths ranging from −20 to +20mm relative to the optimal length. Mean sarcomere lengths were obtained by laser diffraction. Fibre length was obtained post-mortem by video analysis and in situ with sonomicrometry crystals. Sarcomere number was determined and in situ sarcomere lengths were calculated. The sarcomere force-length relationship showed an ascending and descending part with a plateau between 2.0–2.4μm. Peak forces were obtained at smaller average sarcomere lengths than reported by Rack and Westbury and closer to the optimal sarcomere length based on sliding filament considerations.
Keywords: laser diffraction, muscle fibre, sarcomere, skeletal muscle, sonomicrometry
Introduction
The force-length relationship describes the relation between the maximal force a muscle (or fibre, or sarcomere) can exert and its length1. This relationship became important in the field of muscle mechanics when Gordon et al.2 provided evidence in support of the Cross-bridge Theory of muscle contraction3 by showing that the force produced by isolated frog fibres depended on sarcomere length as predicted by the theory. Specifically, force-length properties of muscles/fibres are typically associated with sarcomere lengths or, more precisely, the overlap of thick and thin myofilaments within a sarcomere.
Since the classic work by Gordon et al.2, many studies have shown the dependence of force on muscle, fibre and sarcomere lengths (e.g. 4–8). Based on the sliding filament theory, it is possible to determine the sarcomere force-length relationship for different species of skeletal muscles if the length of the thin (actin) myofilament is known2. For example, in frog muscles the plateau of the sarcomere force-length relationship occurs at approximately 2.0–2.2μm (that is twice the length of the thin filament - 0.95μm - plus the width of the z-band - 0.1μm - for the lower number plus the width of the bare zone on the thick filament - 0.2μm for the bigger number). For human sarcomeres with a thin myofilament length of approximately 1.27μm 9, the plateau would range from 2.64–2.84μm.
Thin myofilament length in cat soleus muscle is approximately 1.12μm 10, thus the plateau of the force-length relationship would be expected to be approximately between sarcomere lengths of 2.34–2.54μm. However, Rack and Westbury4 determined the force-length properties of cat soleus experimentally and found the plateau at sarcomere lengths of approximately 2.8–3.0μm. They determined sarcomere lengths from muscles harvested at sacrifice, by carefully determining sarcomere length for known muscle length and joint configurations. However, this method neglects any sarcomere shortening at the expense of series elasticity stretching that might be associated with force production.
The cat soleus tendon has been found to be extremely stiff, and elongations of the tendon for forces that can be produced by soleus are thought to be negligible11. Also, the cat soleus muscle has a small angle of pennation12. Based on these two structural properties one would expect soleus fibre and sarcomere elongations to follow rather precisely the elongations of the whole muscle. However, neither the sarcomere force-length relationship nor the fibre and sarcomere behaviour as a function of soleus length changes are known. Although it has been demonstrated on several occasions that fibre and muscle length changes might be quite dissociated in pennate muscles with compliant tendons13,14, such a study has never been performed in a muscle such as the cat soleus which is essentially parallel fibred and has a virtually rigid tendon.
It has been argued that the sarcomere force-length relationship may also represent the whole muscle relationship well. However, Rack and Westbury4 reported for cat soleus that the force-length properties of the whole muscle are shifted relative to that expected for the whole muscle based on myofilament lengths. Here, we wanted to reinvestigate the relationship between sarcomere and whole muscle force-length relationship accounting for the fact that fibre length (and thus average sarcomere lengths) depend not only on muscle length but also on force. This aspect was neglected by Rack and Westbury (1969) in their classic work and has typically been neglected in the literature. Therefore, the purpose of this study was to repeat the investigation performed by Rack and Westbury4; that is to determine the sarcomere, fibre and muscle force-length relationship of cat soleus. However, and in contrast to Rack and Westbury (1969), fibre (and thus average sarcomere) lengths were directly measured during the isometric contractions using a sonomicrometry system. We hypothesized that, optimal sarcomere lengths would be somewhere between 2.3–2.5μm, rather than 3.0μm 4, and that fibre length changes would be substantially smaller than the corresponding muscle length changes.
Materials and methods
Testing was performed on six soleus muscles of outbred adult male cats (body mass = 3–4 Kg). The cat soleus was chosen because of the precedence set by Rack and West-bury4 and because it is an essentially parallel fibred muscle (angle of pennation about 6° 12) with a “rigid” tendon11. All experimental procedures were approved by the Animal Ethics Committee of the University of Calgary, and have been described elsewhere15,16. Therefore, only a brief description will be given here.
Anesthesia
Cats were anesthetized using a nitric oxide, halothane (5%), oxygen mixture and were intubated and maintained at 0.8–1.0% of halothane during the entire experiment. The animals were regularly monitored through ear and pupil reflexes, and the level of halothane was adjusted in order to maintain proper anesthesia throughout the experiments.
Artificial Electrical Stimulation
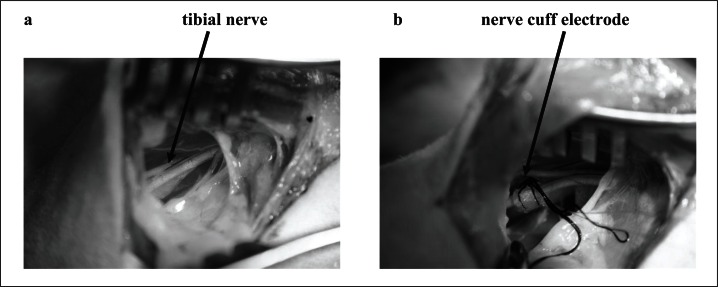
An incision was made at the latero-posterior part of the thigh, and the tibial nerve was exposed. A nerve cuff stimulation electrode (Fig. 1) was fixed around the tibial nerve15, and the skin was sutured closed in order to maintain adequate moisture and temperature at the electrode site.
Figure 1.
Exposure of the tibial nerve (a) and positioning of the nerve cuff electrode around the tibial nerve (b).
Supra-maximal electrical stimulation was achieved through a voltage at three times the alpha motor neurons threshold15 using a Grass S8800 stimulator (Grass Technologies, West Warwick RI, USA). Monopolar rectangular pulses (0.1 ms duration) were used for single twitches, doublets (two twitches separated by 8ms), and frequencies of stimulation of 10, 30 and 100 Hz.
Muscle Preparation
The soleus muscle, its tendon and the calcaneus bone were exposed through a single incision at the lateral posterior aspect of the leg. The muscles surrounding soleus (plantaris and both heads of the gastrocnemius) were carefully dissected, and their respective tendons were cut, thereby completely isolating the soleus tendon. The soleus tendon was then cut at its distal insertion with a remnant piece of the calcaneus bone, which could then be clamped at the muscle puller.
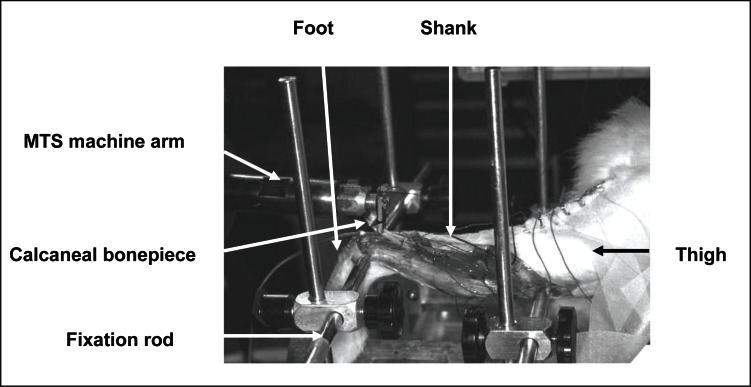
Cats were positioned prone in a hammock and the pelvis, thigh and shank of the experimental hind limb were fixed to a stainless steel stereotaxic frame by bilateral stainless steel rods (Fig. 2). The calcaneous was fixed to the muscle puller (MTS, Eden Praire, MN, USA; natural frequency > 10kHz).
Figure 2.
Hind limb fixation (lateral view) in the stereotaxic frame. Stainless steel rods were inserted in the tibia and the femur.
The exposed soleus was covered with gauze soaked in saline solution, and warmed with an infrared lamp in order to maintain a muscle temperature between 30–35°C. Muscle force and excursion were measured continuously with the MTS machine at a sampling frequency of 200 Hz.
Muscle Fascicle Length Measurements
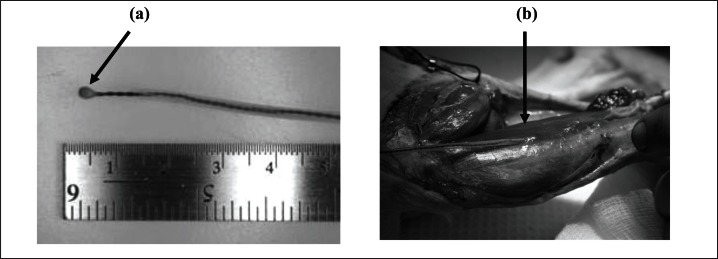
Sonomicrometry crystals (Sonometrics Corporation, London, Ontario, Canada; 2 mm diameter, 24 AWG Cu) were implanted into a proximal and a distal fascicle of the soleus (Fig. 3). The crystals were implanted at either end of a fascicle that was identified by microstimulation. For optimal recording of fascicle lengths, and for preventing movement of the crystals relative to the fascicle endpoints, the crystals were sutured fixed just underneath the fascia of the target fascicle endpoints. Sonomicrometry signals were collected at a sampling frequency of 463Hz and stored on a computer for off-line analysis.
Figure 3.
Dimension of sonomicrometry crystal (a) and implanted crystal at the fascia covering the distal fibre fascicle of the soleus muscle (b).
Force measurements protocol
Optimal soleus length was defined as the length at which the muscle produced maximal active isometric force at 100Hz stimulation. This length was then given the value of 0mm length and subsequent values were measured from this length, negative values indicating shorter and positive values indicating longer than optimal lengths. Isometric forces were measured for length ranging from approximately −20 to +20mm (in 2mm intervals), and for stimulations frequencies of 1Hz (twitch), a doublet contraction (two twitches separated by 8ms), 10, 30 and 100Hz. The 10Hz contractions lasted for ten seconds, while the 30 and 100 Hz contractions lasted for two seconds. A two-minute interval was observed between contractions in order to avoid fatigue.
Sarcomere length measurements
After all force and length measurements had been obtained, animals were euthanized by an IV injection of sodium pentobarbital (Euthanyl, 240 mg/ml, Bimeda-MTC inc., Cambridge, Ontario, Canada) and both hind limbs were removed. The skin covering the muscle was dissected and the intact soleus muscle was removed from its bony insertions, stretched to optimal lengths (as measured with the sonomicrometry system), fixed at that length with pins inserted into the ends of the muscle, and immersed and maintained for about 30 days in a 10% formalin solution. After fixation a medial, a central and a lateral part of soleus were isolated taking great care that the sonomicrometry crystals for the distal and proximal fascicle were retained, immersed in nitric acid (30%), and diluted in distilled water (70%) for approximately 3 days. Then, small muscle fascicles were isolated and washed in a saline solution for a few hours and placed in glycerol.
Five fascicles each were extracted from the medial, central and lateral part of soleus and placed on slides. The length of each fascicle was measured using a video analysis system (Matrox II, Motion Analysis Corporation, Santa Rosa, CA, USA). Mean sarcomere lengths were then obtained from six measurements along each fascicle using a laser diffraction approach [beam diameter = 0.8mm; (16–18)]. Sarcomere number per fascicle was determined by dividing the fascicle length by the average sarcomere length. In situ sarcomere lengths could then be calculated from the fascicle lengths measured during the experiments and the known serial number of sarcomeres in the fascicles represented by the sonomicrometry crystals.
Data analysis
For each stimulation frequency, the peak forces were obtained for analysis. The active forces were determined by subtracting the measured passive from the measured total forces at each length and stimulation frequency.
In situ fascicle lengths were obtained directly from the sonomicrometry system and they were synchronized with the corresponding force values.
A Friedman’s repeated measures analysis on ranks was used to detect differences in sarcomere lengths for the different stimulation frequencies and muscle lengths. A significance level of 0.05 was adopted throughout the test.
Results
From the fibre length measurements and associated determination of the number of serial sarcomeres in fascicles marked by the sonomicrometry crystals, and from the direct fascicle length measurements for isometric contractions at different muscle length and stimulation frequencies, a relationship between average sarcomere lengths and isometric forces could be determined (Fig. 4). The sarcomere force-length relationship shows an ascending and descending part with a plateau ranging from approximately 2.0–2.4μm (Fig. 4A). Passive forces appeared at average sarcomere lengths of about 2.0μm; they increased exponentially and reached values of approximately 40% of the maximal isometric force (30 and 100Hz stimulation) at an average sarcomere length of approximately 2.8μm. The active forces at an average sarcomere length of 2.8μm (the optimal length reported by Rack and Westbury (1969) were approximately 60% of maximum, illustrating the dramatic effect of accounting for series elasticity, and the great error in neglecting this effect4. This effect is best illustrated by the substantial changes in fibre lengths from the passive to the active muscle (Fig. 5). The average optimal length was greater for the single twitch and the doublet stimulation compared to that observed for stimulation frequencies of 30 and 100 Hz.
Figure 4.
Passive and active sarcomere (A) and muscle (B) force-length relationships (mean + SE; n = 6; length changes = 2mm). Active force was obtained at different stimulation frequencies (twitch = open circle, doublet = filled diamond, 10Hz = open square, 30Hz = filled circle and 100Hz = open triangle). Active force increased with increasing muscle length up to approximately 2.0 to 2.4 μm and decreased with further increases in muscle length for almost all stimulation frequencies. Passive force (filled triangles) increased with increasing muscle length from 1.8 to 2.6 μm of stretching in an exponential way. Mean (± SE) sarcomere length change from both legs of the three cats as a function of stimulation frequency (* indicates p<0.05 when comparing 1Hz and 2 Hz with 30 Hz; # indicates p<0.05 between 2Hz and 100Hz). A Friedman’s repeated measures analysis on ranks was used for statistical analysis.
Figure 5.
Changes in fibre lengths from the passive to the active muscle lengths.
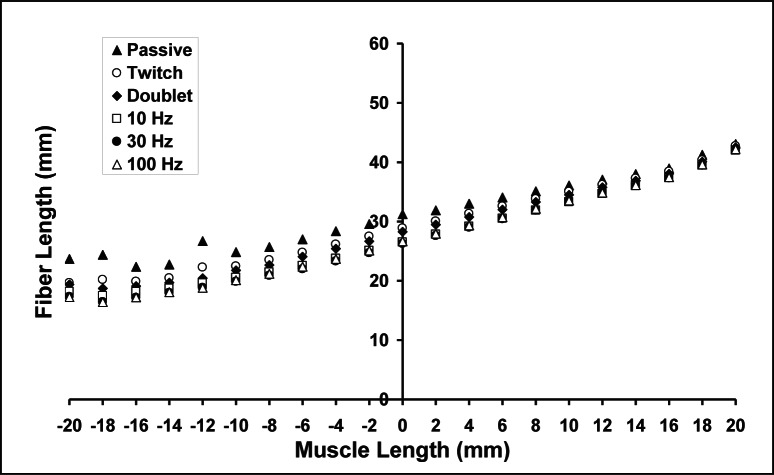
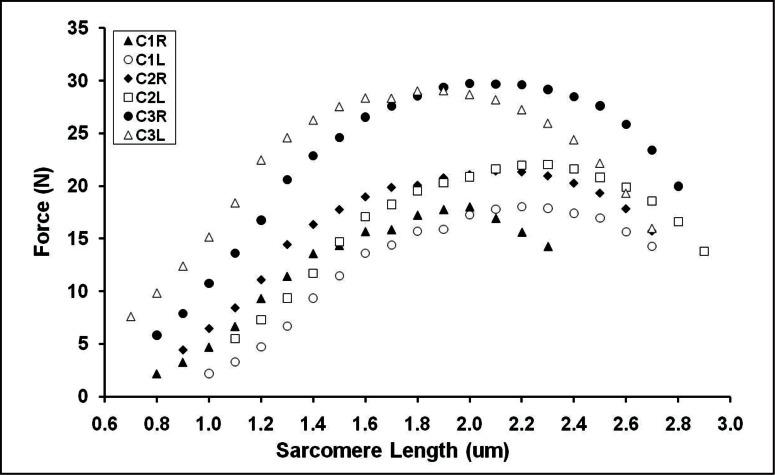
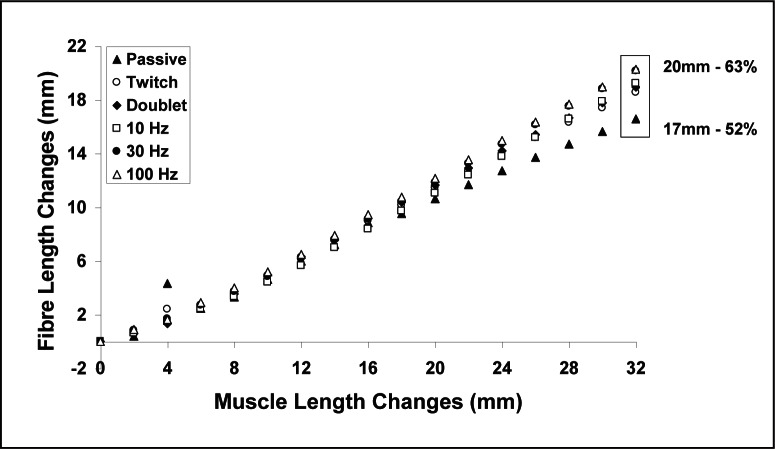
A similar behavior can be observed for the force-length relationship of the entire muscle (Fig. 4B). Although small, there appears to be a shift of the peak force to the right with decreasing stimulation frequency. The individual force versus sarcomere length data for each muscle and a frequency of stimulation of 100 Hz (Fig. 6) shows a clear and consistent effect of length on the force for each data set and not just an effect that emerges from the mean curve. Fibre lengths increased with increasing muscle lengths, as expected, and decreased with increasing forces at a given muscle length (Fig. 7). For a muscle length change of 32mm, passive fibre lengths changed by approximately 17mm or about 52% of the muscle lengths. Fibre length changes were also substantially smaller than muscle length changes for active contractions. For example at 100Hz, fibre lengths changed by about 20mm or 63% of the muscle length change. The difference between passive and active fibre length changes increased with increasing muscle length and stimulation frequencies.
Figure 6.
Active sarcomere force-length relationship for each limb of the cats (distal fibres) for the frequency of 100 Hz. C1R= rigth leg of cat 1; C1L= left leg of cat 1; C2R= rigth leg of cat 2; C2L= left leg of cat 2; C3R= rigth leg of cat 3; C3L= left leg of cat 3.
Figure 7.
Mean variation of fibre length as a function of muscle length. Mean values were calculated as an average length from proximal and distal fibres of each hind limb (2 fascicles x 6 muscles = 12 observations).
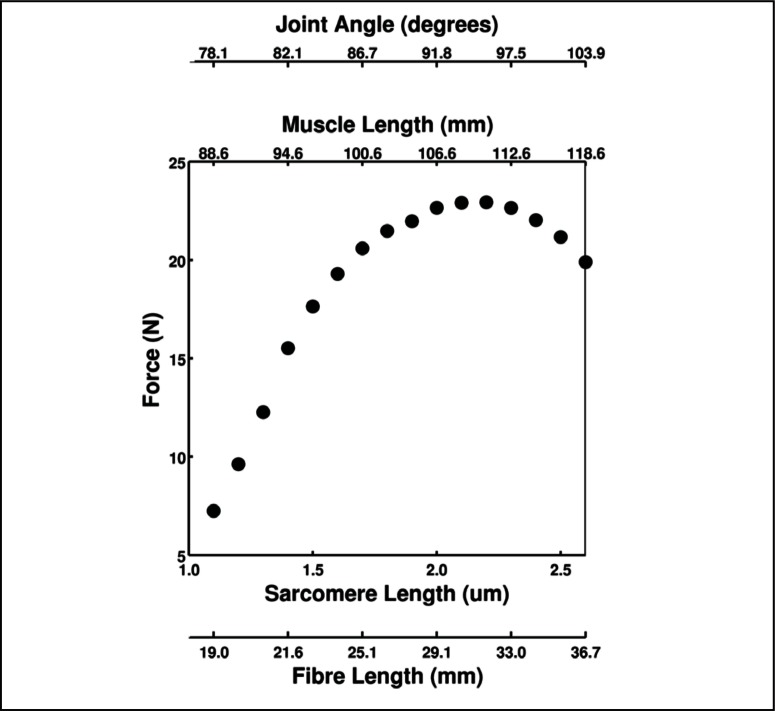
The sarcomere force-length relationship showed an ascending and descending part with a plateau between 2.0–2.4μm (Fig. 8). Peak forces are also shown as a function of fibre length, muscle length and joint angle.
Figure 8.
Force-length relationship of supramaximal tetanic contractions at four different structural levels. Force was obtained by 100 Hz stimulation frequency as a function of sarcomere length, fibre length, muscle length and joint angle. Values represent a mean value from the six hindlimbs used in the study.
Discussion
The force-length relationship is arguably the most prominent and important property of skeletal muscle function. It has been known and described systematically as early as the late 19th century (e.g. 18–20), and was associated with sarcomeres length, or more precisely the amount of myofilament overlap, by Gordon et al.2. Although it has not been possible to measure the true force-length relationship in a single sarcomere to date, the results of Gordon et al. have not been questioned seriously, and have formed the foundation for one of the most basic predictions of the cross-bridge theory3. Similarly, it has been assumed implicitly that the sarcomere force-length relationship also holds for whole muscle preparations, with due account given to sarcomere length non-uniformities and structural constraints, but this assumption has not been carefully studied.
Rack and Westbury4 measured the force-length properties of the cat soleus and measured sarcomere lengths following sacrifice. They assumed that the fibre length, and thus the average sarcomere length, was directly proportional to muscle length, thereby ignoring the possible shortening of fibres during force production. However, here we demonstrate that fibre shortening from the passive to the active state can be substantial (Fig. 5) thereby questioning Rack and Westbury’s4 assumption. The optimal sarcomere length for cat soleus derived in this manner was approximately 2.8–3.0μm, or about 0.3–0.7μm greater than expected based on myofilament lengths in the cat (10), and the sliding filament and cross-bridge theory of muscle contraction2,3,22,23. Rack and Westbury’s assumption that fibre length changes were independent of force, appears justified on the surface by the nearly parallel nature of fibre alignment12, and the virtually rigid tendon of the cat soleus11, but was shown to be inappropriate here (Fig. 5). When accounting for series elasticity in the cat soleus, as done here, a mean sarcomere length of 2.8μm is clearly located on the descending limb of the force-length relationship with a force of approximately 60% of maximum. Therefore, the results by Rack and Westbury4, must be considered with utmost caution.
Here, we re-investigated the force-length relationship of cat soleus while measuring muscle and fibre length directly using sonomicrometry. This approach, different from the one used by Rack and Westbury4, allowed for determining the fibre length changes associated with muscle length changes and force production. Fibre length changes were always much smaller than the associated muscle length changes (Fig. 7), and force production was always associated with substantial fibre shortening at a given muscle length (Fig. 5). This result indicates that cat soleus series elasticity plays a crucial role in muscle function and the force-length properties, even though this elasticity is likely not associated with the tendon, but other passive structures. The difference in fibre lengths between active and passive muscle elongation explains that optimal fibre length in our study was associated with shorter sarcomere lengths than found by Rack and Westbury4, and was close to sarcomere lengths that one would expect theoretically based on optimal myofilament overlap.
Although it is not feasible to measure the length of individual sarcomeres during dynamic contractions of a whole muscle in vivo, work in single myofibrils suggest that normal sarcomere length variations are about ± 20%. This value is in good agreement with the only paper that lists individual sarcomere length variations in a whole muscle under static conditions24.
Previous studies have shown that the cat soleus operates primarily on the ascending limb and plateau of the force-length relationship during normal locomotion and everyday tasks7. This would correspond to sarcomere length of approximately 2.2–2.4μm and less. Passive forces at those sarcomere lengths are between 2–4% of the maximal isometric force, thus it can be safely assumed that passive force plays a small role in normal cat locomotion.
We conclude that maximal isometric forces in the intact cat soleus are achieved at sarcomere lengths that are approximately optimal, that is between about 2.0–2.4μm. Fibre length changes in soleus are substantially smaller than the corresponding muscle length changes despite a virtually rigid tendon and an almost parallel fibre structure, and fibre/sarcomere lengths change substantially between the passive and active muscle at any given length.
Acknowledgments
The authors would like to thank Dr. Tim Butterfield, M.Sc. Karyn Weiss-Bundy, and Hoa Nguyen for technical help.
Footnotes
Research supported by CAPES-Brazil, Canadian Institutes of Health Research and Canada Research Chairs’ Programme. C. Freitas was recipient of a fellowship from CAPES.
References
- 1.Herzog W. Chapter 2.7. Muscle. In: Nigg BM, Herzog W, editors. Biomechanics of the Musculo-Skeletal System. 2nd Edition. New York: John Wiley & Sons; 1999. pp. 148–188. [Google Scholar]
- 2.Gordon AM, Huxley AF, Julian FJ. The variation in isometric tension with sarcomere length in vertebrate muscle fibres. J Physiol. 1966;184:170–192. doi: 10.1113/jphysiol.1966.sp007909. [DOI] [PMC free article] [PubMed] [Google Scholar]
- 3.Huxley AF. Muscle structure and theories of contraction. Progr Biophys Biophys Chem. 1957;7:255–318. [PubMed] [Google Scholar]
- 4.Rack MH, Westbury DR. The effects of length and stimulus rate on tension in the isometric cat soleus muscle. J Physiol. 1969;204:443–460. doi: 10.1113/jphysiol.1969.sp008923. [DOI] [PMC free article] [PubMed] [Google Scholar]
- 5.Herzog W, Ter Keurs HEDJ. Force-length relation of in-vivo human rectus femoris muscles. Pflügers Arc. 1988;411:642–647. doi: 10.1007/BF00580860. [DOI] [PubMed] [Google Scholar]
- 6.Granzier HLM, Akster HA, Ter Keurs HED. Effect of thin filament length on the force-sarcomere length relation of skeletal muscle. Am J Physiol. 1991;260:C1060–C1070. doi: 10.1152/ajpcell.1991.260.5.C1060. [DOI] [PubMed] [Google Scholar]
- 7.Herzog W, Leonard TR, Renaud JM, Wallace J, Chaki G, Bornemisza S. Force-length properties and functional demands of cat gastrocnemius, soleus and plantaris muscles. J Biomec. 1992;25:1329–1335. doi: 10.1016/0021-9290(92)90288-c. [DOI] [PubMed] [Google Scholar]
- 8.Ter Keurs HEDJ, Iwazumi T, Pollack GH. The sarcomere length-tension relation in skeletal muscle. J Gen Physiol. 1978;72:565–592. doi: 10.1085/jgp.72.4.565. [DOI] [PMC free article] [PubMed] [Google Scholar]
- 9.Walker SM, Schodt GR. I-segment lengths and thin filament periods in skeletal muscle fibers of the rhesus monkey and the human. Anat Rec. 1973;178:63–82. doi: 10.1002/ar.1091780107. [DOI] [PubMed] [Google Scholar]
- 10.Herzog W, Kamal S, Clarke HD. Myofilament lengths of cat skeletal muscle: theoretical considerations and functional implications. J Biomec. 1992;25:945–948. doi: 10.1016/0021-9290(92)90235-s. [DOI] [PubMed] [Google Scholar]
- 11.Baratta RV, Solomonow M. The dynamic response model of nine different skeletal muscles. IEEE Trans Biom Eng. 1990;37(3):243–251. doi: 10.1109/10.52326. [DOI] [PubMed] [Google Scholar]
- 12.Spector SA, Gardiner PF, Zernicke RF, Roy RR, Edgerton VR. Muscle architecture and force-velocity characteristics of cat soleus and medial gastrocnemius: implications for motor control. J Neurophysiol. 1980;44(5):951–960. doi: 10.1152/jn.1980.44.5.951. [DOI] [PubMed] [Google Scholar]
- 13.Woittiez RD, Huijing PA, Rozendal RH. Influence of muscle architecture on the length-force diagram of mammalian muscle. Pflugers Arch. 1983;399(4):275–279. doi: 10.1007/BF00652752. [DOI] [PubMed] [Google Scholar]
- 14.Narici MV, Binzoni T, Hiltbrand E, Fasel J, Terrier F, Cerretelli P. In vivo human gastrocnemius architecture with changing joint angle at rest and during graded isometric contraction. J Physiol. 1996;496(1):287–297. doi: 10.1113/jphysiol.1996.sp021685. [DOI] [PMC free article] [PubMed] [Google Scholar]
- 15.Herzog W, Leonard TR. Depression of cat soleus forces following isokinetic shortening. J Biomec. 1997;30(9):865–872. doi: 10.1016/s0021-9290(97)00046-8. [DOI] [PubMed] [Google Scholar]
- 16.Herzog W, Schachar R, Leonard TR. Characterization of the passive component of force enhancement following active stretching of skeletal muscle. J Exp Biol. 2003;206:3635–3643. doi: 10.1242/jeb.00645. [DOI] [PubMed] [Google Scholar]
- 17.Lieber RL, Yeh Y, Baskin RJ. Sarcomere length determination using laser diffraction. Effect of beam and fiber diameter. Biophys J. 1984;45(5):1007–1016. doi: 10.1016/S0006-3495(84)84246-0. [DOI] [PMC free article] [PubMed] [Google Scholar]
- 18.Butterfield T, Herzog W. The magnitude of muscle strain does not influence serial sarcomere number adaptations following eccentric exercise. Pflugers Arch- Eur J Physiol. 2006;451:688–700. doi: 10.1007/s00424-005-1503-6. [DOI] [PubMed] [Google Scholar]
- 19.Blix M. Die Lange und die Spannung des Muskels. Skand Arch Physiol. 1891;3:295–318. [Google Scholar]
- 20.Blix M. Die Lange und die Spannung des Muskels. Skand Arch Physiol. 1893;4:399–409. [Google Scholar]
- 21.Blix M. Die Lange und die Spannung des Muskels. Skand Arch Physiol. 1894;5:149–206. [Google Scholar]
- 22.Huxley AF, Niedergerke R. Structural changes in muscle during contraction. Nature. 1954;173:971–973. doi: 10.1038/173971a0. [DOI] [PubMed] [Google Scholar]
- 23.Huxley H, Hanson J. Changes in the cross-striations of muscle during contraction and stretch and their structural interpretation. Nature. 1954;173:973–976. doi: 10.1038/173973a0. [DOI] [PubMed] [Google Scholar]
- 24.Llewellyn ME, Barretto RPJ, Delp SL, Schnitzer MJ. Minimally invasive high-speed imaging of sarcomere contrac-tile dynamics in mice and humans. Nature. 2008;454:784–788. doi: 10.1038/nature07104. [DOI] [PMC free article] [PubMed] [Google Scholar]


