

Abstract
Receptor-mediated transcytosis across the blood–brain barrier (BBB) may be a useful way to transport therapeutics into the brain. Here we report that transferrin (Tf)-containing gold nanoparticles can reach the brain parenchyma from systemic administration in mice through a receptor-mediated transcytosis pathway. This transport is aided by tuning the nanoparticle avidity to Tf receptor (TfR), which is correlated with nanoparticle size and total amount of Tf decorating the nanoparticle surface. Nanoparticles of both 45 nm and 80 nm diameter reach the brain parenchyma, and their accumulation there (visualized by silver enhancement light microscopy in combination with transmission electron microscopy imaging) is observed to be dependent on Tf content (avidity); nanoparticles with large amounts of Tf remain strongly attached to brain endothelial cells, whereas those with less Tf are capable of both interacting with TfR on the luminal side of the BBB and detaching from TfR on the brain side of the BBB. The requirement of proper avidity for nanoparticles to reach the brain parenchyma is consistent with recent behavior observed with transcytosing antibodies that bind to TfR.
Effective delivery of therapeutics to the brain has remained elusive owing to many factors, including inadequate transport across the blood–brain barrier (BBB). Numerous multidisciplinary-based strategies for transporting therapeutic agents from the blood into the brain have been proposed (1), including the use of receptor-mediated transcytosis. Recently, Yu et al. (2) reported increased accumulation of antibodies to transferrin (Tf) receptor (TfR) in the brain parenchyma when the antibody affinity was reduced. In that work, antibodies with high TfR affinity bound strongly to and remained associated with TfRs in the BBB, whereas antibodies with lower TfR affinity allowed for their detachment from TfRs and subsequent release into the brain parenchyma. These results are consistent with a previous report of a low-affinity (nearly identical to Tf–TfR interaction strength) antibody that significantly accumulated in the brain parenchyma (3).
Targeted nanoparticles are finding applications for the delivery of a wide variety of therapeutic agents, and several have already reached the clinical testing stage in humans (4, 5). For example, in a Phase I clinical trial, a Tf-containing nanoparticle was used to deliver siRNA to cancer patients and shown to deliver functional siRNA to melanoma tumors in a dose-dependent manner (6). The results demonstrate that Tf-containing nanoparticles can be administered safely to humans.
It is well known that the avidity and receptor selectivity of targeted nanoparticles can be tuned by the choice of targeting ligand and its number density; multivalent nanoparticles can engage multiple cell surface receptors simultaneously (7, 8). When an individual targeting ligand is conjugated to a nanoparticle, the affinity of the ligand to the receptor is reduced. However, if the receptor density is such that multiple targeting ligands on the nanoparticle can bind to the receptors simultaneously, then the targeted nanoparticle avidity (9) and selectivity (8) can be increased. These effects have been illustrated in several investigations; for example, Choi et al. (9) reported the interactions of Tf-containing gold nanoparticles on both cancer cells in vitro and tumors in vivo in mice. These authors showed that the animal whole-body biodistribution of Tf-containing gold nanoparticles of ∼70 nm in diameter was independent of the Tf content, but that the amount of nanoparticles localizing in the cancer cells of solid tumors at 24 h after injection increased with increasing Tf content. Thus, the targeting ligand acts as a cell entrance facilitator rather than altering the biodistribution of the nanoparticles. This effect is now being reported for different types of targeted nanoparticles.
The objective of the present study was to investigate whether the BBB transcytosis behavior of targeted nanoparticles is similar to the BBB transcytosis behavior of antibodies in the sense that the avidity must be modulated appropriately to allow receptor binding from the blood, transcytosis across the BBB, and release from the receptor into the brain parenchyma. Our expectation was that the nanoparticles would need proper avidity, size and surface charge to effectively undergo BBB transcytosis. Our research group has been involved in translating two nanoparticles from the laboratory into clinical trials. These nanoparticles are smaller than 100 nm for many reasons, including their ability to move through tissues. Here we restricted our investigation to nanoparticles in this size range.
After our experimental studies were completed, another group reported that nanoparticles in the sub–100-nm range can in fact move through brain tissue, especially when they have near-neutral zeta potentials and are coated with a dense polyethylene glycol (PEG) layer (10). Moreover, nanoparticle zeta potentials that are slightly negative to near-neutral are desirable, given that highly negatively and positively charged nanoparticles are known to (i) disrupt the BBB (11), (ii) facilitate formation of protein coronas that may mask or alter the function of the targeting ligand (12), and (iii) illicit unwanted immune responses and more rapid blood clearance via increased uptake through the mononuclear phagocyte system (13). Thus, we restricted our nanoparticles to have near-neutral zeta potentials (<−15 mV, as measured in 1.5 mM KCl).
We found that Tf-containing gold nanoparticles can behave similarly to antibodies in terms of receptor binding and release at the BBB. That is, if the avidity of the nanoparticles is too low, they do not significantly bind to TfR from the blood, and if the avidity is too high, they are less available for release into the brain parenchyma. Only those nanoparticles with intermediate avidity are able to effectively transcytose and be released into the brain parenchyma.
Results
Targeted Nanoparticle Avidity Increases with Tf Amount.
Tf-containing gold nanoparticles were chosen as a model nanoparticle system to engage the TfR at the BBB. Human Tf has already been used as a targeting agent on nanoparticles in human clinical trials (6, 14), and it is a recognized ligand for the well-established TfR at the BBB. Human Tf that is fully loaded with iron (holo-Tf) binds strongly to TfRs (Kd = 1–10 nM) (15), and after vesicle acidification and iron release, the subsequent apo-Tf has a reduced binding strength to TfR (Kd > 700 nM) (15) at physiological pH. Mouse Tf was not used, for reasons discussed below.
We chose gold nanoparticles for this study owing to their ease of synthesis, surface modification through reactions with thiol groups, quantification by inductively coupled plasma–mass spectroscopy (ICP-MS), and imaging by transmission electron microscopy (TEM). In addition, gold nanoparticles are convenient for studies of the BBB because they can be visualized inside and outside the vasculature by light microscopy through silver enhancement. The silver enhancement of gold nanoparticles is a highly sensitive detection technique that has been used to detect zeptomolar concentrations of nanoparticles in immune assays (16). Silver enhancement also has been used to visualize gold nanoparticles in kidney and tumor sections through light microscopy (17, 18).
Tf was coupled to gold nanoparticles through an NHS-PEG5k-OPSS linker, where the N-hydroxysuccinimide (NHS) ester reacts with Tf through primary amines on lysine groups [the preferred method of PEG coupling to Tf (19)] and orthopyridyl disulfide (OPSS) reacts with gold surfaces through gold–thiol dative bonding (Fig. 1). Mono-PEGylated Tf was highly purified before coupling to the gold nanoparticles (SI Appendix, Fig. S1), because di-PEGylated Tf can cause a small degree of particle aggregation. Gold cores of increasing sizes (5 nm, 20 nm, and 50 nm) were reacted with increasing amounts of Tf-PEG5k-OPSS, after which methoxy-PEG5k-thiol (mPEG)-SH (PEGylation) was added to the nanoparticle surface to increase nanoparticle stability in high ionic solutions, such as blood. Attempts to use mouse Tf for nanoparticle assembly failed. For unknown reasons, mouse Tf does not appear to be as stable as human Tf for these types of physical and chemical manipulations.
Fig. 1.

Representation of the targeted nanoparticle assembly process (n ∼120; PEG molecular mass, 5,000 Da).
Nanoparticle sizes were measured with dynamic light scattering (DLS) and nanoparticle tracking analysis (NTA) technologies. NTA methods allow direct visualization of individual nanoparticles and can provide nanoparticle size distributions within a sample. All NTA sizes listed in Table 1 are from unimodal size distributions, indicating a single population of similarly sized nanoparticles. Unfortunately, the smaller-sized nanoparticles cannot be detected by this method. Given the unimodal NTA size distributions, DLS was used, with the sizes listed in Table 1. The nanoparticles measured by both NTA and DLS were essentially the same size. All of the nanoparticles synthesized had zeta potentials between −15 mV and −5 mV when measured in 1.5 mM KCl (Table 1). Zeta potential distributions were measured for the ∼80-nm nanoparticles using NTA methods. The FWHM values obtained from the zeta potential distributions did not vary with Tf content. These data are consistent with a similar Poisson-type distribution of Tf over the nanoparticle population for each formulation.
Table 1.
Nanoparticle formulations and characterizations
| Formulations (core + Tf) | Tf from 64Cu experiment | Nanoparticle diameter, DLS, nm | Nanoparticle diameter, NTA, nm | Zeta potential in KCl, mV | Kd, nM |
| 5 nm + mPEG | 0 | 21.6 ± 0.2 | ND | −11.4 ± 1.3 | — |
| 5 nm + 3 Tf | 3.2 | 21.0 ± 2.5 | ND | −12.9 ± 0.3 | 4.9 |
| 5 nm + 6 Tf | 4.6 | 25.3 ± 2.5 | ND | −10.0 ± 1.9 | 3.1 |
| 20 nm + mPEG | 0 | 46.1 ± 2.7 | ND | −8.3 ± 0.8 | — |
| 20 nm + 10 Tf | 7.4 | 44.6 ± 3.2 | ND | −14.4 ± 2.2 | 1.7 |
| 20 nm + 20 Tf | 9.5 | 43.6 ± 4.6 | ND | −6.8 ± 0.4 | 1.5 |
| 20 nm + 30 Tf | ND | 48.3 ± 2.9 | ND | −14.1 ± 1.4 | 0.71 |
| 20 nm + 100 Tf | 49.9 | 46.3 ± 1.3 | ND | −10.2 ± 2.3 | 0.018 |
| 50 nm + mPEG | 0 | 78.8 ± 3.1 | 72.0 ± 1.7 | −5.7 ± 1.1 | — |
| 50 nm + 20 Tf | ND | 78.1 ± 2.8 | 69.7 ± 2.3 | −5.3 ± 2.0 | 0.89 |
| 50 nm + 200 Tf | 107.3 | 85.4 ± 2.9 | 73.3 ± 2.1 | −6.3 ± 0.4 | 0.014 |
ND, not determined. All reported errors are SDs calculated from three measurements on the same sample.
Tf content on the nanoparticles was directly measured by (i) apo-Tf-PEG-OPSS chelation of 64Cu, (ii) nanoparticle formulation with 64Cu-Tf-PEG-OPSS, and (iii) measurement of nanoparticle-associated gamma activity [Cu chelation method, modified from a previously reported method (20)]. The average Tf content of some of the nanoparticle formulations are listed in Table 1. The nanoparticle formulations included a wide range of Tf contents on the nanoparticle surfaces. Each nanoparticle size had a formulation with very little Tf, as well as a formulation approaching the maximum number of possible Tf molecules on each particle. The theoretical maximum density of Tf on the surface of the nanoparticle was estimated based on the total surface area of the particle (from the surface area of a sphere) and the estimated surface coverage of each Tf molecule [hydrodynamic radius, ∼4 nm per Tf (21)]. Note that as the attempted loading of Tf increased (first column of Table 1), the fraction of Tf actually on the nanoparticles decreased, most likely owing to steric crowding.
More critical than the precise Tf content in each nanoparticle formulation is nanoparticle avidity and how it changes with Tf content. Yu et al. (2) performed competitive binding assays with mouse TfR to provide a relative ranking of the antibodies used in their study, and Friden et al. (3) used purified human TfR and the human K562 cell line to measure Tf and antibody binding. Here, to provide a relative ranking of nanoparticle avidity, we obtained binding isotherms using Neuro2A cells as a model cell type with mouse TfR (SI Appendix, Fig. S2; Kd values listed in Table 1). We found that Kd value had an inverse relationship with Tf content (Fig. 2A), and there was a clear increase in avidity with Tf content for each nanoparticle size tested (Fig. 2B). Within the limited number of nanoparticles used in this study, we detected an apparent weak effect of size on avidity (Fig. 2B). Previous studies that included much smaller nanoparticle sizes similarly reported that increasing the size and antibody content of antibody-coated nanoparticles increased the nanoparticles’ avidity to cell surface receptors (22).
Fig. 2.
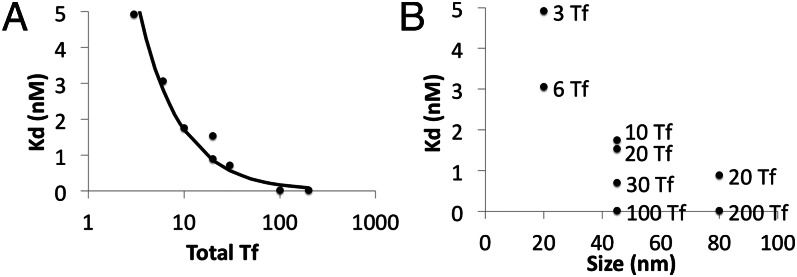
Binding data of gold nanoparticle formulations on Neuro2A cells. (A) Effects of nanoparticle Tf content on Kd of the nanoparticle to Neuro2A TfRs. (B) Effects of nanoparticle size and Tf content on Kd of the nanoparticle to Neuro2A TfRs.
Accumulation of Targeted Nanoparticles in Brain Parenchyma Is Dependent on Tf Amount.
The nanoparticle formulations listed in Table 1 were administered to mice by lateral tail vein injection. One mouse each was injected with the formulations of the ∼20-nm nanoparticles. Based on tissue analyses in these mice, we decided not to inject additional mice with these formulations, because the resulting images were conclusively negligible relative to the images obtained from the ∼45-nm and 80-nm nanoparticle-treated mice. Three mice each were injected with the 45-nm and 80-nm formulations, and at 8 h postinjection the brains were resected and processed for silver-enhanced imaging.
Nanoparticles in the parenchyma of each image were quantified, and the data were compiled into boxplots (Fig. 3A). These data illustrate how nanoparticle accumulation in the brain parenchyma was affected by both nanoparticle size and Tf content. Nanoparticles in the 45-nm and 80-nm size range were observed in the brain parenchyma, and statistically significant maximum levels were obtained with the formulations studied for both sizes. Neither nanoparticles of ∼20 nm nor formulations with mPEG-only were clearly seen in the parenchyma.
Fig. 3.

Quantitative studies of gold nanoparticles in the brain. (A) Quantitation of the nanoparticles observed in the brain parenchyma by silver enhancement after tail vein injection (n = 3 for 45-nm and 80-nm formulations; n = 1 for 20-nm formulations). (B) Quantitation of 80-nm formulations in the blood vessels by silver enhancement. P values of A and B were calculated from nonnormal distributions using the Mann–Whitney U test (Wilcoxon rank-sum test) of compiled data from all mice investigated in each nanoparticle formulation. (C) ICP-MS data of bulk brain gold content from the 80-nm formulations. mPEG: n = 2; 20 Tf and 200 Tf: n = 3. Error bars indicate SE.
In some regions of a few tissue sections, silver enhancement deposited in patterns that we classified as not specific to nanoparticles. Moreover, several areas with silver enhancement characteristic of nanoparticles were classified as not related to receptor- mediated transcytosis (SI Appendix, Fig. S3). We documented these events, but did not include them in our quantitative analysis. One brain from a mouse not injected with nanoparticles was stained with hematoxylin and silver enhancement solution, and some background signal due to silver enhancement was detected (SI Appendix, Fig. S4). These nonspecific events related to silver enhancement are clearly distinguishable from signals in the parenchyma due to gold nanoparticles.
Fig. 4 presents representative images from some of the formulations studied. Full, unmagnified images are provided in SI Appendix, Figs. S5–S7. Vessel staining is clearest in the images of the ∼20-nm nanoparticles that remained largely in the vasculature (vessels stained black, with a lack of clearly visible nanoparticles outside the vasculature). The images of the 45-nm, 30-Tf and 80-nm, 20-Tf formulations are representative of the majority of images obtained with clear nanoparticle signal in the parenchyma. The arrow in the 80-nm, 200-Tf image points to a nanoparticle that is out of focus. Within the 5-μm tissue sections, it was impossible to consistently obtain images in which all nanoparticles were in focus. These out-of-focus nanoparticles were also included in the quantitative analysis.
Fig. 4.

Sample images from hematoxylin-stained and silver-enhanced brain sections. Shown are images from a range of nanoparticle formulations injected systemically with brains resected and processed 8 h later. Black arrows accentuate clearly visible nanoparticles. (Left) 20-nm nanoparticles with 6 Tf, 3 Tf, and 0 Tf (from top to bottom). (Center) 45-nm nanoparticles with 100 Tf, 30 Tf, and 10 Tf. (Right) 80-nm nanoparticles with 200 Tf, 20 Tf, and 0 Tf.
High Tf Content Nanoparticles Have Increased Association with Brain Endothelial Cells.
High binding avidity with high nanoparticle Tf content reduced the parenchymal accumulation of the 45-nm and 80-nm nanoparticles (Table 1 and Figs. 2, 3, and 4). Additionally, high-avidity 80-nm nanoparticles (with 200 Tf) were consistently associated with the blood vessels to a greater degree than the untargeted 80-nm nanoparticles. To quantify this phenomenon, at 8 h postinjection we homogenized two brains containing mPEG-only nanoparticles and three brains each of the 80-nm nanoparticles containing 20 Tf and 200 Tf, and measured the total brain gold content by ICP-MS (Fig. 3C). The 80-nm nanoparticle silver enhancement signal appeared to be discrete in the blood vessels (unlike the continuous signal of the 20-nm and 45-nm nanoparticles in the vessels). We quantified this vessel-associated nanoparticle signal for each 80-nm formulation (Fig. 3B).
Consistent with the vessel-associated nanoparticle content quantified from the images, more gold was detected in the bulk brain (vessels and parenchyma) with higher nanoparticle Tf content by ICP-MS. The combined vessel analysis, ICP-MS analysis, and parenchymal quantitative imaging analysis found that more 80-nm nanoparticles remained in the bulk of the brain with increasing Tf, not because they entered the brain parenchyma, but because they were largely stuck in or on the endothelial cells of the vasculature.
TEM Images Show That Nanoparticles Undergo Receptor-Mediated Transcytosis and Are Present in Brain Parenchyma.
Because the 80-nm nanoparticle formulations showed the greatest accumulation in the brains, we subjected these nanoparticles to additional TEM analysis (Fig. 5). All sample images were obtained from the cerebral cortex. No untargeted 80-nm nanoparticles were found in the endothelial cells or brain parenchyma after several hours of imaging, although they were detected in the vessel lumen, consistent with the light microscopy data. Nanoparticles with low (20 Tf/nanoparticle) and high (200 Tf/nanoparticle) Tf content were observed in endothelial cells, as well as in the parenchyma (Fig. 5 A–D). Nanoparticles were detected inside endothelial cell vesicles (e.g., Fig. 5B), suggesting a transcellular route of delivery to the brain parenchyma. Untargeted nanoparticles were not observed inside endothelial cells, and all 80-nm formulations had similar zeta potentials, suggesting that the Tf-coated nanoparticles entered into the endothelial cells via a TfR-mediated process. The reduced quality of tissue microstructures in these images can be attributed to the tissue processing to allow detection of extracellular nanoparticles (CO2 asphyxiation followed by brain resection and immediate submersion in formalin solution). Higher-quality cellular microstructures are preserved with a perfusion fixation technique (Fig. 5 E–I).
Fig. 5.

TEM images of gold nanoparticles in the brain. Mi, mitochondria; Lu, lumen; En, endothelial cell; Pa, parenchyma; EC, endothelial cleft; NP, nanoparticle; Gly, glycocalyx. (A) 80- nm, 20-Tf nanoparticle in the parenchyma. (B) 80-nm, 20-Tf nanoparticle inside a vesicle of a BBB endothelial cell. (C) 80-nm, 200-Tf nanoparticles in the parenchyma. (D) 80-nm, 200-Tf nanoparticle near the basal surface of an endothelial cell. (E) Perfusion fixation with lanthanum nitrate showing lanthanum penetrating the interendothelial cleft with no subendothelial staining. (F and G) Injection of 80-nm particles, followed by perfusion fixation at 8 h postinjection. Neither the 20-Tf/Au formulation (F) nor the 200-Tf/Au formulation (G) degrades the BBB tight junctions to lanthanum nitrate; the same interendothelial cleft penetration with no subendothelial staining is seen. (H) 80-nm, 200-Tf particle inside and near the apical surface of the endothelial cell. (Note that the lanthanum nitrate-stained glycocalyx separated from the cell surface owing to the electron beam during imaging.) (I) 80-nm, 200-Tf particle found within the brain parenchyma after perfusion fixation.
Nanoparticle-associated toxicity has been suggested to degrade the BBB (11), which may be a factor contributing to nanoparticle access to the brain parenchyma. Cardiac perfusion-fixation with a solution of fixative containing the BBB-impermeable TEM contrast agent lanthanum nitrate has been previously used to ensure BBB integrity (23). Each 80-nm nanoparticle formulation was injected, and cardiac-perfusion fixation was performed at 8 h postinjection. In all three brains, lanthanum remained exclusively within the vasculature (strongly staining glycocalyx on the surface of the endothelial cells with partial interendothelial cleft staining), and no subendothelial staining was seen (e.g., Fig. 5 F and G). In addition, no nanoparticles were observed in the lumen of the vessels after vascular perfusion, although Tf-coated nanoparticles were again localized in the endothelial cells and parenchyma (Fig. 5 H and I). Thus, the BBB remained intact and was not permeabilized to large ions after exposure to the 80-nm gold nanoparticle formulations. An intact BBB that allows only Tf-associated nanoparticles to reach the parenchyma demonstrates that the Tf-targeted nanoparticles reach the brain through a receptor-mediated transcytosis pathway.
Discussion
PEGylated nanoparticles in the sub–100-nm diameter size range are known to be able to move through brain tissue (10), and our findings show that sub–100-nm nanoparticles that have near-neutral zeta potentials and contain a PEG coating with protein ligands can spread through the brain tissue. Thus, if these nanoparticles can transcytose across the intact BBB, they may be useful for delivering a broad spectrum of therapeutic and imaging agents. Of major importance is the finding that the nanoparticles do reach the brain parenchyma, and that they do so without damaging the BBB. Motivated by the results of Yu et al. (2), and by the fact that the avidity of nanoparticles can be altered by targeting ligand choice and number density, we prepared a series of targeted nanoparticles with a range of avidities for TfR. Assessment of avidity for TfR on Neuro2A cells showed that avidity was affected by both nanoparticle size and the total number of Tf molecules decorated on the nanoparticle surface. We investigated this set of targeted nanoparticles for their ability to interact with and transcytose across the BBB in mice. Our results show that nanoparticle avidity plays a significant role in the transcytosis behavior. Nanoparticles with the highest avidities were bound to the BBB, but demonstrated reduced accumulation in the brain parenchyma relative to nanoparticles with reduced avidity. When the avidity was too low, nanoparticles did not engage the BBB.
The need for a specific avidity to allow transcytosis of targeted nanoparticles is consistent with behavior observed in transcytosing antibodies to TfR (2). Nanoparticles with high avidity can have similar Kd values as typical antibodies, and much like high-affinity antibodies, these nanoparticles engage the BBB but do not enter the brain parenchyma in appreciable amounts. Nanoparticles of lesser avidity were able to reach the brain parenchyma, most likely owing to the release of the nanoparticles on transcytosis. When the avidity was too low, nanoparticles in circulation did not engage TfRs on the BBB, probably because they were outcompeted by the inherent mouse Tf in blood for the available TfRs. These results show that targeted nanoparticles can be prepared and their avidity tuned to allow for transcytosis across the BBB. The avidity, along with nanoparticle size and surface charge, need to be controlled to allow the transcytosis of intact nanoparticles across the BBB without changing the properties of the BBB. We are exploring these nanoparticle design rules in an effort to prepare targeted nanoparticles with therapeutic agents.
Materials and Methods
Complete details of the materials and methods used in this study are provided in SI Appendix.
Tf-PEG-OPSS Synthesis.
Human holo-Tf was reacted with NHS-PEG-OPSS to form Tf-PEG-OPSS. A pure monoPEGylated fraction of Tf was obtained after HPLC separation, followed by hydrophobic interaction chromatography separation. After the separation steps, Tf was reloaded with iron via incubation in iron citrate with 100 mM sodium bicarbonate.
Au-PEG-Tf Synthesis.
Gold nanoparticles of increasing size (5 nm, 20 nm, and 50 nm) were stirred with the appropriate molar excess of Tf-PEG-OPSS (e.g., 10 mol excess Tf added to gold for a 10-Tf/particle formulation) for 90 min, followed by the addition of an excess amount of mPEG-SH for an additional 90 min. The gold particles were pelleted by centrifugation, and unbound PEG was removed with the supernatant. The particles were resuspended in water and then sonicated for 10 min. The washing procedure was repeated twice.
DLS.
Particle sizes and zeta potentials were measured with a Brookhaven Instruments ZetaPALS. Reported values were averaged from three runs at a target residual of 0.02. Measurements are reported as average ± 1 SD.
NTA.
NTA measurements were performed with a NanoSight NS500 instrument. The data are reported as the mode of the size distribution with 1 SD of three runs on the same sample.
Nanoparticle Cell Binding Assay.
Fixed Neuro2A cells in suspension were incubated with increasing concentrations of gold nanoparticles for 90 min, with mixing every 15 min to avoid settling. The cells were then washed three times with PBS to remove unbound gold, treated with silver enhancement solution, and assessed for gold content in a 96-well plate reader (Tecan Infinite M200; excitation, 310 nm; emission, 400 nm). The data were fit to a Langmuir binding isotherm, with Bmax and Kd fit nonlinearly with MATLAB nlinfit (MathWorks).
Nanoparticle Tf Content.
apo-Tf-PEG-OPSS was incubated with 4 mCi of 64Cu in 50 mM bicarbonate for 90 min. Unbound 64Cu was separated from Tf-PEG-OPSS with a Micro Bio-Spin column (Bio-Rad). After formulation of the gold nanoparticles with 64Cu-Tf-PEG-OPSS, the nanoparticles were pelleted by centrifugation, and unbound 64Cu-Tf-PEG-OPSS was removed with the supernatant. The nanoparticles were sonicated and washed with 1.5 mL of water. Gamma activities of each particle formulation were counted with a Wizard gamma counter (PerkinElmer), and a standard curve was used to determine the Tf content of the nanoparticle population.
Animal Studies.
Female BALB/c mice (Jackson Laboratory) received i.v. doses of nanoparticles in 150 μL of PBS through the lateral tail vein. Injected doses were as follows: 20-nm gold, 5 × 10¹³ nanoparticles/mouse; 45-nm gold, 2.9 × 10¹² nanoparticles/mouse; 80-nm gold, 4.5 × 10¹¹ nanoparticles/mouse. At 8 h postinjection, the brains were resected and placed in 4% paraformaldehyde for further analysis. For TEM perfusion fixation analysis, the right atrium was clipped, and the left ventricle was perfused with 10% sucrose, followed by the fixative (4% paraformaldehyde, 0.05% glutaraldehyde, and 5% lanthanum nitrate in 100 mM sodium cacodylate buffer; pH 7.2). After perfusion, the brains were resected and placed in 4% paraformaldehyde for further analysis.
TEM.
Osmium-stained and epoxy-embedded brains were sectioned, further stained with uranyl acetate and lead citrate, and imaged with a 80-kV Technai TF30UT transmission electron microscope (FEI).
Light Microscopy.
Paraffin-embedded brains were sectioned, deparaffinized, and treated with silver enhancement solution (Ted Pella). Tissue sections were counterstained with hematoxylin and imaged on an Olympus IX50 microscope with a 40× objective using QCapture Pro imaging software (QImaging).
Image Analysis, Particle Counting, and Statistics.
A total of 40 images were obtained of each tissue section, with images throughout four regions of the brain (10 images per region): rostral, dorsal, and ventral regions, and cerebellum. Nanoparticles visualized in the parenchyma and 80-nm nanoparticles visualized in the vessels were manually counted, and the data were binned in MATLAB. Pairwise comparison groups (e.g., 80 nm 20 Tf vs. 80 nm 200 Tf) of the nonnormal distributions were analyzed for statistically significant differences using the Mann–Whitney U test (Wilcoxon rank-sum test) and P values reported in Fig. 3.
ICP-MS.
Brains were microwaved in aqua regia (70% HNO3 and 30% HCl in a 3:1 volume ratio) until they were fully homogenized. After 20.5 mL of deionized water was added, the sample was centrifuged at 3,200 × g for 15 min to remove cell debris. The supernatant was analyzed for gold content with an Agilent HP 4500 ICP-MS system. Reported values are expressed as percentage of injected dose per gram of brain tissue. Error bars represent the SE from the measurements obtained from each group of mice.
Supplementary Material
Acknowledgments
We thank Nathan Delleska (Caltech Environmental Analysis Center) for allowing access to the ICP-MS facilities, Debbie Guerrero (House Research Institute Advanced Imaging Center) for her help in establishing the transmission electron microscopy tissue processing protocol, Jeff Collins and David Stout (University of California Los Angeles Crump Institute for Molecular Imaging) for the use of their facilities and time with the 64Cu-based quantitative studies, and Professor Towhid Salam (University of Southern California Keck School of Medicine) for his help with the statistical analyses. This work was supported by National Institutes of Health Grant R01 NS071112.
Footnotes
The authors declare no conflict of interest.
This article contains supporting information online at www.pnas.org/lookup/suppl/doi:10.1073/pnas.1307152110/-/DCSupplemental.
References
- 1.Neuwelt E, et al. Strategies to advance translational research into brain barriers. Lancet Neurol. 2008;7(1):84–96. doi: 10.1016/S1474-4422(07)70326-5. [DOI] [PubMed] [Google Scholar]
- 2.Yu YJ, et al. Boosting brain uptake of a therapeutic antibody by reducing its affinity for a transcytosis target. Sci Transl Med. 2011;3(84):84ra44. doi: 10.1126/scitranslmed.3002230. [DOI] [PubMed] [Google Scholar]
- 3.Friden PM, Olson TS, Obar R, Walus LR, Putney SD. Characterization, receptor mapping and blood-brain barrier transcytosis of antibodies to the human transferrin receptor. J Pharmacol Exp Ther. 1996;278(3):1491–1498. [PubMed] [Google Scholar]
- 4.Davis ME, Chen ZG, Shin DM. Nanoparticle therapeutics: An emerging treatment modality for cancer. Nat Rev Drug Discov. 2008;7(9):771–782. doi: 10.1038/nrd2614. [DOI] [PubMed] [Google Scholar]
- 5.Kamaly N, Xiao Z, Valencia PM, Radovic-Moreno AF, Farokhzad OC. Targeted polymeric therapeutic nanoparticles: Design, development and clinical translation. Chem Soc Rev. 2012;41(7):2971–3010. doi: 10.1039/c2cs15344k. [DOI] [PMC free article] [PubMed] [Google Scholar]
- 6.Davis ME, et al. Evidence of RNAi in humans from systemically administered siRNA via targeted nanoparticles. Nature. 2010;464(7291):1067–1070. doi: 10.1038/nature08956. [DOI] [PMC free article] [PubMed] [Google Scholar]
- 7.Montet X, Funovics M, Montet-Abou K, Weissleder R, Josephson L. Multivalent effects of RGD peptides obtained by nanoparticle display. J Med Chem. 2006;49(20):6087–6093. doi: 10.1021/jm060515m. [DOI] [PubMed] [Google Scholar]
- 8.Martinez-Veracoechea FJ, Frenkel D. Designing super selectivity in multivalent nano-particle binding. Proc Natl Acad Sci USA. 2011;108(27):10963–10968. doi: 10.1073/pnas.1105351108. [DOI] [PMC free article] [PubMed] [Google Scholar]
- 9.Choi CHJ, Alabi CA, Webster P, Davis ME. Mechanism of active targeting in solid tumors with transferrin-containing gold nanoparticles. Proc Natl Acad Sci USA. 2010;107(3):1235–1240. doi: 10.1073/pnas.0914140107. [DOI] [PMC free article] [PubMed] [Google Scholar]
- 10.Nance EA, et al. A dense poly(ethylene glycol) coating improves penetration of large polymeric nanoparticles within brain tissue. Sci Transl Med. 2012;4(149):149ra119. doi: 10.1126/scitranslmed.3003594. [DOI] [PMC free article] [PubMed] [Google Scholar]
- 11.Lockman PR, Koziara JM, Mumper RJ, Allen DD. Nanoparticle surface charges alter blood-brain barrier integrity and permeability. J Drug Target. 2004;12(9-10):635–641. doi: 10.1080/10611860400015936. [DOI] [PubMed] [Google Scholar]
- 12.Lundqvist M, et al. Nanoparticle size and surface properties determine the protein corona with possible implications for biological impacts. Proc Natl Acad Sci USA. 2008;105(38):14265–14270. doi: 10.1073/pnas.0805135105. [DOI] [PMC free article] [PubMed] [Google Scholar]
- 13.Xiao K, et al. The effect of surface charge on in vivo biodistribution of PEG-oligocholic acid based micellar nanoparticles. Biomaterials. 2011;32(13):3435–3446. doi: 10.1016/j.biomaterials.2011.01.021. [DOI] [PMC free article] [PubMed] [Google Scholar]
- 14.Davis ME. The first targeted delivery of siRNA in humans via a self-assembling, cyclodextrin polymer-based nanoparticle: From concept to clinic. Mol Pharm. 2009;6(3):659–668. doi: 10.1021/mp900015y. [DOI] [PubMed] [Google Scholar]
- 15.Dautry-Varsat A, Ciechanover A, Lodish HF. pH and the recycling of transferrin during receptor-mediated endocytosis. Proc Natl Acad Sci USA. 1983;80(8):2258–2262. doi: 10.1073/pnas.80.8.2258. [DOI] [PMC free article] [PubMed] [Google Scholar]
- 16.Hou SY, Chen HK, Cheng HC, Huang CY. Development of zeptomole and attomolar detection sensitivity of biotin-peptide using a dot-blot gold nanoparticle immunoassay. Anal Chem. 2007;79(3):980–985. doi: 10.1021/ac061507g. [DOI] [PubMed] [Google Scholar]
- 17.Choi CHJ, Zuckerman JE, Webster P, Davis ME. Targeting kidney mesangium by nanoparticles of defined size. Proc Natl Acad Sci USA. 2011;108(16):6656–6661. doi: 10.1073/pnas.1103573108. [DOI] [PMC free article] [PubMed] [Google Scholar]
- 18.Perrault SD, Walkey C, Jennings T, Fischer HC, Chan WCW. Mediating tumor targeting efficiency of nanoparticles through design. Nano Lett. 2009;9(5):1909–1915. doi: 10.1021/nl900031y. [DOI] [PubMed] [Google Scholar]
- 19.Bellocq NC, Pun SH, Jensen GS, Davis ME. Transferrin-containing, cyclodextrin polymer-based particles for tumor-targeted gene delivery. Bioconjug Chem. 2003;14(6):1122–1132. doi: 10.1021/bc034125f. [DOI] [PubMed] [Google Scholar]
- 20.Mangani S, Messori L. EXAFS studies on copper transferrin. J Inorg Biochem. 1992;48:33–40. [Google Scholar]
- 21.Armstrong JK, Wenby RB, Meiselman HJ, Fisher TC. The hydrodynamic radii of macromolecules and their effect on red blood cell aggregation. Biophys J. 2004;87(6):4259–4270. doi: 10.1529/biophysj.104.047746. [DOI] [PMC free article] [PubMed] [Google Scholar]
- 22.Jiang W, Kim BYS, Rutka JT, Chan WCW. Nanoparticle-mediated cellular response is size-dependent. Nat Nanotechnol. 2008;3(3):145–150. doi: 10.1038/nnano.2008.30. [DOI] [PubMed] [Google Scholar]
- 23.Wolburg H, et al. Epithelial and endothelial barriers in the olfactory region of the nasal cavity of the rat. Histochem Cell Biol. 2008;130(1):127–140. doi: 10.1007/s00418-008-0410-2. [DOI] [PubMed] [Google Scholar]
Associated Data
This section collects any data citations, data availability statements, or supplementary materials included in this article.