Abstract
Next Generation Sequencing (NGS) has revolutionized biomedical research in recent years. It is now commonly used to identify rare variants through re-sequencing individual genomes. Due to the cost of NGS, researchers have considered pooling samples as a cost-effective alternative to individual sequencing. In this article, we consider the estimation of allele frequencies of rare variants through the NGS technologies with pooled DNA samples with or without barcodes. We consider three methods for estimating allele frequencies from such data, including raw sequencing counts, inferred genotypes, and expected minor allele counts and compare their performance. Our simulation results suggest that the estimator based on inferred genotypes overall performs better than or as well as the other two estimators. When the sequencing coverage is low, biases and MSEs can be sensitive to the choice of the prior probabilities of genotypes for the estimators based on inferred genotypes and expected minor allele counts so that more accurate specification of prior probabilities is critical to lower biases and MSEs. Our study shows that the optimal number of barcodes in a pool is relatively robust to the frequencies of rare variants at a specific coverage depth. We provide general guidelines on using DNA pooling with barcoding for the estimation of allele frequencies of rare variants.
1 Introduction
Much attention has been paid to the identification of rare variants (MAF < 1–5%) under the common disease rare variant (CDRV) assumption which states that many common human diseases may be caused by multiple rare genetic variants. This is partly driven by the advances in the Next-Generation Sequencing (NGS) technologies (See Mardis [2008] for a review) that enable researchers to discover novel/rare variants in the genome scale. The 1000 Genomes Project, an international research consortium, aims to sequence the genomes of over 1000 individuals of different ethnic groups. This is further motivated by the many successful examples of the application of NGS technologies to identify numerous disease-related variants [e.g. Ng et al., 2010; Li et al., 2010; Choi et al., 2011; O’Roak et al., 2011].
In the study of rare variants, thousands of genomes need to be sequenced to identify and characterize these variants due to their rarity. Even though the sequencing cost has plummeted for the last few years, large-scale whole genome or exome sequencing is still expensive and time-consuming. Consequently, DNA pooling has been considered as a cost-effective alternative to more efficiently employ the NGS technologies to identify and characterize rare variants. To address the analysis needs of pooled sequence data, several statistical methods have been developed to use DNA pooling for the detection of rare variants and their disease associations [Kim et al., 2010; Wang et al., 2010; Bansal, 2010; Lee et al., 2011]. However, one main limitation of pooled DNA sequencing analysis is the inability to extract individual-level information such as genotypes for each DNA sample in the pool. To overcome this limitation, a number of barcoding procedures have been developed where each DNA sample is labeled with a distinct barcode [Meyer et al., 2007; Craig et al., 2008]. More recently, Kozarewa and Turner [2011] developed a new barcoding method which allows multiplexing of 96 or more samples per lane for Illumina library preparation. Pooling coupled with barcoding, therefore, offers an attractive strategy for pooled DNA analysis. However, the issue of optimal number of barcodes in a pool has not been investigated in the literature. This is because the sequence coverage per barcode is roughly equal to the ratio between the total number of sequence reads from the pool and the number of barcodes. As sequencing technologies advance, the number of reads from a single sequencing lane will continue to increase. Therefore, the number of reads per barcode will continue to increase on average as well. However, the added statistical power of novel variant detection may diminish as more reads are obtained from each individual DNA sample. As a result, a good balance needs to be achieved between the number of reads per barcode on average and the number of individual DNA samples to be sequenced (or equivalently barcodes).
In our previous work [Lee et al., 2011], we considered study designs for the detection of rare variants through DNA pooling. One of the main motivations for detecting rare variants is to study the relevance of these rare variants to disease risk. A typical analysis of these variants would involve comparing the allele frequencies of these variants between disease cases and normal controls [Kim et al., 2010; Wang et al., 2010]. Therefore, it is critical to obtain accurate allele frequency estimates, especially for rare variants. In this paper we examine frequency estimates for rare variants through DNA pooling with the possibility of barcoding individual samples. In particular, we investigate the balance issue we mentioned above for the purpose of allele frequency estimation.
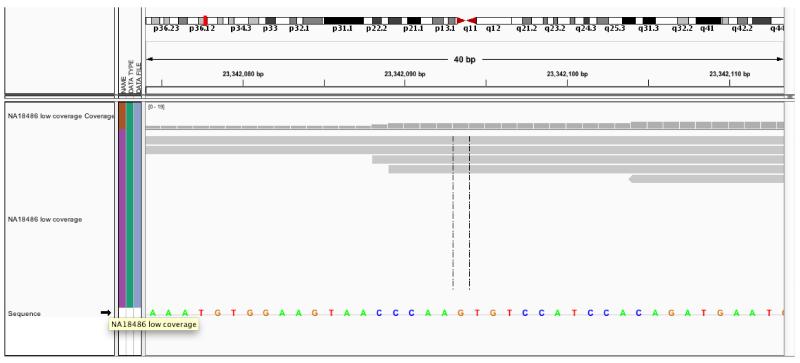
To generate next-generation sequencing data, DNA samples need to be fragmented first. Throughout several technical steps including image processing, millions of short-reads sequences are generated. The length of those short-reads sequence is sequencing-platform specific. For example, the maximum short-read length for Illumina Hi-Seq 2000 is 2×100bp. Then those short-read sequences are mapped and aligned against a reference genome as shown in Figure 1. At heterozygous sites where the non-reference allele frequency is 50%, about 50% of mapped short-reads are expect to contain a reference allele whereas from the other reads, a variant is expected to be found. It illustrates the possibility of estimating allele frequencies by means of next-generation sequencing.
Figure 1.
Short-read Alignment: Visualization of Sequence Short-reads (Gray Horizontal Line Segments) Mapped to the Reference Genome (Sequence of Nucleotide Bases in Color at the Bottom) by Integrative Genomics Viewer (IGV).
Currently several approaches have been proposed for the allele frequency estimation from next-generation sequencing. Most of these methods belong to either of the following approaches. The first approach infers genotypes with the most likely genotype among all possibilities first [Li et al., 2008, 2009] and estimates allele frequencies based on those inferred genotypes. In this approach, the genotyping accuracy may affect the estimation of allele frequencies to varying extent. Particularly, in the case of low-coverage sequencing, the confidence of genotype calls can be lower when solely based on the maximum likelihood. As a result, it is recommended to use a threshold for the log-likelihood ratio of the two highest likelihood. The second approach utilizes the NGS data directly without any genotype inferences. Lynch [2009] and Kim et al. [2010] proposed a maximum-likelihood (ML) based method by using observed sequence base counts. One main advantage of these methods is that they perform better than methods based on inferred genotypes at a depth of coverage no more than 6×. However, there seems to be no benefit from using this method at the depth of coverage equal to 12× or higher [Kim et al., 2011]. In consideration of barcoding, exome or targeted sequencing are more suitable in our analysis. Thus the overall depth of coverage for those sequencing strategies are modest or high. In addition, this maximum likelihood estimate is calculated by the use of an optimization method such as the expectation-maximization (EM) algorithm so that it may be computationally less efficient than the methods based on inferred genotypes. As a result, an ML-based method is not considered in our analysis.
The first approach requires SNP genotyping. For SNP genotype calling, the prior probability of observing a heterozygote P(G = Aa) = r needs to be specified. For the novel SNP discovery, r = 0.001 (the heterozygous rate) is used by many existing SNP genotyping methods including MAQ and UnifiedGenotyper in GATK [Li et al., 2008; McKenna et al., 2010], whereas for known SNP sites such as those in dbSNP, MAQ suggests using r = 0.2. Since the estimation of allele frequencies follows the discovery of novel SNPs, we chose to use r = 0.2 rather than r = 0.001 in this analysis. The choice of r = 0.2 seems to be arbitrary. Currently, a limitation of those genotyping methods is to specify the prior probability r before running those methods. Therefore, we would like to investigate how the mis-specification of the prior distribution affect the estimation of allele frequencies. In addition, we also consider the empirical estimation of r by jointly analyzing sequencing bases across pooled samples in a given study. We will discuss it in more detail later. As an alternative, we may utilize population-level frequency estimates from the 1000 Genomes Project browser (http://browser.1000genomes.org/) or NHLBI Exome Variant Server (http://evs.gs.washington.edu/EVS/).
This paper is organized as follows. We first describe how to estimate allele frequencies with or without the use of barcoding information. We then evaluate and compare the performance of several allele frequency estimation procedures. The technical details are provided in the Appendix.
2 Methods
2.1 Estimation of Allele Frequencies
Suppose that a pooled DNA sample l is constructed by tagging each of B individual DNA samples with a distinct barcode and pooling sequencing libraries from those B sets of DNA samples. As a result, individual sequencing data can be determined using barcode information after sequencing the pooled sample. For a genomic location of our interest, let Clb and Xlb denote the sequencing coverage and the number of sequencing reads harboring a rare allele with barcode b in pooled sample l. Let Cl denote the total sequencing coverage for the pooled sample l, i.e. .
Here we consider three methods to estimate the minor allele frequencies (MAFs) that are based on (1) raw base counts, (2) inferred genotypes, and (3) expected minor allele counts, respectively. Among the three estimators, the simplest one is to directly utilize raw sequencing base counts with a weight. The weight is assigned to each individual sample according to the proportion of the coverage depths Clb for an individual sample with barcode b among the total coverage depth Cl for the pooled sample l containing the individual sample. The corresponding estimator is defined as
| (1) |
where . Note that this estimator amounts to sequencing a pooled sample without barcoding. In this sense we can examine the benefit of using barcode information by comparing this estimator with the others with respect to MAF estimation accuracy. The second and third estimators require the calculations of the posterior probabilities of the three possible genotypes, , Aa, or aa where A(a) denotes a major(minor) allele, for an individual sample with barcode b in the l-th pool. For the second estimator, we infer the genotype of each individual sample by choosing a genotype having the largest posterior probability based on the observed Xlb and Clb. Then the second estimator is defined as
| (2) |
where is the number of minor allele a in genotype . Instead of inferring one genotype, the third method considers the posterior probabilities of all three possible genotypes and calculates the posterior expected minor allele count for each individual sample. More formally, the third estimator is obtained as follows:
| (3) |
where P(·|Xlb, Clb) is the posterior probability conditional on the observed Xlb and Clb. The Appendix describes the calculation of the posterior probabilities conditional on the observed sequencing data.
2.2 Simulation
We simulate pooled sequencing data with barcoding to assess the performance of the estimators described in the previous section. We first consider the distribution of the coverage of B individual DNA samples at a variant, (Cl1, …, ClB) in the l-th pooled sample for a given total coverage depth Cl. As pointed out by Kim et al. [2010], the mean depth for each Clb is expected to be proportional to the amount of the DNA sample with the b-th barcode in the l-th pooled sample, represented by qlb. An intuitive way to model (ql1, …, qlB) is the following Dirichlet distribution
| (4) |
where αB = (αB, …, αB) due to exchangeability among Clb’s. Note that the variation among (ql1, …, qlB) decreases with an increase of the hyper-parameter αB in the Dirichlet distribution. The hyper-parameter αB can be empirically estimated based on the observed Clb using the maximum likelihood estimate. See the Appendix in Lee et al. [2011] for more details. Then for given (ql1, …, qlB) and total coverage depth Cl, we can generate (Cl1, …, ClB) from a multinomial distribution,
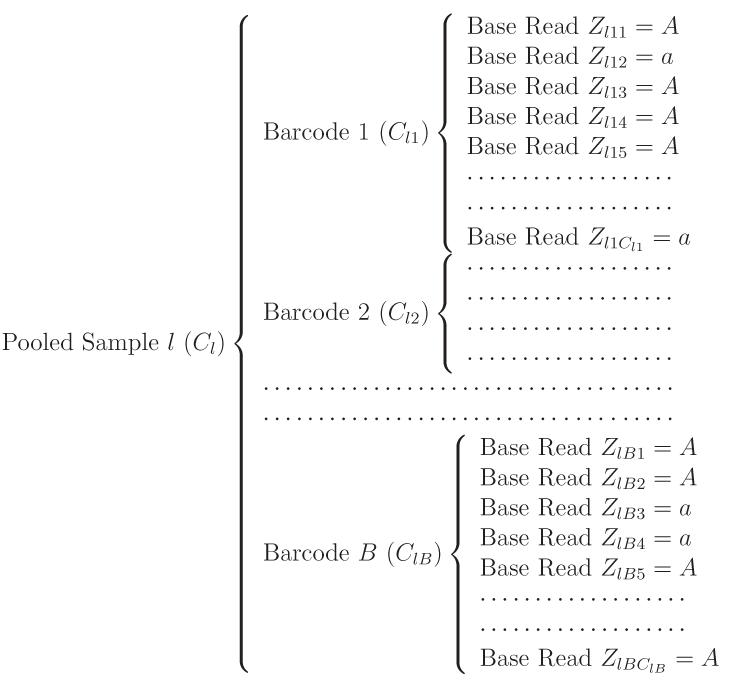
Based on the sampled values of Cl1, …, ClB, we then simulate sequencing reads along with barcode information as shown in Figure 2 and count sequencing reads with minor allele a. Suppose that Ylb is the number of chromosomes carrying a at the genomic location of our interest for the individual DNA sample with barcode b in sample l. In order to simulate Xlb, the minor allele count out of a total of Clb base reads, we first need to generate each Ylb from Binom(2, p) where p is the population MAF. To incorporate sequencing errors, e.g. a → A and A → a as stated in the Section 6.1, we assume the error rates of ε1 and ε2 for these two types of sequencing errors and then simulate
where .
Figure 2.
Schematic illustration of the structure of raw sequencing reads at a genomic location through the next-generation sequencing with barcoding. Here A and a represent the major and minor alleles for a variant.
3 Results
We first evaluate the performance of three estimators , and , which are derived from raw base counts, inferred genotypes, and the expected minor allele counts based on conditional posterior probabilities. To compare those estimators, the biases and mean squared errors (MSEs) of each estimator are calculated. We consider four MAFs 0.01, 0.02, 0.03, and 0.04. Our analysis focuses on sequencing whole-exome or specific genomic regions of interest rather than whole-genome. Given that the mean coverage depth of exome sequencing by Illumina HiSeq 2000 is about 150 per lane as of June, 2011, we consider the total coverage depths Cl of each pooled sample l varying from 150, 200, …, to 1000. The sequencing error rates ε1 and ε2 are set to 0.01. In order to take into account variations of DNA amounts contributing to the pool, we model the amount of contribution following a Dirichlet distribution in our analysis. As for the choice of the specification of the hyper-parameter αB, Lee et al. [2011] estimated from a real pooled DNA sample. We consider this value in our following analysis. Lastly, we need to specify the prior distribution of genotypes for inferred genotypes and expected minor allele counts. As suggested by Li et al. [2008], we initially assume that P(G = Aa) = r = 0.2, and P(G = AA) = P(G = aa) = (1 − r)/2 = 0.4 and later examine the sensitivity of the mis-specification of r. We also assume that each lane is used for a distinct pooled sample.
Effect of coverage depth per sequencing lane
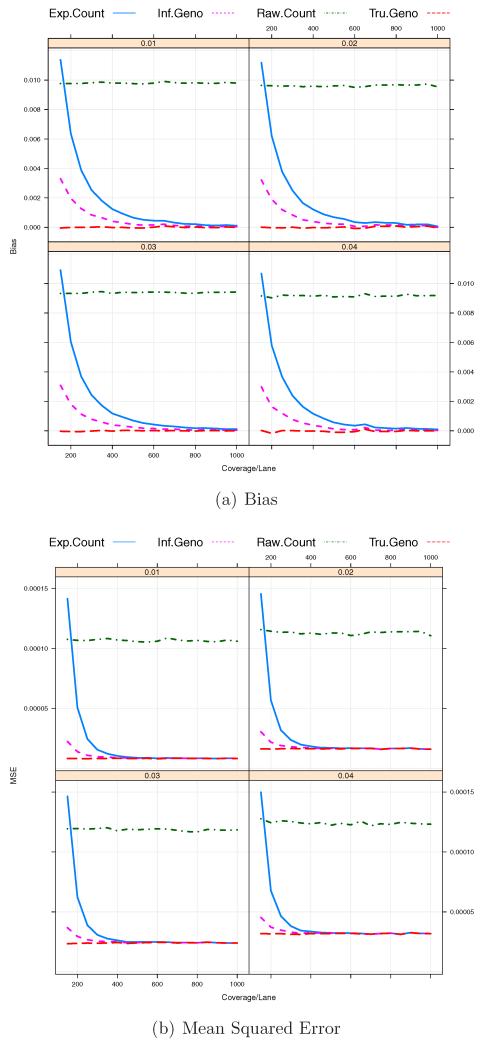
First, we investigate the effect of coverage depth Cl on biases and MSEs. We set the number of barcodes B per pooled sample to 12 which is a popular choice in practice. The total sample size N is assumed to be 600 so that the total number of pooled samples or sequencing lanes L is 50. As shown in Figure 3(a), the raw counts based estimator, has constant biases
The biases of are also shown to be overall higher than those of and except at a low coverage depth. In our analysis, we consider the prior probabilities of all possible genotypes suggested by Li et al. [2008]. Those prior probabilities, P(aa), P(Aa), and P(AA) are 0.4, 0.2, and 0.4 respectively. In this case, for rare SNPs, P(aa) and P(Aa) are over-specified whereas P(AA) = 0.4 is under-specified. At a lower coverage, the posterior probabilities of genotypes are more affected by this mis-specification of the prior probabilities, which may increase in the biases of and more so for but there can still be a decent chance that a genotype is inferred correctly. Hence is less affected by a lower coverage than . We will look into the sensitivity to prior distributions later. Figure 3(b) shows that the MSE of each estimator and illustrates that the performance of is overall comparable to the one based on true genotypes and the best among the three estimators considered regardless of the true MAF p and the coverage depth of each sample, Cl. Therefore is a preferable choice for the MAF estimation of p under the settings we consider in this manuscript. The estimator based on the expected minor allele counts, also performs similarly to but has larger biases and MSEs for lower coverage depths (< 30× coverage per individuaul). We also found that as the depth of coverage per lane increases up to 500× (About 40× per sample on average or higher), the MSEs of and tend to decrease but that in this case, the depth of coverage per lane higher than 500× seems to be excessive in terms of the MSE. In addition, the raw counts based estimator, has approximately constant MSEs around (0.01)2 across different coverage depths. It suggests that the biases are dominant in the MSEs of because
and the bias is
for a small population MAF p. This pattern also seems to be the case for the other estimators, which are reflected in Figures 3(a) and 3(b).
Figure 3.
Bias/MSE against coverage depth per sequencing lane. The total number of barcodes in a pooled sample, B = 12. The total coverage depth of each sample, C = 150, 200, …, 1000. The total number of pooled samples, L = 50. The sequencing errors ε1 = ε2 = 0.01.
Effect of number of sequencing lanes
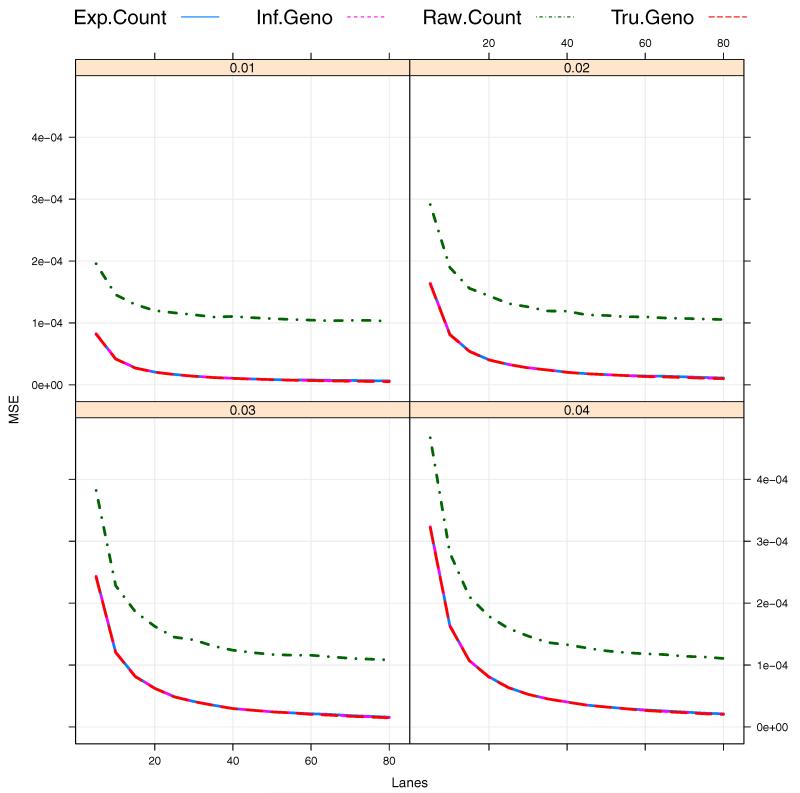
We also investigate the effect of the number of sequencing lanes being used, L, on the performance of the suggested estimators. Here we choose Cl = 500 in this analysis since the MSEs are stabilized around Cl ≥ 500 when B = 12 as shown in Figure 3. At this point, an intriguing question is on the number of sequencing lanes required to achieve a sufficiently low MSE. We consider the situation where there are a larger number of individual DNA samples available, for example, N = 960 so that an experimenter can utilize up to 80 lanes depending on the availability of research fund. In the case of a limited budget on the sequencing experiment, the experimenter may want to use as few sequencing lanes as possible while achieving a very lower MSE. To answer this question, we can study the benefit of more lanes. Figure 4 illustrates that the use of more sequencing lanes leads to reduced MSEs as expected. However, the rate of decrease in the MSE becomes less as L increases so that there is little benefit for L ≥ 60 in the scenarios considered.
Figure 4.
Bias/MSE against the number of sequencing lanes L (L = 5, 10, …, 80). The total number of barcodes in a pooled sample, B = 12. The total coverage depth of each sample, Cl = 500. The sequencing errors ε1 = ε2 = 0.01.
Effect of number of barcodes per lane
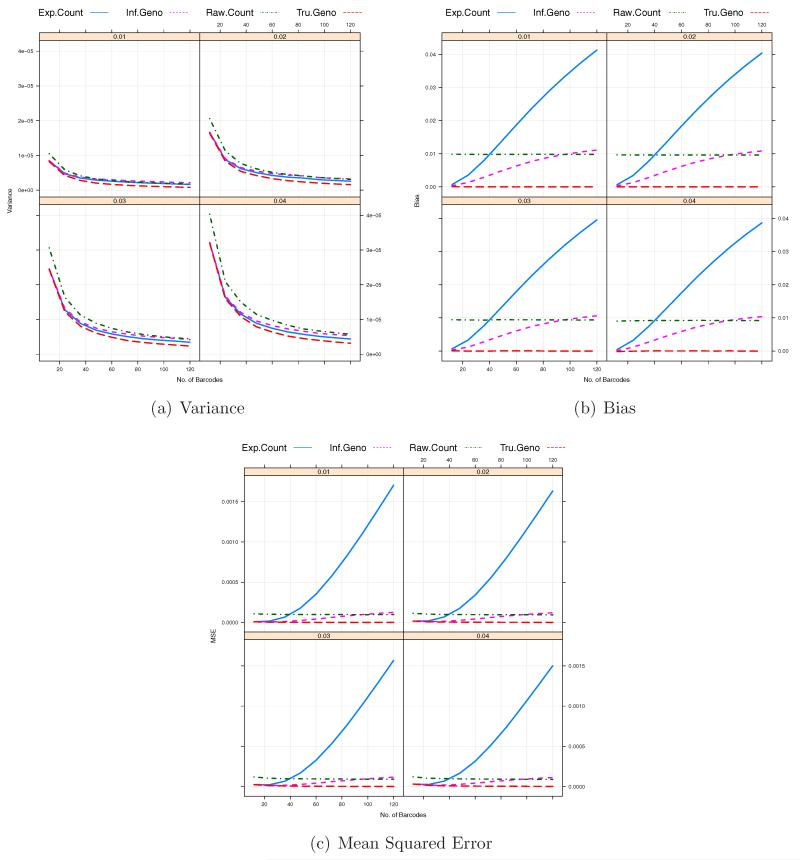
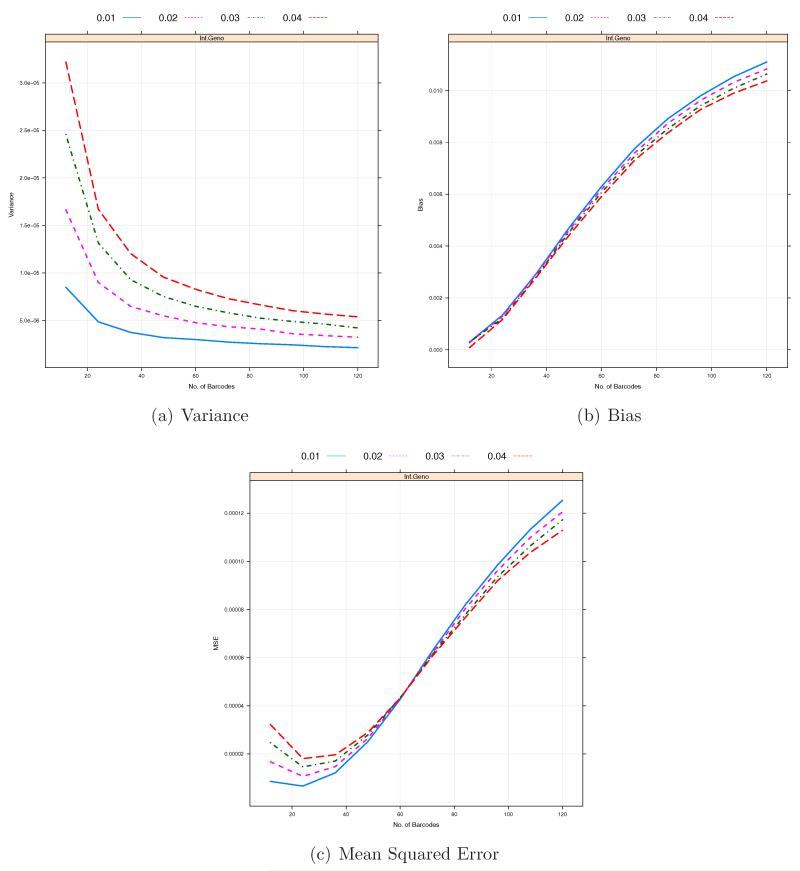
Due to advances in sequencing technology, the amount of data per sequencing lane would continue to increase. Figure 3 indicates that for a fixed number of individual samples per pooled sample, B, significant increase in the coverage depth per lane Cl may not lead to continued reduction in bias and MSE so that it is worth investigating the performance of our estimators as a function of B, the number of individual samples or barcodes used in pooled sample l for a given coverage depth Cl. We consider B = 12, 24 …, and 120 when Cl = 500. As we increase the number of barcodes, the coverage depth for an individual sample with barcode b, Clb, will decrease. As shown in Figure 5, due to the misspecification of the prior probabilities of genotypes, the biases of those two estimators, especially , rapidly increase and thus the corresponding MSEs increase as the number of barcodes B increases. Moreover, under the given conditions, both and have higher biases and MSEs than for B = 108 and 120 (4× or 5× coverage per barcode). Figure 5 also shows that as the number of distinct barcodes in a pooled sample increases, the variances of and tend to decrease whereas the biases of those estimators tend to increase. So the optimal barcode size can be determined where the MSE in minimized. As shown in Figure 6, these two factors counter balance each other, which can lead to an optimal number of barcodes, B* for under a specific setting. Interestingly, the optimal number of barcodes B* of is insensitive to MAFs to some extend (between 20 and 28). On the contrary, the bias of increases at much higher rate than the variance of decreases so that the minimum number of barcodes initially defined would be the optimal number of barcodes for (See Figure 5).
Figure 5.
The Variance/Bias/MSE against the number of barcodes per sequencing lane within a pooled sample. The total coverage depth of each sample, Cl = 500. The total number of pooled samples, L = 50. The total numbers of barcodes in a pooled sample under consideration are B = 12, 24 …, 120.
Figure 6.
The Variance/Bias/MSE of against the number of barcodes per sequencing lane within a pooled sample with MAFs p = 0.01, 0.02, 0.03 and 0.04. The total coverage depth of each sample, Cl = 500. The total number of pooled samples, L = 50. The sequencing errors ε1 = ε2 = 0.01. The total numbers of barcodes in a pooled sample under consideration are B = 12, …, 120.
Effect of prior distribution specifications
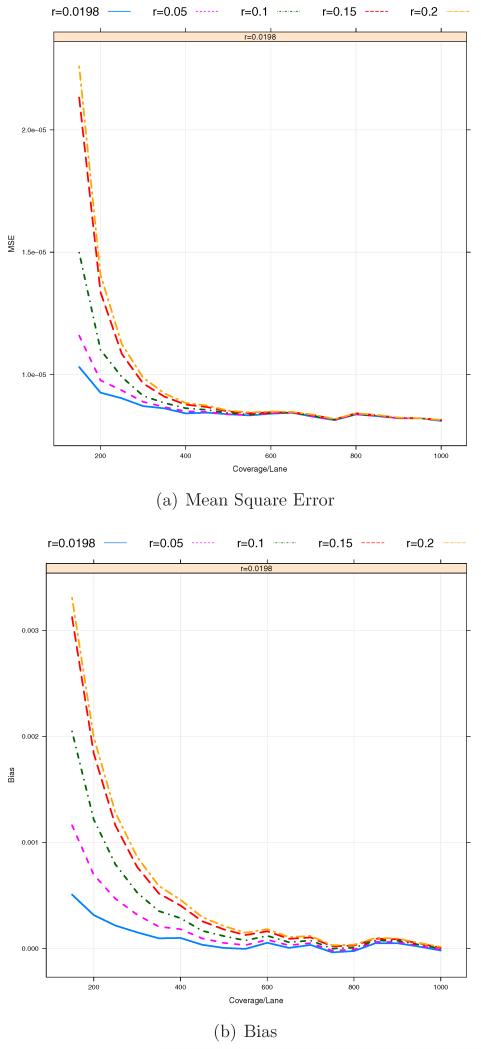
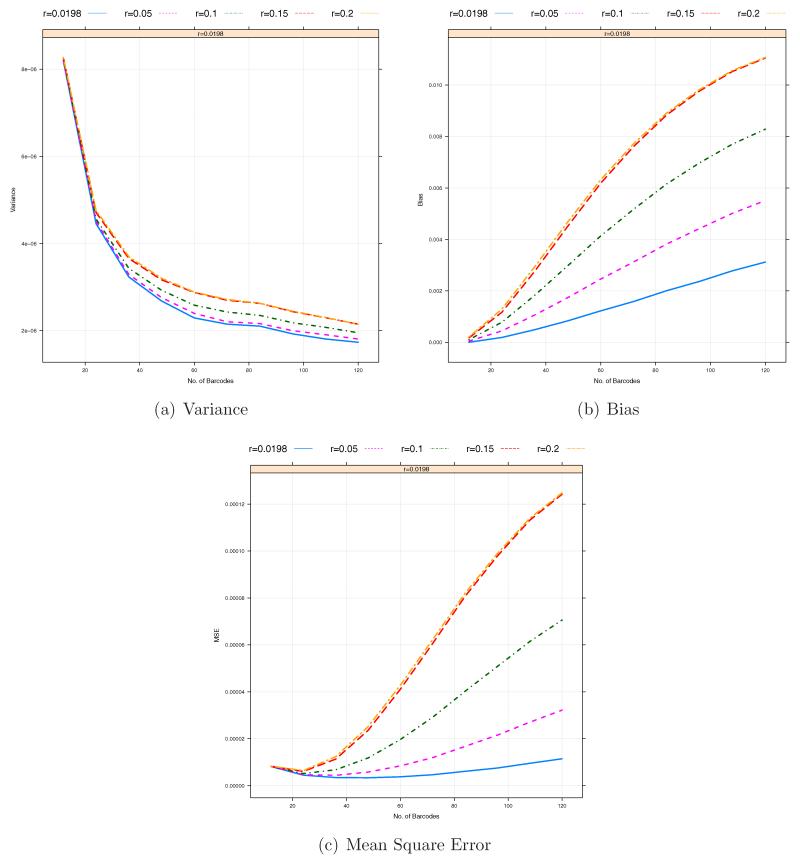
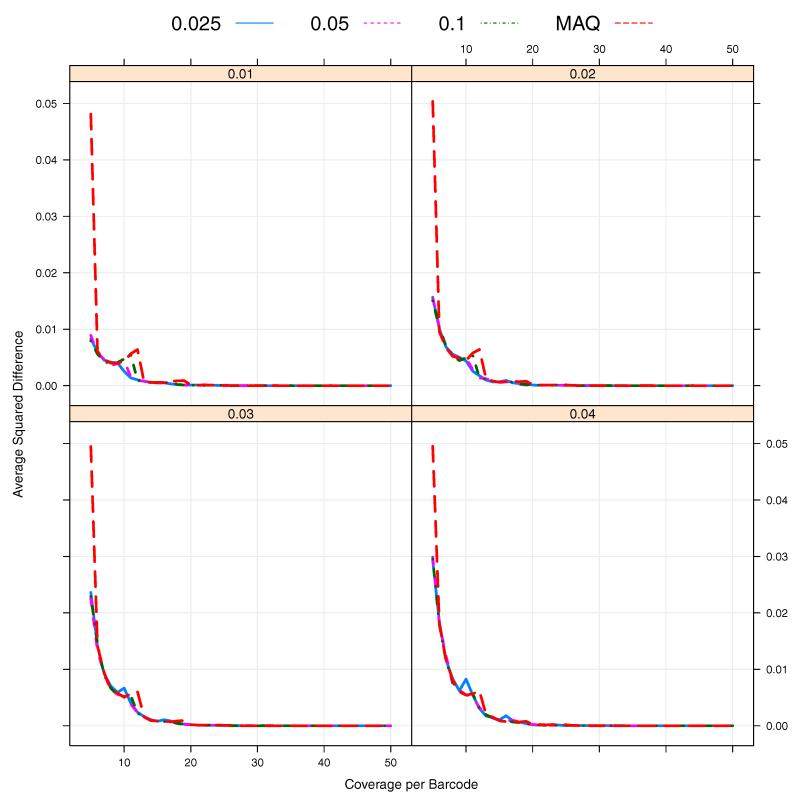
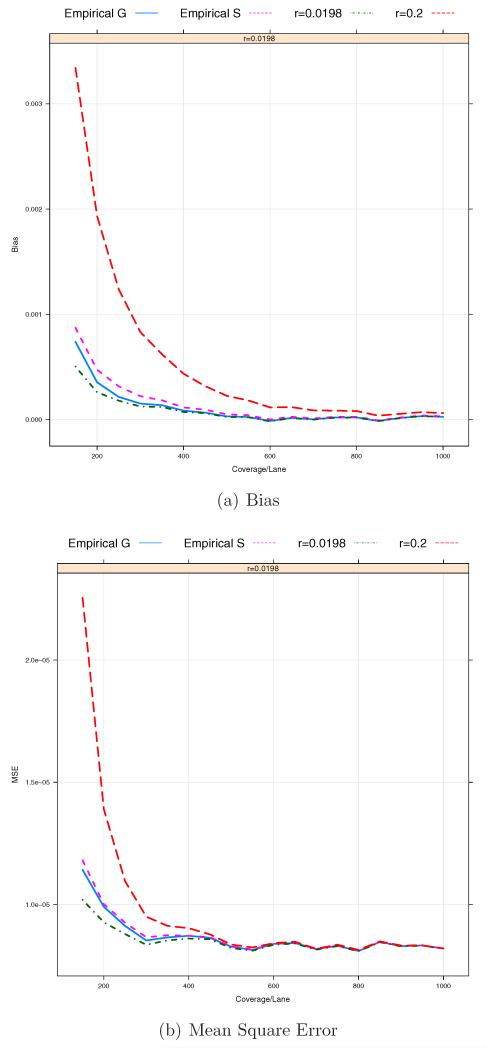
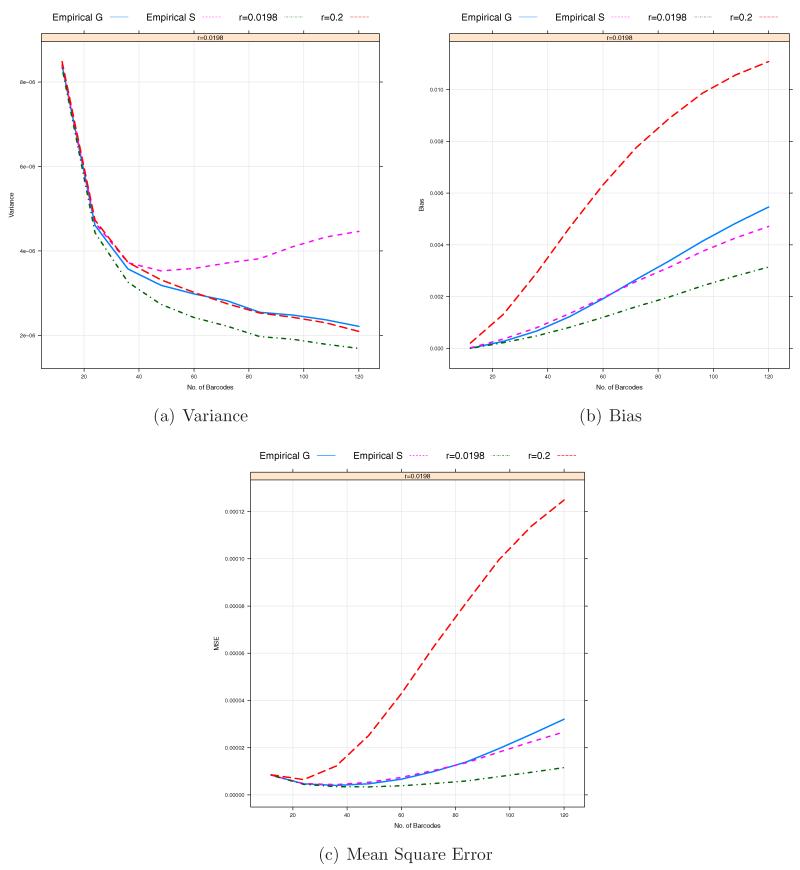
From Figure 5, we can observe that the misspecification of the prior probabilities of three genotypes can induce a potentially large upward bias, especially when the coverage depths Clb’s are low on average. Here we want to investigate the sensitivity to the prior assignment. For this analysis, we consider the estimation of MAF p = 0.01 by using . In this case, P(Aa) = 2p(1−p) = 0.0198 under the Hardy-Weinberg equilibrium. We choose five different values for P(Aa) = r including the true one r = 0.0198 and r = 0.2 which is the default value in MAQ for known SNPs [Li et al., 2008]. Figures 7 and 8 show that the bias and MSE can be sensitive to the choice of r and, in particular, that for a lower coverage Cl, a more accurate specification of r produces much lower bias and MSE. Figure 8 illustrates that with different values of r, the optimal pool size is between 24 and 48 (10 ~ 20× coverage per barcode on average). In addition, we investigate the impact of the prior misspecification on the discrepancy between true and inferred genotypes by
| (5) |
where and are true and inferred genotypes respectively. As shown in Figure 9, for rare SNPs, the prior misspecification may require a bit higher sequencing coverage when the MAQ default value to minimize Equation 5 when P(Aa) = 0.2 is used. Under the given assumption on sequencing errors, about 15× coverage per barcode seems to be enough to infer genotypes correctly across different prior probabilities and MAFs. However, when taking into account the pooling variation, we may need a higher sequencing coverage to infer genotype more accurately overall.
Figure 7.
The effect of prior specification on Bias/MSE against coverage depth per sequencing lane. The total number of barcodes in a pooled sample, B = 12. The total coverage depth of each sample, C = 150, 200, …, 1000. The total number of pooled samples, L = 50. The sequencing errors ε1 = ε2 = 0.01.
Figure 8.
The effect of prior specification on Variance/Bias/MSE against the number of barcodes per sequencing lane within a pooled sample. The total coverage depth of each sample, Cl = 500. The total number of pooled samples, L = 50. The sequencing errors ε1 = ε2 = 0.01. The total numbers of barcodes in a pooled sample under consideration are B = 12, 24, …, 120.
Figure 9.
The average squared distance between true genotypes and inferred genotypes against sequencing coverage per barcode. The sequencing errors ε1 = ε2 = 0.01. The prior specifications of P(Aa) = 0.025, 0.05, 0.1 and 0.2 (MAQ default).
4 Discussion and Conclusions
Our analysis shows that the bias is the dominant factor in the MSE for each estimator. The estimator based on sequencing raw bases, as expected, has a higher bias in most cases compared to and . In this case, the bias seems to be mainly affected by sequencing errors for a rare SNP. For the other two estimators and , the bias reduction can be achieved by the increase in the coverage depth Cl for each pooled sample. However, for lower Clb’s, the biases of and can significantly increase due to the misspecification of the prior probability of P(Aa) = r. In this case, as shown in Figures 7 and 8, a choice of r is critical to the reduction of the bias of . Despite the advance in the NGS technologies, sequencing at medium/low-coverage is still expected to be a cost-effective study design because of larger samples. Therefore, it is important to select r informatively. If the MAF p were known, we could assign 2p(1 − p) to r. However, since the MAF of a SNP to be investigated is often unknown, we may need to consider estimating r from the data sets. In particular, for a large-scale study, we can estimate the prior probability r by jointly analyzing sequencing data across pooled samples as follow. Under the Hardy-Weinberg equilibrium (HWE), r can be estimated by . Here we consider two approaches to empirically estimating r. The first one is to estimate r by plugging in the HWE formula. The second approach begins with calling genotypes for a SNP with a given prior probability, say r = 0.2 and estimating by using . Then, it updates by iteratively calling genotypes with estimated at the previous step until converges. Figures 10 and 11 show the results based on r = 0.0198 (the true value), 0.2 (the default value of MAQ) and those empirical estimates and . It is shown that ’s based on empirical estimates and overall perform comparably to with the true value of r. It indicates the potential benefit of using one of those empirical estimate and instead of r = 0.2, the default value of MAQ for known SNPs, as pointed out by Nielsen et al. [2011].
Figure 10.
Bias/MSEs based on empirically estimated (the first approach) and against coverage depth per sequencing lane. The total number of barcodes in a pooled sample, B = 12. The total coverage depth of each sample, C = 150, 200, …, 1000. The total number of pooled samples, L = 50. The sequencing errors ε1 = ε2 = 0.01.
Figure 11.
Bias/MSEs based on empirically estimated (the first approach) and against the number of barcodes per sequencing lane within a pooled sample. The total coverage depth of each sample, Cl = 500. The total number of pooled samples, L = 50. The sequencing errors ε1 = ε2 = 0.01. The total numbers of barcodes in a pooled sample under consideration are B = 12, 24, …, 120.
In summary, we have considered the estimation of MAFs of rare variants through NGS with pooled DNA samples with or without barcodes. We investigated the performance of three estimators based on raw sequencing bases, inferred genotypes and expected minor allele counts respectively. In our simulation study, the estimator based on inferred genotypes, overall performs better than the other two estimators except when the coverage depth per barcode in a pooled sample is very low (coverage per barcode on average < 5×). Our study also shows that the optimal number of barcodes in a pool is somehow robust to the MAFs of rare variants at a specific coverage depth. This is a very favorable property as the MAF of the rare SNP to be estimated is unknown. Moreover, DNA pooling with barcoding can also be a very cost-effective approach for genetic association studies, and this will be examined in our future work.
Acknowledgements
We would like to thank the associate editor and the two reviewers for their insightful comments. We also thank the Yale University Biomedical High Performance Computing Center and NIH grant: RR19895, which funded the instrumentation. This research was supported in part by NIH grants T15 LM07056 and GM 59507.
6 Appendix
6.1 The Posterior Probabilities of Genotypes
For the sake of simplicity, we only consider two possible sequencing errors (A → a and a → A). Here we assume that ε1(ε2) is the sequencing error rate when a(A) is mis-sequenced into A(a). If X represents the number of sequencing reads with minor allele a at a genomic location, the likelihoods of the three genotypes {AA, Aa, aa} are
where C is the coverage depth at the location. Then the posterior probabilities of the three genotypes can be calculated by using Bayes rule as follows:
where P(G = g) is the prior probability for the genotype g ∈ {AA, Aa, aa}. For the prior specifications for inferring genotypes at known SNP sites, Li et al. [2008] suggested P(G = Aa) = r = 0.2, and P(G = AA) = P(G = aa) = (1 − r)/2.
References
- Bansal Vikas. A statistical method for the detection of variants from next-generation resequencing of DNA pools. Bioinformatics. 2010;26(12):i318–i324. doi: 10.1093/bioinformatics/btq214. doi: 10.1093/bioinformatics/btq214. [DOI] [PMC free article] [PubMed] [Google Scholar]
- Choi Murim, Scholl Ute I., Yue Peng, Björklund Peyman, Zhao Bixiao, Nelson-Williams Carol, Ji Weizhen, Cho Yoonsang, Patel Aniruddh, Men Clara J., Lolis Elias, Wisgerhof Max V., Geller David S., Mane Shrikant, Hellman Per, Westin Gunnar, Åkerström Göran, Wang Wenhui, Carling Tobias, Lifton Richard P. K+ channel mutations in adrenal aldosterone-producing adenomas and hereditary hypertension. Science. 2011;331(6018):768–772. doi: 10.1126/science.1198785. [DOI] [PMC free article] [PubMed] [Google Scholar]
- Craig David W, Pearson John V, Szelinger Szabolcs, Sekar Aswin, Redman Margot, Corneveaux Jason J, Pawlowski Traci L, Laub Trisha, Nunn Gary, Stephan Dietrich A, Homer Nils, Huentelman Matthew J. Identification of genetic variants using bar-coded multiplexed sequencing. Nat Meth. 2008;5(10):887–893. doi: 10.1038/nmeth.1251. [DOI] [PMC free article] [PubMed] [Google Scholar]
- Kim Su, Lohmueller Kirk, Albrechtsen Anders, Li Yingrui, Korneliussen Thorfinn, Tian Geng, Grarup Niels, Jiang Tao, Andersen Gitte, Witte Daniel, Jorgensen Torben, Hansen Torben, Pedersen Oluf, Wang Jun, Nielsen Rasmus. Estimation of allele frequency and association mapping using next-generation sequencing data. BMC Bioinformatics. 2011;12(1):231. doi: 10.1186/1471-2105-12-231. [DOI] [PMC free article] [PubMed] [Google Scholar]
- Kim Su Yeon, Li Yingrui, Guo Yiran, Li Ruiqiang, Holmkvist Johan, Hansen Torben, Pedersen Oluf, Wang Jun, Nielsen Rasmus. Design of association studies with pooled or un-pooled next-generation sequencing data. Genetic Epidemiology. 2010;34(5):479–491. doi: 10.1002/gepi.20501. doi: 10.1002/gepi.20501. [DOI] [PMC free article] [PubMed] [Google Scholar]
- Kozarewa Iwanka, Turner Daniel J. chapter 96-Plex Molecular Barcoding for the Illumina Genome Analyzer. Springer; 2011. High-Throughput Next Generation Sequencing Methods and Applications; pp. 279–298. doi: 10.1007/978-1-61779-089-8. [DOI] [PubMed] [Google Scholar]
- Lee Joon Sang, Choi Murim, Yan Xiting, Lifton Richard P., Zhao Hongyu. On optimal pooling designs to identify rare variants through massive resequencing. Genetic Epidemiology. 2011;35(3):139–147. doi: 10.1002/gepi.20561. doi: 10.1002/gepi.20561. [DOI] [PMC free article] [PubMed] [Google Scholar]
- Li Heng, Ruan Jue, Durbin Richard. Mapping short DNA sequencing reads and calling variants using mapping quality scores. Genome Research. 2008;18(11):1851–1858. doi: 10.1101/gr.078212.108. doi: 10.1101/gr.078212.108. [DOI] [PMC free article] [PubMed] [Google Scholar]
- Li Ruiqiang, Li Yingrui, Fang Xiaodong, Yang Huanming, Wang Jian, Kristiansen Karsten, Wang Jun. SNP detection for massively parallel whole-genome resequencing. Genome Research. 2009;19(6):1124–1132. doi: 10.1101/gr.088013.108. [DOI] [PMC free article] [PubMed] [Google Scholar]
- Li Yingrui, Vinckenbosch Nicolas, Tian Geng, Huerta-Sanchez Emilia, Jiang Tao, Jiang Hui, Albrechtsen Anders, Andersen Gitte, Cao Hongzhi, Korneliussen Thorfinn, Grarup Niels, Guo Yiran, Hellman Ines, Jin Xin, Li Qibin, Liu Jiangtao, Liu Xiao, Sparso Thomas, Tang Meifang, Wu Honglong, Wu Renhua, Yu Chang, Zheng Hancheng, Astrup Arne, Bolund Lars, Holmkvist Johan, Jorgensen Torben, Kristiansen Karsten, Schmitz Ole, Schwartz Thue W, Zhang Xiuqing, Li Ruiqiang, Yang Huanming, Wang Jian, Hansen Torben, Pedersen Oluf, Nielsen Rasmus, Wang Jun. Resequencing of 200 human exomes identifies an excess of low-frequency non-synonymous coding variants. Nat Genet. 2010;42(11):969–972. doi: 10.1038/ng.680. [DOI] [PubMed] [Google Scholar]
- Lynch Michael. Estimation of allele frequencies from high-coverage genome-sequencing projects. Genetics. 2009;182(1):295–301. doi: 10.1534/genetics.109.100479. [DOI] [PMC free article] [PubMed] [Google Scholar]
- Mardis Elaine R. Next-generation DNA sequencing methods. Annu Rev Genomics Hum Genet. 2008;9:387–402. doi: 10.1146/annurev.genom.9.081307.164359. [DOI] [PubMed] [Google Scholar]
- McKenna Aaron, Hanna Matthew, Banks Eric, Sivachenko Andrey, Cibulskis Kristian, Kernytsky Andrew, Garimella Kiran, Altshuler David, Gabriel Stacey, Daly Mark, DePristo Mark A. The genome analysis toolkit: A mapreduce framework for analyzing next-generation DNA sequencing data. Genome Research. 2010;20(9):1297–1303. doi: 10.1101/gr.107524.110. [DOI] [PMC free article] [PubMed] [Google Scholar]
- Meyer Matthias, Stenzel Udo, Myles Sean, Prüfer Kay, Hofreiter Michael. Targeted high-throughput sequencing of tagged nucleic acid samples. Nucleic Acids Research. 2007;35(15):e97. doi: 10.1093/nar/gkm566. doi: 10.1093/nar/gkm566. [DOI] [PMC free article] [PubMed] [Google Scholar]
- Ng Sarah B, Bigham Abigail W, Buckingham Kati J, Hannibal Mark C, McMillin Margaret J, Gildersleeve Heidi I, Beck Anita E, Tabor Holly K, Cooper Gregory M, Mefford Heather C, Lee Choli, Turner Emily H, Smith Joshua D, Rieder Mark J, Yoshiura Kohichiro, Matsumoto Naomichi, Ohta Tohru, Niikawa Norio, Nickerson Deborah A, Bamshad Michael J, Shendure Jay. Exome sequencing identifies mll2 mutations as a cause of kabuki syndrome. Nat Genet. 2010;42:790–793. doi: 10.1038/ng.646. [DOI] [PMC free article] [PubMed] [Google Scholar]
- Nielsen Rasmus, Paul Joshua S., Albrechtsen Anders, Song Yun S. Genotype and SNP calling from next-generation sequencing data. Nat Rev Genet. 2011;12(6):443–451. doi: 10.1038/nrg2986. [DOI] [PMC free article] [PubMed] [Google Scholar]
- O’Roak Brian J, Deriziotis Pelagia, Lee Choli, Vives Laura, Schwartz Jerrod J, Girirajan Santhosh, Karakoc Emre, MacKenzie Alexandra P, Ng Sarah B, Baker Carl, Rieder Mark J, Nickerson Deborah A, Bernier Raphael, Fisher Simon E, Shendure Jay, Eichler Evan E. Exome sequencing in sporadic autism spectrum disorders identifies severe de novo mutations. Nat Genet. 2011;43(6):585–589. doi: 10.1038/ng.835. [DOI] [PMC free article] [PubMed] [Google Scholar]
- Wang Tao, Lin Chang-Yun, Rohan Thomas E., Ye Kenny. Resequencing of pooled DNA for detecting disease associations with rare variants. Genetic Epidemiology. 2010;34(5):492–501. doi: 10.1002/gepi.20502. doi: 10.1002/gepi.20502. [DOI] [PMC free article] [PubMed] [Google Scholar]


