

Abstract
Purpose
The aim of this analysis was to determine the total ocular wavefront aberration values of a large phakic population of physiologically normal, ametropic eyes, gathered under the same clinical protocol using the same diagnostic wavefront sensor.
Materials and methods
Studies were conducted at multiple sites in Asia, North America, Europe, and Australia. A Bausch + Lomb Zywave II Wavefront Aberrometer (Rochester, NY, USA) was used to measure the lower and higher order aberrations of each eye. Data analysis was conducted using linear regression analysis to determine the relationship between total spherical aberration, ametropia, age, corneal curvature, and image quality.
Results
Linear regression analysis showed no correlation (r = 0.0207, P = 0.4874) between degree of ametropia and the amount of spherical aberration. There was also no correlation when the population was stratified into myopic and hyperopic refractive groups (rm = 0.0529, Pm = 0.0804 and rh = 0.1572, Ph = 0.2754). There was a statistically significant and weak positive correlation (r = 0.1962, P < 0.001) between age and the amount of spherical aberration measured in the eye; spherical aberration became more positive with increasing age. Also, there was a statistically significant and moderately positive correlation (r = 0.3611, P < 0.001) with steepness of corneal curvature; spherical aberration became more positive with increasing power of the anterior corneal surface. Assessment of image quality using optical design software (Zemax™, Bellevue, WA < USA) showed that there was an overall benefit in correcting the average spherical aberration of this population.
Conclusion
Analysis of this dataset provides insights into the inherent spherical aberration of a typical phakic, pre-presbyopic, population and provides the ability to determine what drives the spherical aberration of the eye, as well as what potential benefit a person could gain by compensating for that average spherical aberration.
Keywords: ocular aberrations, contact lenses, wavefront sensor
Introduction
Today’s rapidly changing technology is driving an advance in the improved diagnostic capabilities for measuring ocular aberrations, and the design and characterization of contact lens optical parameters. With these advanced capabilities comes the need for a more complete characterization of the distribution of aberrations of the human eye amongst a large sample population.
Higher order wavefront aberrations of the normal eye can be accurately characterized by fitting Zernike coefficients from the second through fifth order. Of these higher order aberration terms, spherical aberration is the only one to have a population mean significantly different than zero.1,2 This feature, plus the fact that spherical aberration is a rotationally symmetric aberration term (unlike coma), means that most of the commercially available single vision contact lenses that attempt to compensate for higher order aberrations, primarily target the reduction of spherical aberration.
Many studies have reported on age, refractive error, biometry, and ocular aberrations of the human eye, but few have been large in scale and done under a single clinical protocol.3–9 Of the few studies that do report large sample sizes, most are a meta-sample analysis comprising a number of smaller studies using nonuniform measurement or analysis protocols.10 These variations have led to several methodological differences among the studies including the type of wavefront sensor and measurement protocol used (ie, pupil dilation). Additionally, most of these small studies were limited to a single race or age group of subjects. All these limitations make it difficult to determine the true population mean for important aberrations such as spherical aberration, and other higher order wavefront aberrations of the human eye. The purpose of this analysis was to determine the total ocular wavefront aberrations of a large population of physiologically normal, ametropic eyes, all gathered under the same clinical protocol using the same diagnostic wavefront sensor.
Materials and methods
Measuring total ocular wavefront aberrations
Subjects were recruited to participate in a series of studies designed to investigate the clinical outcomes of wavefront correcting or wavefront guided laser-assisted in situ keratomileusis (LASIK) procedures. Studies were conducted at multiple sites in Asia (Singapore, Philippines, Thailand), North America (United States, Canada), Europe (Spain, The Netherlands, Germany), and Australia. During preoperative biometry measurements, a Bausch + Lomb Zywave II Wavefront Aberrometer (Bausch + Lomb, Rochester, NY, USA) was used to measure the lower and higher order aberrations of each eye at all sites. If a subject’s undilated mesopic pupil size was greater than 6.0 mm, as measured by the Zywave, then no dilating agent was required for wavefront measurement. If the mesopic pupil diameter was less than 6.0 mm, 2.5% phenylephrine was used. If the dilated pupil diameter still did not reach a value greater than 6.0 mm, 0.5% tropicamide was applied to the eye.
Subjects who were contact lens wearers needed to have gas permeable lenses discontinued for at least 3 weeks and soft lenses discontinued for at least 1 week prior to preoperative evaluation in the treatment eye. These subjects also needed to have two central keratometry readings and two manifest refractions taken at least 1 week apart preoperatively. The refraction values could not differ by more than 0.50 diopter (D), as defined by manifest refraction spherical equivalent, and keratometry values could not differ from previous values by more than 0.50 D in either meridian to be included in the study. Three separate measurements were collected from both eyes of the subject while fixating at infinity using the Zywave. The average of these three readings was used as the measure of each Zernike coefficient over a 6.0 mm analysis diameter for each eye.
A total sample size of 1124 eyes (1074 myopic and 50 hyperopic) were included. The age of the population ranged from 19 to 45 years of age, with a mean age of 31.8 years. Figure 1 shows the distribution of spherical equivalent powers included in this analysis. Age and refractive error distribution (Table 1) are reflective of a typical population of phakic, pre-presbyopic, patients requiring refractive correction for distance vision. No subjects requiring monovision treatment, or subjects requiring presbyopic corrections, were included in this investigation.
Figure 1.
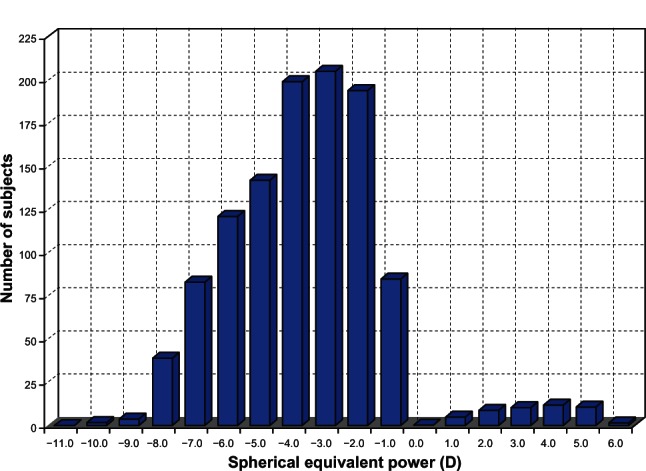
Spherical equivalent power distribution for the study population of 1124 eyes.
Abbreviation: D, diopter.
Table 1.
Descriptive statistics of sphere, cylinder, and spherical equivalent power for 1124 eyes
| Sphere | Cylinder | Spherical equivalent | |
|---|---|---|---|
| Mean ± SD | −3.71 ± 2.40 D | −0.74 ± 0.64 D | −4.08 ± 2.41 D |
| Range | +6.00 to −10.00 D | 0.00 to −4.00 D | +5.13 to −10.81 D |
Abbreviations: SD, standard deviation; D, diopter.
The study followed the tenets of the Declaration of Helsinki and was approved by the Southwest Independent Review Board in addition to those required by each test site. Each subject signed an informed consent form after receiving an explicit description of the study.
Determining impact of spherical aberration on image quality
To determine how this population of eyes would benefit from correction of spherical aberration, eye models were created in commercially available optical design software (Zemax™, Bellevue, WA, USA) to match the total ocular aberrations of each of the 1124 eyes summarized above. These models were used to theoretically predict the retinal image quality with no spherical aberration correction and −0.18 μM spherical aberration correction over a 6.0 mm pupil diameter (to compensate for the average +0.18 μM in this population).
Predicted logarithm of the minimum angle of resolution (logMAR) visual acuity was calculated using a novel pattern-matching metric, which simulates retinal image quality for each of the individual eye models.11 Predicted logMAR acuity values for a 6.0 mm pupil diameter were determined for no spherical aberration correction and −0.18 μM spherical aberration correction for each of the 1124 computer eye models.
Results
As mentioned previously, of the total ocular higher order aberration terms, spherical aberration is the only one to have a population mean significantly different than zero. Therefore, the focus of the analysis was to understand the relationships between Zernike spherical aberration, ametropia, age, corneal curvature, and image quality. The relationships of these various measures were evaluated statistically with linear regression analysis with a Type I error level of P < 0.05. Figure 2 shows that while a wide range of spherical aberration values are present across this 1124 eye population, 91% of eyes demonstrated positive spherical aberration, with an average spherical aberration of +0.18 μM over a 6.0 mm pupil diameter.
Figure 2.
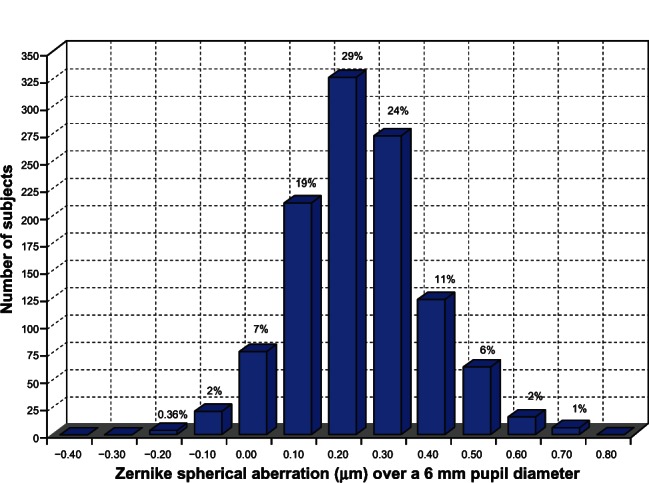
Spherical aberration distribution for the study population of 1124 eyes (mean = +0.18 μm over a 6.0 mm pupil diameter).
Is there a correlation of spherical aberration with ametropia?
Previous studies of monochromatic aberrations have shown that spherical aberration is essentially independent of the degree of ametropia.12,13 These studies have spanned the refractive range of +5.0 D to −10.0 D which is comparable to the spherical equivalent values presented here. Investigation of the relationship between ametropia and total ocular spherical aberration for the entire population is shown in Figure 3A. Linear regression analysis showed no correlation (r = 0.0207, P = 0.4874) between the degree of ametropia and the amount of spherical aberration. This population is composed of subjects who represent those typically seeking refractive correction for distance viewing – pre-presbyopic individuals. Hence, 95.5% of the subjects in this study were myopic. To discover whether the smaller number of hyperopic subjects influenced the correlation, the population was stratified by refractive group, then linear regression analysis was repeated. Myopes were considered to have refractive error less than 0.0 D, whereas hyperopes had a refractive error greater than 0.0 D (Figure 3B). There was still no correlation between ametropia and spherical aberration in either the myopic or hyperopic groups (rm = 0.0529, Pm = 0.0804 and rh = 0.1572, Ph = 0.2754, respectively). The amount of individual variation of subjects’ spherical aberration was not correlated with their degree of ametropia.
Figure 3.
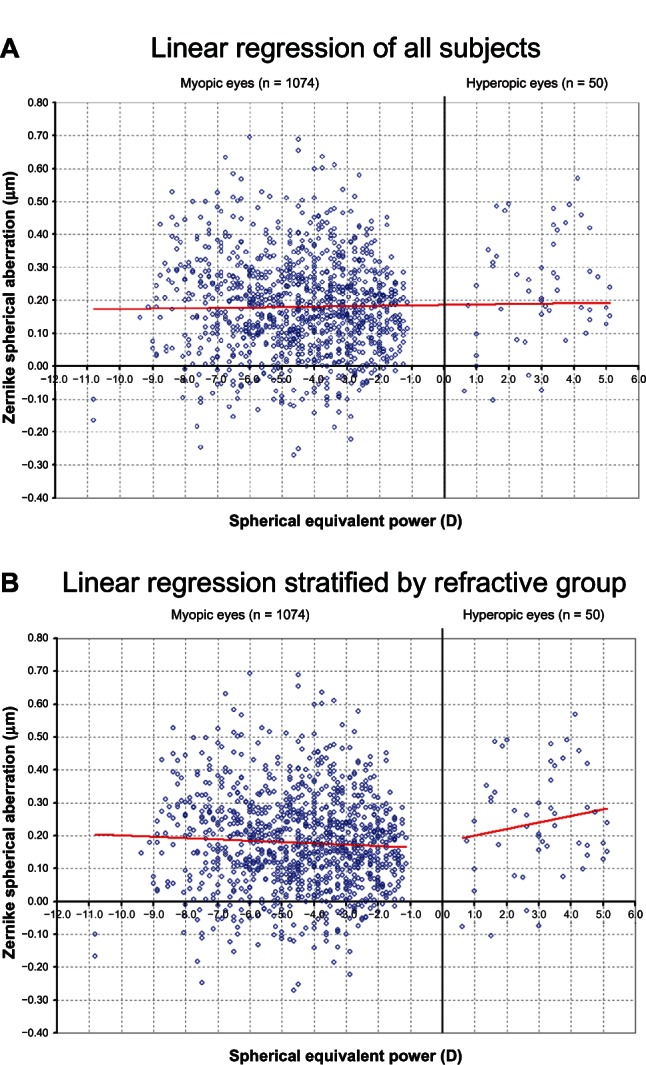
(A) Spherical aberration versus spherical equivalent power (r = 0.0207, P = 0.4874). (B) Spherical aberration versus spherical equivalent power stratified into myopic and hyperopic groups (rm = 0.0529, Pm = 0.0804 and rh = 0.1572, Ph = 0.2754).
Abbreviations: D, diopter; m, myopic; h, hyperopic.
Is there a correlation of spherical aberration with age?
It has long been established that monochromatic aberrations change as a function of age.14–16 The amount of positive spherical aberration increases with age due to changes in the crystalline lens. This population spanned the age range of 19 to 45 years of age (typical for phakic, pre-presbyopic, patients requiring refractive correction for distance vision). According to previous literature, age-related effects are small within this reduced age range of subjects.17–20 The relationship between age and spherical aberration of the eye is shown in Figure 4. ANOVA showed a statistically significant and weak positive correlation (r = 0.1962, P < 0.001) between age and the amount of spherical aberration measured in the eye; spherical aberration became more positive with increasing age. The amount of individual variability in the population and the smaller age range drives the weak correlation. For this population, while analysis shows that as a person ages there is an increase in positive spherical aberration, age is not necessarily predictive of the amount of spherical aberration in the eye.
Figure 4.
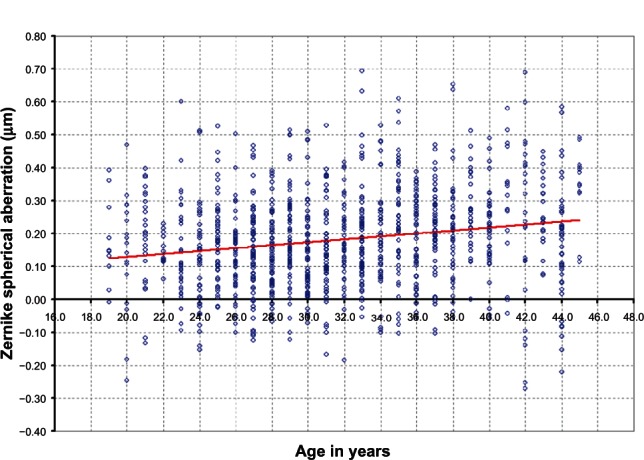
Spherical aberration versus age (r = 0.1962, P < 0.001).
Is there a correlation of spherical aberration with mean corneal curvature?
Many studies have looked at the correlation between corneal curvature and its role in corneal spherical aberration, but no studies have measured corneal curvature and correlated it to the amount of total ocular spherical aberration.16,17,21,22 Figure 5 shows the relationship between mean corneal curvature and the total spherical aberration of the eye. There was a statistically significant and moderately positive correlation (r = 0.3611, P < 0.001) between steepness of corneal curvature and the amount of spherical aberration. Spherical aberration became more positive with increasing power of the anterior corneal surface (steeper corneal radius of curvature).
Figure 5.
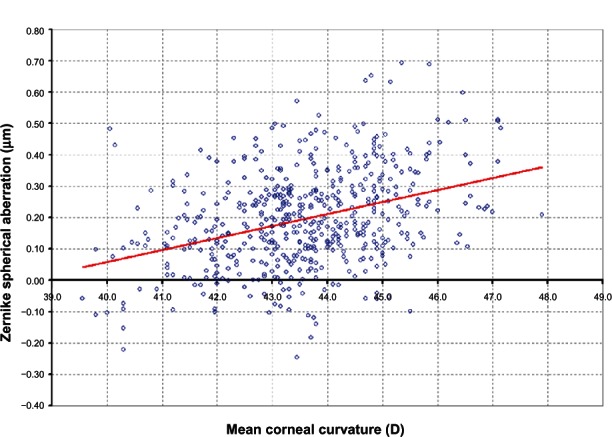
Spherical aberration versus mean corneal curvature (r = 0.3611, P < 0.001).
Abbreviation: D, diopter.
Will compensation for spherical aberration improve image quality?
When looking at the combined population of 1124 Zemax™ eye models, 54% of the population had a better predicted logMAR score of at least a half a line with the −0.18 μM spherical aberration correction. Of the total population, 66% of the eyes had better predicted logMAR by at least one letter with the −0.18 μM of spherical aberration correction compared with no spherical aberration correction. For the two spherical aberration corrections, 14% of the eyes had equivalent predicted logMAR, within ± one letter, and the remaining 20% did better by one letter with no spherical aberration correction. Of the 20% of eyes that did better by one letter with no spherical aberration correction, 99% had a measured spherical aberration less than +0.18 μm over a 6.0 mm pupil diameter. This means that the amount of residual spherical aberration with the correction in place would be negative for those subjects. The distribution of predicted logMAR acuity values for each of the two test conditions is shown in Figure 6.
Figure 6.
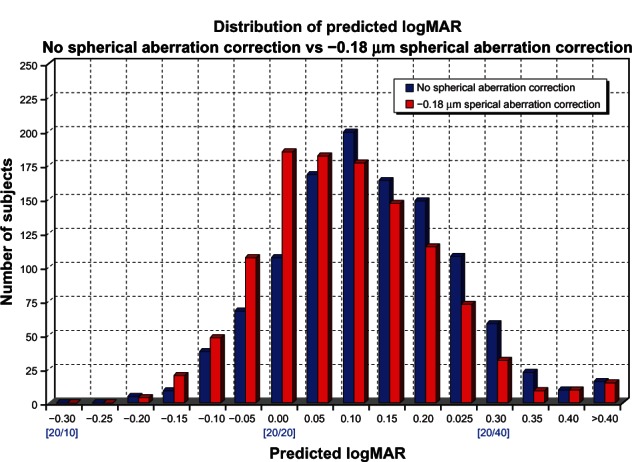
Distribution of predicted logMAR for 1124 eye models.
Abbreviation: logMAR, logarithm of the minimum angle of resolution.
Overall, there was a benefit in correcting this population’s average +0.18 μM spherical aberration compared with not using any spherical aberration correction, especially in eyes with larger magnitudes of positive spherical aberration. This is shown graphically in the (2) population distributions in Figure 6, with the −0.18 μM correction distribution being skewed towards better than 20/20 predicted image quality.
Discussion
This large sample population study supports previous reports with smaller samples in regards to trends seen with spherical aberration. However, this study extends these relationships with a sample that can be subdivided into ametropia, age, and corneal curvature to study more closely the influence of these variables on total ocular spherical aberration. The lack of correlation between ametropia and spherical aberration of the eye, with a trend instead for moderate positive correlation with steepness of corneal curvature, shows that spherical aberration is anterior segment driven, while ocular defocus is driven primarily by axial length. In young eyes, corneal aberrations are compensated by internal aberrations of the crystalline lens which results in an eye with few total aberrations. As age increases, the total aberrations also increase due to a loss of the compensatory mechanism based upon changes in the anterior cornea as well as the crystalline lens.23–25 This finding is reflected in the statistically significant and weak positive correlation that was found with increasing age, even with this smaller age range population (19 to 45 years).
The results of this analysis establish that the average spherical aberration across this large population is +0.18 μM over a 6.0 mm pupil diameter. Also, it was shown that spherical aberration can have a significant impact on overall image quality, both in contrast and resolution, of an optical system. Reducing the magnitude of spherical aberration of the eye can give the subject better image quality at distance, particularly under low light conditions where the pupil size is large.
Research has already shown that reducing the spherical aberration of the eye using intraocular lenses or refractive surgery yields an improvement in visual acuity and contrast sensitivity, compared with a spherical correction which induces positive spherical aberration.26–28 The image quality assessment conducted here, with individual computer eye models, compared a reduction of spherical aberration by −0.18 μm to no spherical aberration correction. In theory, there should be less difference between these two correction modalities than if we utilized positive spherical aberration lenses, yet the benefit of spherical aberration compensation could still easily be seen.
To further illustrate the difference in contrast and resolution between an eye with no spherical aberration and the population average of +0.18 μM, a custom MATLAB program (MathWorks, Natick, MA, USA) which convolves a United States Air Force image with the calculated point spread function for input Zernike aberrations over a 6.0 mm pupil diameter was utilized. The resolution and contrast enhancement with no spherical aberration (Figure 7A) compared to +0.18 μM of spherical aberration (Figure 7B) is shown.
Figure 7.
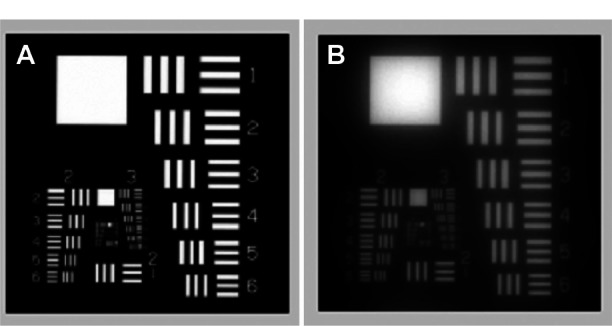
Image quality with (A) +0.00 μM and (B) 0.18 μM of spherical aberration, simulated with custom MATLAB software (Mathworks, Natick, Massachusetts, USA).
In summary, spherical aberration was not shown to correlate with the degree of ametropia, but it is correlated with age as well as mean corneal curvature. Also, reducing the amount of spherical aberration of this population showed an improvement in predicted retinal image quality compared to no spherical aberration correction. Both cataract and refractive surgery fields have been utilizing spherical aberration compensation to provide patients with better visual outcomes. Contact lenses designed to correct the total ocular spherical aberration inherent in the human eye may benefit from the values established with this larger phakic population analysis and give the industry a more accurate value to compensate for the eye’s spherical aberration.
Footnotes
Disclosure
The authors report no conflicts of interest in this work.
References
- 1.Porter J, Guirao A, Cox IG, Williams DR. Monochromatic aberrations of the human eye in a large population. J Opt Soc Am A Opt Image Sci Vis. 2001;18:1793–1803. doi: 10.1364/josaa.18.001793. [DOI] [PubMed] [Google Scholar]
- 2.Thibos LN, Bradley A, Hong X. A statistical model of the aberration structure of normal, well-corrected eyes. Ophthalmic Physiol Opt. 2002;22:427–433. doi: 10.1046/j.1475-1313.2002.00059.x. [DOI] [PubMed] [Google Scholar]
- 3.Thibos LN, Hong X, Bradley A, Cheng X. Statistical variation of aberration structure and image quality in a normal population of healthy eyes. J Opt Soc Am A Opt Image Sci Vis. 2002;19:2329–2348. doi: 10.1364/josaa.19.002329. [DOI] [PubMed] [Google Scholar]
- 4.Carkeet A, Luo HD, Tong L, Saw SM, Tan DT. Refractive error and monochromatic aberrations in Singaporean children. Vision Res. 2002;42:1809–1824. doi: 10.1016/s0042-6989(02)00114-1. [DOI] [PubMed] [Google Scholar]
- 5.Levy Y, Segal O, Avni I, Zadok D. Ocular higher-order aberrations in eyes with supernormal vision. Am J Ophthalmol. 2005;139:225–228. doi: 10.1016/j.ajo.2004.08.035. [DOI] [PubMed] [Google Scholar]
- 6.Wang L, Koch D. Ocular higher-order aberrations in individuals screened for refractive surgery. J Cataract Refract Surg. 2003;29:1896–1903. doi: 10.1016/s0886-3350(03)00643-6. [DOI] [PubMed] [Google Scholar]
- 7.Castejon-Mochon J, Lopez-Gil N, Benito A, Artal P. Ocular wave-front aberration statistics in a normal young population. Vision Res. 2002;42:1611–1617. doi: 10.1016/s0042-6989(02)00085-8. [DOI] [PubMed] [Google Scholar]
- 8.Netto MV, Ambrosio R, Shen T, Wilson S. Wavefront analysis in normal refractive surgery candidates. J Refract Surg. 2005;21:332–338. doi: 10.3928/1081-597X-20050701-06. [DOI] [PubMed] [Google Scholar]
- 9.Wei RH, Lim L, Chan WK, Tan DT. Higher order ocular aberrations in eyes with myopia in a Chinese population. J Refract Surg. 2006;22:695–702. doi: 10.3928/1081-597X-20060901-11. [DOI] [PubMed] [Google Scholar]
- 10.Salmon TO, Van de Pol C. Normal-eye Zernike coefficients and root-mean-square wavefront errors. J Cataract Refract Surg. 2006;32:2064–2074. doi: 10.1016/j.jcrs.2006.07.022. [DOI] [PubMed] [Google Scholar]
- 11.Pinto C, Kingston A, Venkiteshwar M, Ludington P. Pattern recognition as a retinal image quality metric. Invest Ophthalmo Vis Sci. 2008;49:E-Abstract 995. [Google Scholar]
- 12.Cheng X, Bradley A, Hong X, Thibos LN. Relationship between refractive error and monochromatic aberrations of the eye. Optom Vis Sci. 2003;80:43–49. doi: 10.1097/00006324-200301000-00007. [DOI] [PubMed] [Google Scholar]
- 13.Legras R, Chateau N, Charman WN. Assessment of just-noticeable differences for refractive errors and spherical aberration using visual simulation. Optom Vis Sci. 2004;81:718–728. doi: 10.1097/01.opx.0000144751.11213.cd. [DOI] [PubMed] [Google Scholar]
- 14.Calver RI, Cox MJ, Elliott DB. Effect of aging on the monochromatic aberrations of the human eye. J Opt Soc Am A. 1999;16:2069–2078. doi: 10.1364/josaa.16.002069. [DOI] [PubMed] [Google Scholar]
- 15.Amano S, Amano Y, Yamagami S, et al. Age-related changes in corneal and ocular higher-order wavefront aberrations. Am J Ophthalmol. 2004;137:988–992. doi: 10.1016/j.ajo.2004.01.005. [DOI] [PubMed] [Google Scholar]
- 16.Llorente L, Barbero S, Cano D, Dorronsoro C, Marcos S. Myopic versus hyperopic eyes: axial length, corneal shape and optical aberrations. J Vis. 2004;4:288–298. doi: 10.1167/4.4.5. [DOI] [PubMed] [Google Scholar]
- 17.Artal P, Berrio E, Guirao A, Piers P. Contribution of the cornea and internal surfaces to the change of ocular aberrations with age. J Opt Soc Am A. 2002;19:137–143. doi: 10.1364/josaa.19.000137. [DOI] [PubMed] [Google Scholar]
- 18.Mclellan J, Marcos S, Burns S. Age-related changes in monochromatic wave aberrations in the human eye. Invest Ophthalmo Vis Sci. 2001;42:1390–1395. [PubMed] [Google Scholar]
- 19.Brunette I, Bueno JM, Parent M, Hamam H, Simonet P. Monochromatic aberrations as a function of age, from childhood to advanced age. Invest Ophthalmol Vis Sci. 2003;44:5438–5446. doi: 10.1167/iovs.02-1042. [DOI] [PubMed] [Google Scholar]
- 20.Zhang FJ, Zhou Z, Yu FL, Lu ZL, Li T, Wang MM. Comparison of age-related changes between corneal and ocular aberration in young and mid-age myopic patients. Int J Ophthalmol. 2011;4:286–292. doi: 10.3980/j.issn.2222-3959.2011.03.16. [DOI] [PMC free article] [PubMed] [Google Scholar]
- 21.Philip K, Martinez A, Ho A, et al. Total ocular, anterior corneal and lenticular higher order aberrations in hyperopic, myopic and emmetropic eyes. Vision Res. 2012;52:31–37. doi: 10.1016/j.visres.2011.10.018. [DOI] [PubMed] [Google Scholar]
- 22.Scholz K, Messner A, Eppig T, Bruenner H, Langenbucher A. Topography-based assessment of anterior corneal curvature and asphericity as a function of age, sex and refractive status. J Cataract Refract Surg. 2009;35:1046–1054. doi: 10.1016/j.jcrs.2009.01.019. [DOI] [PubMed] [Google Scholar]
- 23.Atchison DA, Markwell EL, Kasthurirangan S, Pope JM, Smith G, Swann PG. Age-related changes in optical and biometric characteristics of emmetropic eyes. J Vis. 2008;8:20–21. doi: 10.1167/8.4.29. [DOI] [PubMed] [Google Scholar]
- 24.Dubbelman M, Van der Heijde GL. The shape of the aging human lens: curvature, equivalent refractive index and the lens paradox. Vision Res. 2001;41:1867–1877. doi: 10.1016/s0042-6989(01)00057-8. [DOI] [PubMed] [Google Scholar]
- 25.Smith G, Cox MJ, Calver R, Garner LF. The spherical aberration of the crystalline lens of the human eye. Vision Res. 2001;41:235–243. doi: 10.1016/s0042-6989(00)00206-6. [DOI] [PubMed] [Google Scholar]
- 26.Holladay JT, Piers P, Koranyi G, van der Mooren M, Norrby S. A new intraocular lens design to reduce spherical aberration of pseudophakic eyes. J Refract Surg. 2002;18:683–692. doi: 10.3928/1081-597X-20021101-04. [DOI] [PubMed] [Google Scholar]
- 27.Schwiegerling J, Snyder R. Corneal ablation patterns to correct for spherical aberration in photorefractive keratectomy. J Cataract Refract Surg. 2000;26:214–221. doi: 10.1016/s0886-3350(99)00359-4. [DOI] [PubMed] [Google Scholar]
- 28.Piers P, Fernandez EJ, Manzanera S, Norrby S, Artal P. Adaptive optics simulation of intraocular lenses with modified spherical aberration. Invest Ophthalmol Vis Sci. 2004;45:4601–4610. doi: 10.1167/iovs.04-0234. [DOI] [PubMed] [Google Scholar]