Abstract
This paper describes a stripping method for the determination of acyclovir at the submicromolar concentration level. This method is based on controlled adsorptive accumulation of acyclovir at thin-film mercury electrode, followed by a linear cyclic scan voltammetry measurement of the surface species. Optimal experimental conditions include a NaOH solution of 2.0 × 10⁻³ mol L−1 (supporting electrolyte), an accumulation potential of −0.40 V, and a scan rate of 100 mV s−1. The response of acyclovir is linear over the concentration range 0.02 to 0.12 ppm. For an accumulation time of 4 minutes, the detection limit was found to be 0.42 ppb (1.0 × 10⁻⁹ mol L−1). More convenient methods to measure the acyclovir in presence of the didanosine, efavirenz, nevirapine, nelfinavir, lamivudine, and zidovudine were also investigated. The utility of this method is demonstrated by the presence of acyclovir together with Adenosine triphosphate (ATP) or DNA.
Keywords: acyclovir determination, antiretroviral drugs, DNA, thin-film mercury electrode, stripping voltammetry
Introduction
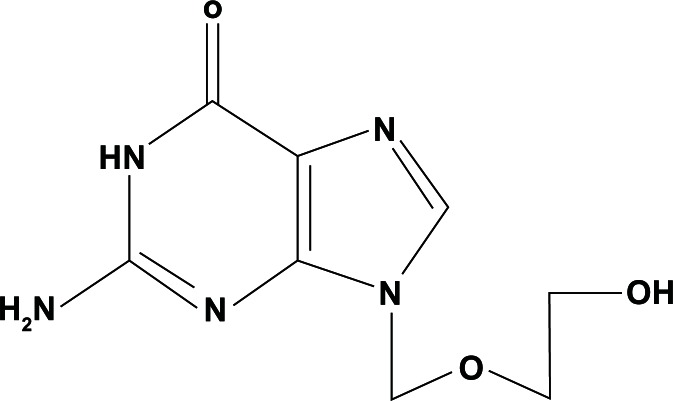
Acyclovir (Fig. 1) is a guanosine analogue antiviral drug, marketed under trade names such as Cyclovir, Zovirax and others. Acyclovir is one of the most commonly used antiviral drugs, primarily for the treatment of herpes simplex virus (HSV) infections as well as for the treatment of herpes zoster (shingles). Acyclovir was seen as the start of a new era in antiviral therapy,1 as it is extremely selective and low in cytotoxicity. Acyclovir differs from previous nucleoside analogues in that it contains only a partial nucleoside structure: the sugar ring is replaced by an open-chain structure. Acyclovir treatment in patients infected with both HSV and herpes simplex virus (HSV) has been observed to alter the disease course and decrease the HIV viral load. This finding has been attributed to indirect effects of HSV suppression on HIV replication.
Figure 1.
Acyclovir; [2-amino-9-((2-hydroxyethoxy)methyl)-1H-purin-6(9H)-one].
Spectroscopy2 chromatographic,3–7 chemiluminescence,8,9 spectrophotometric,10–12 and voltammetric13–18 analytical methods have been developed for the determination of acyclovir. With recent advancements in properties of the adsorptive stripping voltammetry, new methodologies have been developed for adenine, thymine, guanine, Adenosine triphosphate (ATP), DNA, and antiretroviral drugs determinations, employing alkaline solution with lower ionic strength as the supporting electrolyte.19–25 By using this alkaline electrolyte, the present work found a new stripping voltammetric procedure for trace detection of acyclovir based on its adsorption at the thin film mercury electrode. The advantages, instrumental parameters, and possible limitations of this procedure are also explained in this paper. Furthermore, the effects of a wide range of potentially interfering compounds such as didanosine, efavirenz, nevirapine, nelfinavir, lamivudine, zidovudine, some metal ions, and ATP or DNA are examined.
Experimental
Apparatus
All voltammograms of this article were obtained using a voltammetric analyzer of EG&G Princeton Applied Research Model 384B (United States) equipped with an electrochemical cell and a Plotter Houston Ametek-DMP-40. The electrochemical cell was performed with a working electrode of glassy carbon (GCE with 3 mm diameter from BAS-Bioanalytical Systems, West Lafayette, IN, United States) with thin film of mercury, a silver/silver chloride (BAS-Bioanalytical Systems, Inc.) as reference electrode and platinum wire as auxiliary electrode. For the convective transport in the accumulation process of the analytes were used a stirring bar (Nalgene) controlled by a magnetic stirrer.
Forming thin-film mercury electrode
Initially an acidified aqueous solution (5% nitric acid, HNO3) of mercuric nitrate, Hg (NO3)2 10−2 mol L−1, and a potassium nitrate, KNO3, 10−1 mol L−1 were prepared in the laboratory of preparation of solutions. After, in an adequate glass electrochemical cell, was added 1 mL of Hg (NO3)2, 1 mL of KNO3, and 8 mL of Milli-Q water. Then, the electrodes were immersed in this solution as describe in apparatus. The solution was purged with nitrogen for 240 seconds to eliminate any presence of oxygen. Then, the thin mercury film was formed by applying a potential at −0.9 V for 5 minutes. After checking that the film was formed, that is, characterized by bluish gray, the electrode was rinsed, leaving it ready to be used in the determination of analyte in each experiments of this article.
Reagents
All dilutions and sample preparations were done using water purified in a Milli-Q purification system (Millipore, Billerica, MA, USA). All chemicals were of the analytical reagent grade. Acyclovir standard was used as received by the FarManguinhos–FIOCRUZ (Fundação Oswaldo Cruz–RJ). Stock solutions of 1000 ppm were prepared by dissolving 50 mg of the target reagent acyclovir into 5 mL of 2 mol L−1 NaOH. Water was added until a volume of 50 mL was reached. Diluted acyclovir solutions of 100 or 10 ppm were prepared daily using 5 mL of 1000 or 100 ppm acyclovir dissolved into water until a volume of 50 mL was reached. Stock solutions of 1000 ppm of other HIV drugs were prepared by dissolving 50 mg of the target reagent into 5 mL of 2 mol L−1 NaOH, 5 mL of ethylic alcohol, and dissolved into water until a volume of 50 mL was reached. The didanosine stock solution was prepared without using ethylic alcohol. A 1000 ppm sample of copper and other metal stock solutions (atomic absorption standard solution, Sigma-Aldrich São Paulo, Brazil Ltda.) were used, and diluted as required for standard additions. Stock solutions of 1000 ppm of adenosine 5′-triphosphate, disodium salt hydrate (ATP) were prepared by dissolving 10 mg of the target reagent in 2 mL of diluted perchloric acid (10−1 mol L−1). The subsequent solution was heated at 70 °C for 30 seconds. After being heated, the sample was cooled down and diluted with water to a volume of 10 mL. Single-stranded calf thymus DNA (Cat. No. D-8899; Lot 43H67951) was used as it was received from Sigma-Alrich Brasil Ltda. A 500 μg DNA/mL stock solution (around 5 mg/10 mL, lyophilized powder containing 63% DNA) was prepared according to the procedure described for the ATP. The final solution was stored at 4 °C.
Procedure
A known volume (10 mL) of the supporting electrolyte solution (2.0 × 10⁻³ mol L−1 sodium hydroxide [with 1% v/v of ethylic alcohol]) was added to the voltammetric cell and degassed with nitrogen for 8 minutes (and for 60 seconds before each adsorptive stripping cycle). First, the condition potential (usually −0.9 V) was applied to the electrode for a selected amount of time (usually 60 seconds). Afterwards, the initial potential (usually −0.40 V) was applied to the electrode for a selected amount of time (usually 90 seconds). The solution was stirred slowly during this time. The stirring was stopped after 30 seconds, and the voltammogram was recorded by applying a negative-going potential scan. The scan (usually at 100 mV s−1) was stopped at −1.00 V, and the adsorptive stripping cycle was repeated with the same thin-film mercury. After the background stripping voltammograms were obtained, aliquots of the acyclovir standards were introduced. The entire procedure was automated, as controlled by 384-B Polarographic Analyzer. Throughout this operation, nitrogen was passed over the surface of the solution. All data were obtained at room temperature (25 °C).
Results and Discussion
Until now, few papers on the mechanism of electrode processes of guanine and acyclovir analogue for adsorption cathodic stripping voltammetry (ACSV) at the mercury electrode have been reported.26–28 In our paper, using a 2.0 × 10⁻³ mol L−1 NaOH solution containing 0.05 ppm of acyclovir after accumulation time (eg, 120 seconds) at −0.40 V, a well-defined cathodic stripping peak occurring at around −0.70 V was observed during scanning in the negative direction. From results obtained by electrochemical methods (such as differential-pulse, linear-scan and linear cyclic), we suggest that the following electrode reaction processes take place during the accumulation and stripping steps:
Accumulation process
Acyclovir(sol) → Acyclovir(ads)
Acyclovir(ads) + Hg → (Hg(II)Acyclovir2)Film
Stripping process
(Hg[II]Acyclovir2)Film + e− → (Hg[I]Acyclovir) + Acyclovir
(Hg[I]Acyclovir) + e− → Hg + Acyclovir
Parameters affecting the adsorptive stripping behavior
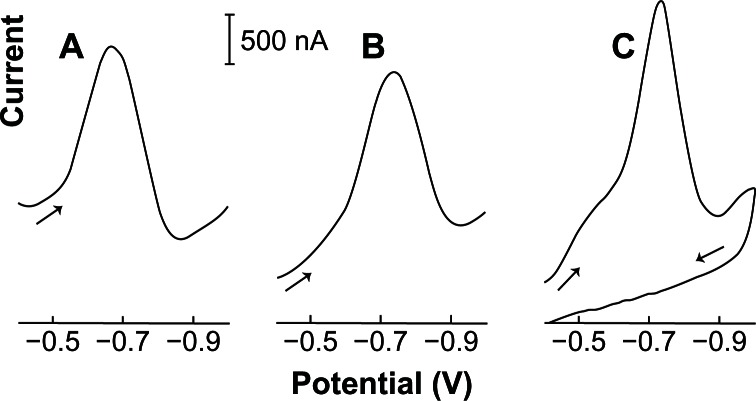
Figure 2 compares differential-pulse, linear-scan, and linear cyclic adsorptive stripping voltammograms for 0.05 ppm acyclovir in a 2.0 × 10⁻³ mol L−1 NaOH solution (with 1% v/v of ethylic alcohol) after 120 seconds of preconcentration, stirring at −0.40 V. A mercury film was used as a work electrode. After an equilibrium time of 30 s, the differential pulse (A) and linear (B) or cyclic cathodic voltammogram (C) was recorded at 50 (A) and 100 (B and C) mV s−1, respectively. Both scan modes offer excellent signal-to-background characteristics. Linear scans, however, offer a higher current peak and greater speed and are recommended for the determination of acyclovir. The acyclovir linear cyclic cathodic peak (Ip) appears at −0.72 V (Ep) with half-width (b½) of 120 mV. No anodic peak was observed in the first scan.
Figure 2.
Differential-pulse (A), linear-scan (B), and adsorptive linear cyclic (C) voltammograms of 0.05 ppm acyclovir in 2.0 × 10⁻³ mol L−1 NaOH (with 1% v/v of ethylic alcohol). Condition time, 60 seconds at −0.90 V; accumulation time, 120 seconds at −0.40 V with stirring; amplitude pulse, 50 mV (A); scan rate, 50 (A), 100 (B and C) mV s−1; thin-film mercury electrode (5 minutes at −0.9 V).
Other chemical and instrumental parameters such as the supporting electrolyte, pH, the accumulation potential and time, and the scan rate (which directly affects the acyclovir adsorptive stripping peak response) were also optimized. The adsorption properties of the acyclovir vary with the composition of the supporting electrolyte. Various electrolytes, for example, Briton-Robinson, phosphate and NaOH solution, were evaluated as suitable media for the adsorptive stripping measurement of acyclovir. The best results (with respect to signal enhancement and reproducibility) were obtained in the NaOH electrolyte. The adsorptive stripping signal of acyclovir depends on the sample pH. The dependence of the acyclovir peak current on the solution pH (from 2 to 12) was analyzed. The conditions utilized in this experiment were: 0.05 ppm acyclovir; conditions time, 60 seconds at −0.90 V; accumulation time, 90 seconds at −0.40 V; scan rate, 100 mV s−1; equilibrium time, 30 seconds; thin-film mercury electrode (5 minutes at −0.9 V). No response to acyclovir was observed in solutions more acidic than 5 (Ip = 0 nA). Increasing the pH level from 5.5 to 11 resulted in rapid increases in the acyclovir peak current. However, the stability of the acyclovir peak in aqueous solutions decreased when the pH was above 12. Because of this, a pH of approximately 12 (Ip = 1352 nA, Ep = −0.68 V; b½ = 110 mV) was used to satisfy the sensitivity and stability requirements throughout the experiment.
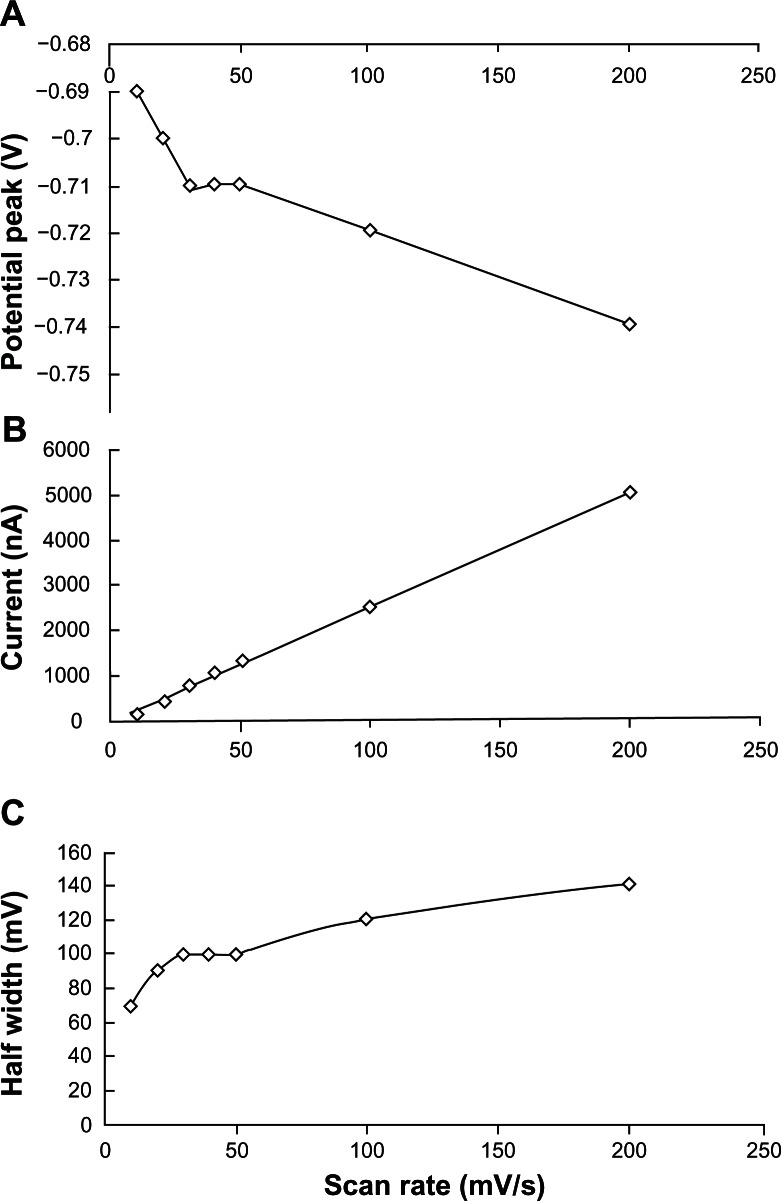
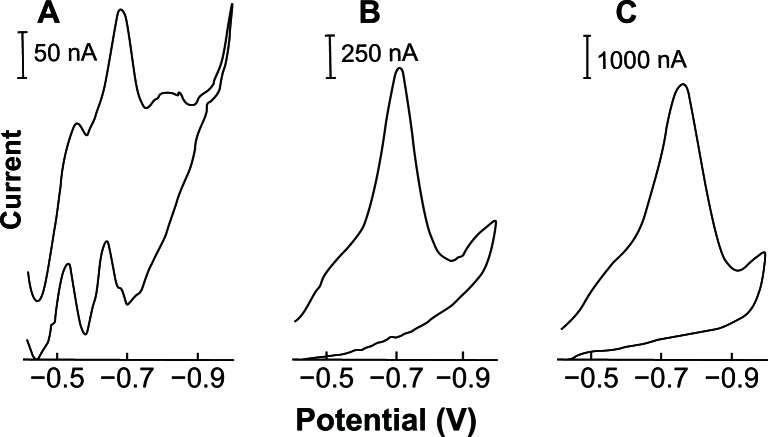
Figures 3 and 4 show a detailed study of the effect of the scan rate (from 10 to 200 mVs−1) on the stripping acyclovir voltammograms. Several parameters like the potential peak (Ep), the half-width (b½) and the current peak (Ip) were analyzed. A negative shift from −0.69 to −0.74 V of acyclovir potential peak was also observed. A very well-defined peak with the best current peak and half-width/background resolution was shown on a higher scan rate and was used throughout this study. With 200 mV s−1 of scan rate, the peak current for a 0.05 ppm acyclovir solution was about 37.3 times larger than the corresponding peak obtained with 10 mV s−1 response. Also at 10 mV s−1 several other instable acyclovir peaks were detected. A plot of Ip versus υ was linear (correlation coefficient, 0.999), with a slope of 25.0, over the 10–200 mV·s−1 range.
Figure 3.
Effect of scan rate on the potential (A), current (B) and half-width (C) acyclovir (0.05 ppm) peak in solution in 2.0 × 10⁻³ mol L−1 NaOH (with 1% v/v of ethylic alcohol).
Notes: Conditions: time, 60 seconds at −0.90 V; accumulation time, 90 seconds; equilibrium time, 30 seconds; thin-film mercury electrode (5 minutes at −0.9 V).
Figure 4.
Effect of scan rate at 10 (A), 50 (B) and 200 (C) mV s−1 on the linear cyclic adsorptive stripping voltammograms of 0.05 ppm acyclovir solution in 2.0 × 10⁻³ mol L−1 NaOH (with 1% v/v of ethylic alcohol).
Note: Other conditions same as Figure 3.
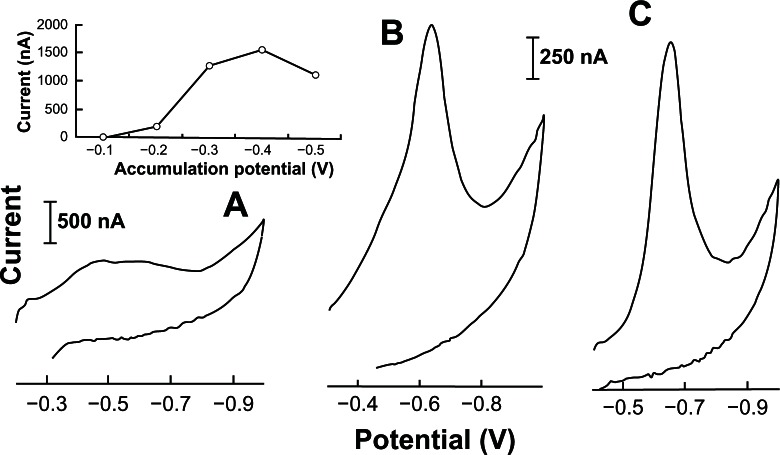
Figure 5 shows the effect of accumulation potential (from −0.10 to −0.50 V) on the stripping acyclovir voltammograms. Several parameters like the potential peak (Ep), the half-width (b½) and the current peak (Ip) were analyzed. When an accumulation potential of −0.40 V was used, a very well defined acyclovir peak (Ep) at −0.69 V (b½ = 110 mV; Ip = 1574 nA) with best half-width/background resolution was obtained. This accumulation potential at −0.40 V was then chosen and used throughout this study. No acyclovir peaks appeared when +0.05 to −0.10 V accumulation potential ranges were used.
Figure 5.
Effect of accumulation potential on the linear cyclic adsorptive stripping voltammograms of 0.05 ppm acyclovir solution in 2.0 ×10⁻³ mol L−1 NaOH (with 1% v/v of ethylic alcohol). Conditions: time, 60 seconds at −0.90 V; accumulation time, 90 seconds at −0.20 (A), −0.30 (B) and −0.40 (C) V; scan rate, 100 mV s−1; equilibrium time, 30 s; thin-film mercury electrode (5 minutes at −0.9 V).
Note: Also shown is the resulting of accumulation potential versus current acyclovir peak plot.
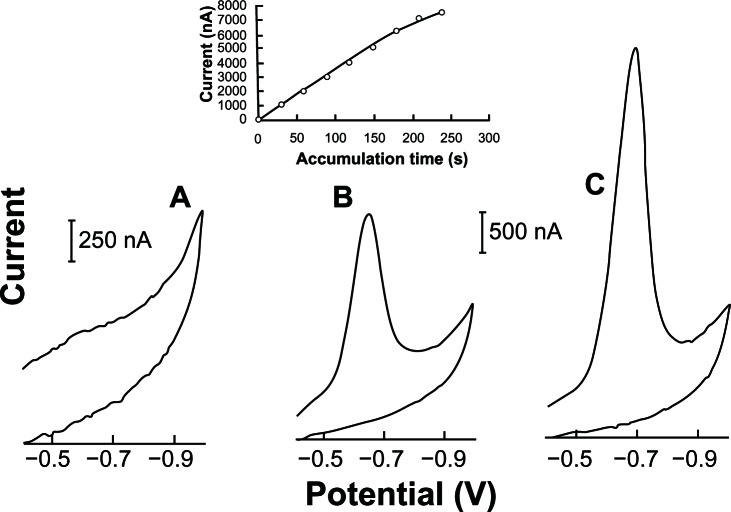
Figure 6 shows the dependence of the linear cyclic current peak a long with the pre-concentration time. With 240 s of preconcentration, the peak current for a 0.05 ppm acyclovir solution was about 10.1 times larger than the corresponding peak obtained with a direct (0 second) response. The resulting plot of peak current versus accumulation time (0–210 seconds) is linear (slope 33.63 nA s−1 and correlation coefficient, 0.999).
Figure 6.
Effects of accumulation time at −0.40 V on the linear cyclic adsorptive stripping voltammograms of 0.05 ppm of acyclovir in 2.0 × 10⁻³ mol L−1 NaOH (with 1% v/v of ethylic alcohol). The (A–C) curves are relative to accumulation times of 0, 60 and 120 seconds, respectively.
Notes: Condition time, 60 seconds at −0.90 V; scan rate, 100 mV s−1; equilibrium time, 30 seconds; thin-film mercury electrode (5 minutes at −0.9 V). Also shown is the resulting of accumulation time versus current acyclovir peak plot.
Quantitative utility
The effect of preconcentration associated with the adsorption process results in a significantly lower detection limit compared to the corresponding solution measurements. A detection limit of 0.42 ppb (1.0 × 10⁻⁹ mol L−1) was estimated from quantification of 0.01 ppm after a 4-minute accumulation (S/N = 2). Thus, 4.2 ng could be detected in the 10 mL of solution used.
The reproducibility was estimated by 10 successive measurements of a stirred 0.05 ppm acyclovir solution (other conditions: supporting electrolyte, 2.0 × 10⁻³ mol L−1 NaOH (with 1% v/v of ethylic alcohol); condition time, 60 seconds at −0.9 V; accumulation time, 90 seconds at −0.4 V; final potential, −1.0 V; scan rate, 100 mV s−1; equilibrium time, 30 seconds and thin-film mercury electrode). The mean peak current was 3430 nA with a range of 3370 to 3500 nA and a relative standard deviation of 4.1%. These measurements compare similarly with those reported for other compounds measured by adsorptive stripping analysis.19–25 The Ep and the b½ remain the same at −0.72 V and 130 mV, respectively.
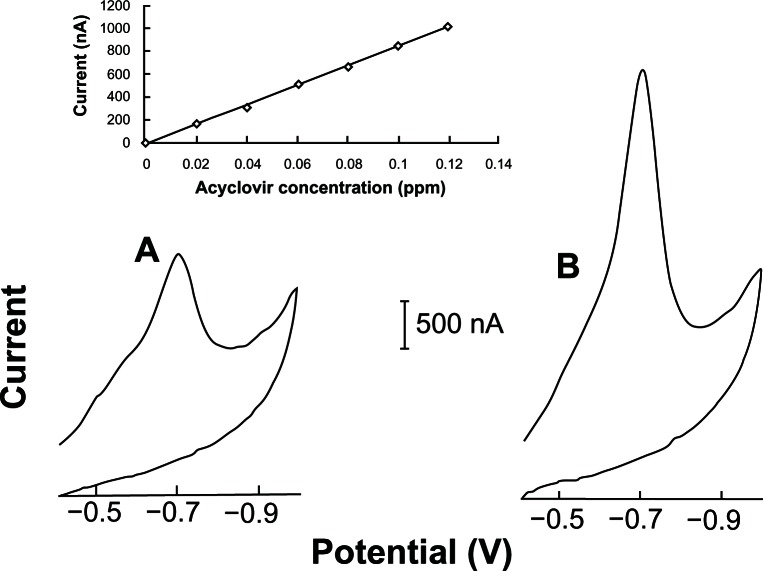
Figure 7 displays voltammograms for increasing acyclovir concentration (A,0.08 and B,0.16 ppm) after 60 seconds of accumulation. Well-defined stripping peaks (at −0.69 V) were observed between the 0.02 and 0.12 acyclovir concentration ranges. The resulting plot of peak current versus concentration is linear (slope 8334 nA/ppm; correlation coefficient, 0.999). Such linearity prevails as long as linear isotherm conditions (low surface coverage) exist. A separate experiment was performed to test linearity at the higher scan rate and accumulation time resulting in well-defined stripping peaks between 0.02 and 0.14 ppm acyclovir (accumulation time, 90 seconds; final potential, −1.0 V; scan rate, 100 mV s−1; other conditions same as in Fig. 7). The resulting plot of peak current versus concentration also showed linearity (slope 17141 nA/ppm; correlation coefficient, 0.999).
Figure 7.
Linear cyclic scan adsorptive stripping voltammograms obtained after increasing the acyclovir concentration in a solution of 2.0 × 10⁻³ mol L−1 NaOH (with 1% v/v of ethylic alcohol). The (A and B) curves are relative to 0.07 and 0.14 ppm of acyclovir concentration, respectively.
Notes: Accumulation time, 60 seconds at −0.40 V. Condition time, 60 seconds at −0.9 V. Scan rate, 50 mV s−1. Final potential at −1.0 V. Equilibrium time, 30 seconds. Thin-film mercury electrode (5 minutes at −0.9 V). Also shown is the resulting calibration curve plot (0.02–0.12 ppm).
To check interferences’ problems as the formation of complexes between the metal ions (cobalt II, nickel II, iron [III], lead [II], cadmium [II] and Copper [II]) and acyclovir or verify the presence of overlapping between the acyclovir and other antiretroviral drugs (didanosine, efavirenz, nevirapine, nelfinavir lamivudine and zidovudine), potential peak were studied these effects in the proposed method. Measurements of 0.05 ppm acyclovir (other conditions: supporting electrolyte, 2.0 × 10⁻³ mol L−1 NaOH [with 1% v/v of ethylic alcohol]; condition time, 60 seconds at −0.9 V; accumulation time, 90 seconds at −0.30 or −0.40 V; final potential, −1.0 V; scan rate, 100 mV s−1; equilibrium time, 30 seconds and thin-film mercury electrode) were not affected by the addition of up to 0.02 ppm of cobalt (II) or nickel (II); up to 0.04 ppm of iron (III) or lead (II); up to 0.06 ppm of cadmium (II) or copper (II) or up to 0.10 ppm of zinc (II). The acyclovir peak increase in the presence of higher nickel (II) or cobalt (II) concentration indicates a possible formation of a Ni or Co-acyclovir complex. The presence of higher iron (III) concentration in acyclovir solution presents a new and well-defined peak at −0.55 V, and the characteristic acyclovir peak is displaced from −0.72 to −0.80 V (Fig. 8).
Figure 8.
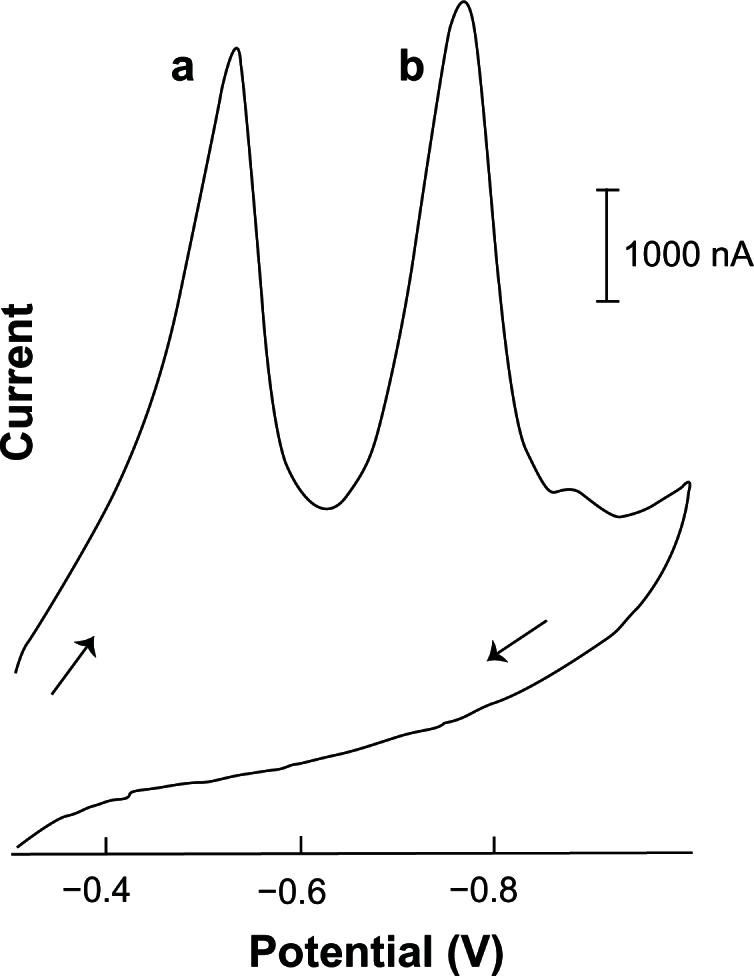
Linear cyclic adsorptive stripping voltammogram of acyclovir (0.05 ppm) in the presence of iron (III) (0.10 ppm) in a solution of 2.0 × 10⁻³ mol L−1 NaOH (with 1% v/v of ethylic alcohol).
Notes: Accumulation time, 90 seconds at −0.30 V. Condition time, 60 seconds at −0.9 V. Scan rate, 100 mV s−1. Final potential at −1.0 V. Equilibrium time, 30 seconds. Thin-film mercury electrode (5 minutes at −0.9 V). (a) Fe-acylovir peak. (b) Characteristic acyclovir peak.
Preliminary studies were developed for the determination of acyclovir in the presence of other antiretroviral drugs for the treatment of human immunodeficiency virus (HIV): didanosine, efavirenz, nevirapine, nelfinavir, lamivudine, and zidovudine. Measurements of 0.05 ppm acyclovir (other conditions: supporting electrolyte, 2.0 × 10⁻³ mol L−1 NaOH [with 1% v/v of ethylic alcohol]; condition time, 60 seconds at −0.9 V; accumulation time, 90 seconds at −0.40 V; final potential, −1.0 V; scan rate, 100 mV s−1; equilibrium time, 30 seconds and thin-film mercury electrode) were not affected by the addition of up to 0.08 ppm of didanosine or up to 0.10 ppm of zidovudine, efavirenz, lamivudine, nelfinavir, or nevirapine.
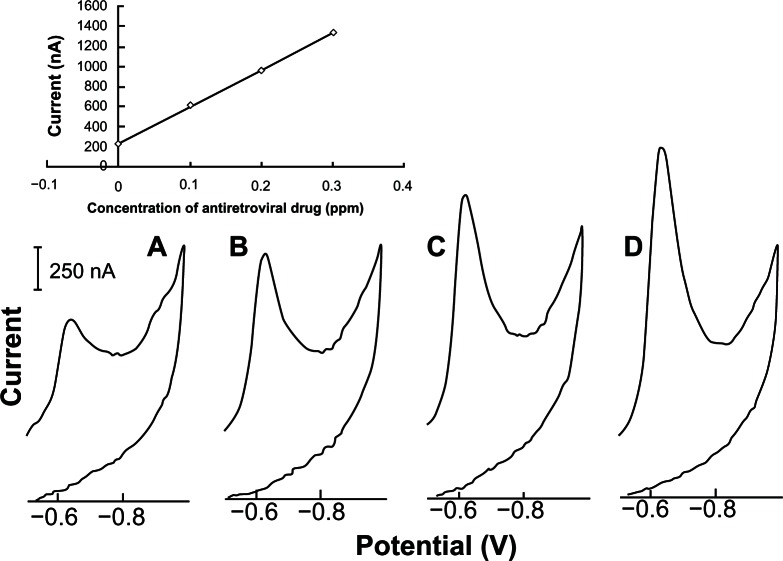
Figure 9 illustrates how this method is suitable for the determination of acyclovir through linear cyclic adsorptive stripping voltammetry in a synthetic sample that contains several antiretroviral drugs (efavirenz, nevirapine, didanosine, lamivudine, zidovudine, and acyclovir, all with 2.0 ppm of concentration). In an electrochemistry cell with supporting electrolyte and small aliquot of the mixed sample was successively added 0.1 ppm of standard acyclovir solution. Well-defined linear cyclic adsorptive stripping voltamograms were obtained (Fig. 9), presenting increasing current peak at the same potential. As the new proposed method is very sensitive to acyclovir, only 60 seconds of preconcentration were used. The analytical procedure was performed 5 times obtaining an average value of 2.8 ppm with a standard deviation of 0.5 ppm. The yield in this experiment is somewhat different from the value of 2.0 ppm of acyclovir.
Figure 9.
Illustration of acyclovir determination in a synthetic sample contain several antiretroviral drugs (efavirenz, nevirapine, didanosine, lamivudine, zidovudine. and acyclovir, all with 2 ppm of concentration) by linear cyclic adsorptive stripping voltammetry. Supporting electrolyte, 10 mL of 2.0 × 10⁻³ mol L−1 NaOH. (A) addition of 200 μL of synthetic sample; (B–D) at each was an addition of 0.1 ppm of standard acyclovir.
Note: Condition time, 60 seconds at −0.9 V. Accumulation time, 60 seconds at −0.50 V. Potential final, −1.0 V. Scan rate, 100 mV s−1. Equilibrium time, 30 seconds. Thin-film mercury electrode (5 minutes at −0.9 V).
Another functions these preliminary studies is to examine the determination of acyclovir in the presence of ATP and DNA. The current measurements of 0.05 ppm acyclovir (other conditions: supporting electrolyte, 2.0 × 10⁻³ mol L−1 NaOH [with 1% v/v of ethylic alcohol]; condition time, 60 seconds at −0.9 V; accumulation time, 90 seconds at −0.4 V; final potential, −1.0 V; scan rate, 100 mV s−1; equilibrium time, 30 seconds and thin-film mercury electrode) were not affected by the addition of up to 0.06 ppm of ATP and up to 0.10 ppm of DNA. Using the accumulation potential at −0.30 V the DNA (0.08 ppm) in the presence of copper (II) (0.10 ppm) shows one peak at the same location as the acyclovir peak at −0.67 V.22
Conclusions
This paper has thoroughly described an effective means for the determination of trace levels of acyclovir. The use of the simple and diluted alkaline electrolytes provided a sensitive and selective adsorptive stripping voltammetric method for acyclovir determination. Studies of interferences indicate the possible determination of acyclovir in the presence of other antiretroviral drugs for the treatment of human immunodeficiency virus (HIV), such as didanosine, efavirenz, nevirapine, nelfinavir, lamivudine, and zidovudine. The acyclovir peak increases in the presence of higher nickel (II) or cobalt (II) concentration, indicating a possible formation of Ni or Co-acyclovir complex. In particular, this approach offers similar efficiency as compared with chromatographic methods.3–7 The behavior of the acyclovir peak is similar to the DNA-copper peak.22 Also, further studies using diluted alkaline solution as the supporting electrolyte and film mercury electrode modified in situ by metallic ions can be used for detection of other drugs and DNA-intercalating dyes, as well as amino acids, peptides, and proteins determinations.
Acknowledgments
The authors gratefully acknowledge the CAPES-Brazil and MES-Cuba for their support of this work. In addition, we thank Dr. Katia Cristina Leandro of Fundação Oswaldo Cruz for generously supplying the sample of acyclovir.
Footnotes
Author Contributions
Conceived and designed the experiments: AAC, AIPC, PAMF. Analyzed the data: AAC, AIPC, PAMF. Wrote the first draft of the manuscript: AAC, AIPC, PAMF. Contributed to the writing of the manuscript: AAC, AIPC, PAMF. Agree with manuscript results and conclusions: AAC, AIPC, PAMF. Jointly developed the structure and arguments for the paper: AAC, AIPC, PAMF. Made critical revisions and approved final version: AAC, AIPC, PAMF. All authors reviewed and approved of the final manuscript.
Funding
Author(s) disclose no funding sources.
Competing Interests
Author(s) disclose no potential conflicts of interest.
Disclosures and Ethics
As a requirement of publication the authors have provided signed confirmation of their compliance with ethical and legal obligations including but not limited to compliance with ICMJE authorship and competing interests guidelines, that the article is neither under consideration for publication nor published elsewhere, of their compliance with legal and ethical guidelines concerning human and animal research participants (if applicable), and that permission has been obtained for reproduction of any copyrighted material. This article was subject to blind, independent, expert peer review. The reviewers reported no competing interests.
References
- 1.De Clercq E, Field HJ. Antiviral prodrugs—the development of successful prodrug strategies for antiviral chemotherapy. Br J Pharmacol. 2006;147(1):1–11. doi: 10.1038/sj.bjp.0706446. [DOI] [PMC free article] [PubMed] [Google Scholar]
- 2.Yu LY, Xiang BR. Quantitative determination of acyclovir in plasma by near infrared spectroscopy. Microchem J. 2008;90(1):63–6. [Google Scholar]
- 3.Weller DR, Balfour HH, Jr, Vezina HE. Simultaneous determination of acyclovir, ganciclovir, and (R)-9-[4-hydroxy-2-(hydroxymethyl)butyl]guanine in human plasma using high-performance liquid chromatography. Biomed Chromatogr. 2009;23(8):822–7. doi: 10.1002/bmc.1192. [DOI] [PMC free article] [PubMed] [Google Scholar]
- 4.Yadav M, Upadhyay V, Singhal P, Goswami S, Pranav S. Stability evaluation and sensitive determination of antiviral drug, valacyclovir and its metabolite acyclovir in human plasma by a rapid liquid chromatography-tandem mass spectrometry method. J Chromatogr B Analyt Technol Biomed Life Sci. 2009;877(8–9):680–8. doi: 10.1016/j.jchromb.2009.01.042. [DOI] [PubMed] [Google Scholar]
- 5.Sasanya JJ, Abd-Alla AMM, Parker AG, Cannavan A. Analysis of the antiviral drugs acyclovir and valacyclovir-hydrochloride in tsetse flies (Glossina pallidipes) using LC-MSMS. J Chromatogr B Analyt Technol Biomed Life Sci. 2010;878(26):2384–90. doi: 10.1016/j.jchromb.2010.07.008. [DOI] [PubMed] [Google Scholar]
- 6.Sharma M, Nautiyal P, Jain A, Jain D. Simple and rapid RP-HPLC method for simultaneous determination of acyclovir and zidovudine in human plasma. J AOAC Int. 2010;93(5):1462–7. [PubMed] [Google Scholar]
- 7.Hasan S, Chander P, Ali J, Baboota S, Ali M. A new validated ultra performance liquid chromatographic method for determination of acyclovir. Drug Test Anal. 2011;3(3):187–90. doi: 10.1002/dta.201. [DOI] [PubMed] [Google Scholar]
- 8.Lv J, Luo LR, Zhang ZJ. On-line galvanic cell generated electrochemiluminescence determination of acyclovir based on the flow injection sampling. Analytica Chimica Acta. 2004;510(1):35–9. [Google Scholar]
- 9.Wang NN, Tang YH, Xiong XY, Han XN, Yu CL. xA new flow-injection chemiluminescence method for the determination of acyclovir and gancyclovir. Anal Lett. 2006;39(5):973–83. [Google Scholar]
- 10.Mustafa AA, Abdel-Fattah SA, Toubar SS, Sultan MA. Spectrophotometric determination of acyclovir and amantadine hydrochloride through metals complexation. J Anal Chem. 2004;59(1):33–8. [Google Scholar]
- 11.El-Din MKS, El-Brashy AM, Sheribah ZA, El-Gamal RM. Spectrophotometric determination of acyclovir and ribavirin in their dosage forms. J AOAC Int. 2006;89(3):631–41. [PubMed] [Google Scholar]
- 12.Ayad MM, Abdellatef HE, El-Henawee MM, El-Sayed HM. Spectrophotometric and spectrofluorimetric methods for analysis of acyclovir and acebutolol hydrochloride. Spectrochim Acta A Mol Biomol Spectrosc. 2007;66(1):106–10. doi: 10.1016/j.saa.2006.02.031. [DOI] [PubMed] [Google Scholar]
- 13.AlvarezLueje A, NunezVergara LJ, Vicuna M, Squella JA. Acyclovir: Voltammetric behaviour and analytical application to pharmaceutical forms. Bol Soc Chil Quim. 1996;41:301–6. [Google Scholar]
- 14.Wang F, Chen L, Chen XX, Hu SS. Studies on electrochemical behaviors of acyclovir and its voltammetric determination with nano-structured film electrode. Analytica Chimica Acta. 2006;576(1):17–22. doi: 10.1016/j.aca.2005.12.023. [DOI] [PubMed] [Google Scholar]
- 15.Sheribah ZA, El-Brashy AM, El-Gamal RM. Stability-indicating polarographic determination of acyclovir through chelation with nickel (II) J AOAC Int. 2009;92(2):419–27. [PubMed] [Google Scholar]
- 16.Heli H, Zarghan M, Jabbari A, Parsaei A, Moosavi-Movahedi AA. Electrocatalytic oxidation of the antiviral drug acyclovir on a copper nanoparticles-modified carbon paste electrode. J Solid State Electr. 2010;14(5):787–95. [Google Scholar]
- 17.Heli H, Pourbahman F, Sattarahmady N. Nanoporous nickel microspheres: synthesis and application for the electrocatalytic oxidation and determination of acyclovir. Anal Sci. 2012;28(5):503–10. doi: 10.2116/analsci.28.503. [DOI] [PubMed] [Google Scholar]
- 18.Sadikoglu M, Saglikoglu G, Yagmur S, Orta E, Yilmaz S. Voltammetric determination of acyclovir in human urine using ultra trace graphite and glassy carbon electrodes. Current Analytical Chemistry. 2011;7(2):130–5. [Google Scholar]
- 19.Farias PAM, Wagener A de LR, Castro AA. Adsorptive voltammetric behavior of adenine in presence of guanine and some trace elements at the static mercury drop electrode. Anal Lett. 2001;34(12):2125–40. [Google Scholar]
- 20.Farias PAM, Wagener A de LR, Castro AA. Adsorptive voltammetric behavior of thymine in presence of guanine at the static mercury drop electrode. Anal Lett. 2001;34(8):1295–310. [Google Scholar]
- 21.Farias PAM, Wagener A de LR, Junqueira AA, Castro AA. Adsorptive stripping voltammetric behavior of adenosine triphosphate (ATP) in presence of copper at the mercury film electrode. Anal Lett. 2007;40(9):1779–90. [Google Scholar]
- 22.Farias PAM, Castro AA, Wagener A de LR, Junqueira AA. DNA determination in the presence of copper in diluted alkaline electrolyte by adsorptive stripping voltammetry at the mercury film electrode. Electroanalysis. 2007;19(11):1207–12. [Google Scholar]
- 23.Castro AA, de Souza MVN, Rey NA, Farias PAM. Determination of efavirenz in diluted alkaline electrolyte by cathodic adsorptive stripping voltammetry at the mercury film electrode. J Braz Chem Soc. 2011;22(9):1662–68. [Google Scholar]
- 24.Cordoves AIP, Farias PAM. Determination of the antiviral drug oseltamivir (Tamiflu) by adsorptive stripping voltammetry. Current Pharmaceutical Analysis. 2011;7(2):71–8. [Google Scholar]
- 25.Castro AA, Aucelio RQ, Rey NA, Miguel EM, Farias PAM. Determination of the antirretroviral drug nevirapine in diluted alcaline electrolyte by adsorptive stripping voltammetry at the Mercury film electrode. Comb Chem High T Scr. 2011;14(1):22–7. doi: 10.2174/1386207311107010022. [DOI] [PubMed] [Google Scholar]
- 26.Sun XX, Chi YM, Chen HY. Electrochemical-Behavior of guanine and its determination by differential-pulse adsorption stripping voltammetry. Microchem J. 1993;47(3):287–95. [Google Scholar]
- 27.Skrzypek S, Nosal-Wiercinska A, Ciesielski W. Electrochemical studies of ganciclovir as the adsorbed catalyst on mercury electrode. Collect Czech Chem C. 2009;74(10):1455–66. [Google Scholar]
- 28.Skrzypek S. Electrode mechanism and voltammetric determination of selected guanidino compounds. Central European Journal of Chemistry. 2012;10(4):977–88. [Google Scholar]


