SUMMARY
Goats and other quadrupeds must modulate the work output of their muscles to accommodate the changing mechanical demands associated with locomotion in their natural environments. This study examined which hindlimb joint moments goats use to generate and absorb mechanical energy on level and sloped surfaces over a range of locomotor speeds. Ground reaction forces and the three-dimensional locations of joint markers were recorded as goats walked, trotted and galloped over 0, +15 and −15 deg sloped surfaces. Net joint moments, powers and work were estimated at the goats' hip, knee, ankle and metatarsophalangeal joints throughout the stance phase via inverse dynamics calculations. Differences in locomotor speed on the level, inclined and declined surfaces were characterized and accounted for by fitting regression equations to the joint moment, power and work data plotted versus non-dimensionalized speed. During level locomotion, the net work generated by moments at each of the hindlimb joints was small (less than 0.1 J kg−1 body mass) and did not vary substantially with gait or locomotor speed. During uphill running, by contrast, mechanical energy was generated at the hip, knee and ankle, and the net work at each of these joints increased dramatically with speed (P<0.05). The greatest increases in positive joint work occurred at the hip and ankle. During downhill running, mechanical energy was decreased in two main ways: goats generated larger knee extension moments in the first half of stance, absorbing energy as the knee flexed, and goats generated smaller ankle extension moments in the second half of stance, delivering less energy. The goats' hip extension moment in mid-stance was also diminished, contributing to the decrease in energy. These analyses offer new insight into quadrupedal locomotion, clarifying how the moments generated by hindlimb muscles modulate mechanical energy at different locomotor speeds and grades, as needed to accommodate the demands of variable terrain.
KEY WORDS: locomotion, quadruped, biomechanics, inverse dynamics, joint moment, joint work
INTRODUCTION
Terrestrial animals are exceptionally skilled at moving across diverse terrain, yet the neuromotor strategies evolved to accommodate the varying mechanical demands of the environment are not well understood. Running steadily uphill requires an increase in net muscle work to increase the potential energy of the body with each stride. Running downhill decreases the potential energy of the body with each stride. How does an animal modulate the work of its muscles to walk, trot or gallop efficiently over sloping, uneven terrain? Do the strategies used by animals to increase or decrease mechanical energy of the body depend on gait or locomotor speed? This study explored the answers to such questions by comparing the net joint moments and the positive, negative and net joint work generated by the hindlimb muscles of goats (Capra hircus, a species adapted to mountainous terrain) during walking, trotting and galloping over level, inclined and declined surfaces.
Changes in muscle work with surface grade have been examined for a limited set of muscles in vivo. Fascicle length changes, and in some cases muscle–tendon forces, have been measured in running birds (e.g. Daley and Biewener, 2003; Gabaldón et al., 2004; Higham and Biewener, 2008; Roberts et al., 2007), hopping wallabies (Biewener et al., 2004; McGowan et al., 2007), walking cats (Maas et al., 2009), trotting horses (Wickler et al., 2005), walking and running rats (Gillis and Biewener, 2002) and goats (McGuigan et al., 2009). These studies have yielded two key observations. First, the work output of an individual muscle can change dramatically on sloping terrain. In wild turkeys, for instance, an ankle extensor that produces negligible net work during level running (lateral gastrocnemius) has been shown to generate substantial positive net work during uphill running and to absorb work during downhill running, over a range of speeds (Gabaldón et al., 2004). Second, on inclined terrain, increases in the work output of distal muscles alone may be insufficient to raise the body's center of mass (e.g. Daley and Biewener, 2003; McGuigan et al., 2009). When goats trot uphill, for example, the fascicle shortening strain and the peak tendon stress of the ankle extensors increase – yet these muscles produce only about 3% of the work needed to raise the body's center of mass (McGuigan et al., 2009). In hopping wallabies, the lateral gastrocnemius produces relatively low levels of net work regardless of surface grade (Biewener et al., 2004), while the biceps femoris shortens more on an upslope than on level ground, contributing substantially to the net increase in work (McGowan et al., 2007). Measures of muscle blood flow in guinea fowl have indicated, similarly, that proximal stance-phase muscles increase their mass-specific energy use more than distal muscles while running uphill (Rubenson et al., 2006). Collectively, these studies provide compelling evidence that animals strategically modulate the work output of individual muscles to accommodate sloped terrain. However, these studies alone cannot explain how mechanical energy of the body is modulated by an animal's limbs as a whole, or how groups of muscles are recruited to meet the demands of the environment. Are the increases in joint work with grade due to an increase in energy generation or a decrease in energy absorption, or both? Are the same or different muscles used to generate/absorb energy when animals ascend/descend terrain at different speeds? To complement in vivo studies, inverse dynamics analyses are needed that can quantify the net moments at each joint and explain how energy is generated or absorbed at different speeds and grades.
Little is known about the modulation of joint moments and work during quadrupedal locomotion at different speeds and grades. A few biomechanical studies of cats (e.g. Gregor et al., 2006), dogs (Lee, 2011), goats (Lee et al., 2008) and other animals (e.g. Dutto et al., 2004; Lammers et al., 2006) on sloped surfaces have been reported. These studies have confirmed, for example, that ground reaction forces (GRFs) are re-distributed between the forelimbs and hindlimbs with changes in surface grade; the forelimbs typically provide increased support and braking on a downslope, while the hindlimbs provide increased support and propulsion on an upslope (e.g. Dutto et al., 2004; Gregor et al., 2006; Lammers et al., 2006; Lee, 2011). Cats have been shown to generate increased extension moments at the hip, knee and ankle when walking on an upslope and decreased moments at the hip and ankle when walking on a downslope (Gregor et al., 2006), which is consistent with re-distribution of the GRFs and re-orientation of the resultant force vectors. However, the extent to which these changes in the joint moments contribute to changes in mechanical energy was not investigated, and how these contributions vary with gait or speed is unknown. A previous analysis of the net external (ground reaction) moments and work at the knee and ankle has provided some evidence that goats actively modulate joint work with surface grade; in particular, measurements on three goats showed that muscular moments at the knee and ankle contributed more positive work during uphill running and more negative work during downhill running then they did during level running (Lee et al., 2008). In another study on goats, Gillis and colleagues measured patterns of strain and activation in the biceps femoris and vastus lateralis muscles during level locomotion and showed that the amount of fascicle stretching and shortening (and presumably fascicle work) varied depending on locomotor speed (Gillis et al., 2005). Our ongoing research builds upon and extends these previous studies.
In the current study, we conducted an inverse dynamics analysis on goats to test three hypotheses. First, we hypothesized that when goats run on differently sloped surfaces at different speeds, hindlimb joint work is modulated more on an upslope than on a downslope. Second, we hypothesized that hindlimb joint work is modulated more at faster than at slower locomotor speeds. And third, we hypothesized that hindlimb joint work is modulated more at the hip than at distal joints. We hypothesized that goats modulate hindlimb joint work more on an upslope than on a downslope as GRFs from the hindlimbs contribute proportionally more to propulsion when running uphill than when running downhill at comparable speeds. We hypothesized that goats modulate hindlimb joint work to a greater extent at faster locomotor speeds assuming that goats generate greater net moments to support and propel the body at faster speeds. We hypothesized that goats modulate hindlimb joint work more at the hip than at distal joints based on the musculotendon architecture of the distal muscles (i.e. pennate muscles with long tendons) and on previous studies of accelerating dogs (Williams et al., 2009) and goats running over different grades (Lee et al., 2008; McGuigan et al., 2009). Notably, McGuigan and colleagues estimated that the gastrocnemius and superficial digital flexor muscles produce only about 3% of the work needed to raise the goat's center of mass when trotting uphill (McGuigan et al., 2009), while Lee and colleagues reported that the increase in net work at the ankle, from level to uphill running, is typically greater than the increase in work at the knee (Lee et al., 2008). Muscles that generate moments about the hip, therefore, are inferred to play an important role. Our new analysis extends previous studies by quantifying joint work at the hip, in addition to work at other joints, and by rigorously differentiating the effects of grade from the (potentially confounding) effects of gait and locomotor speed. To test our hypotheses, we compared the time-varying patterns of net joint moments, powers and work generated at the hip, knee (stifle), ankle (hock) and metatarsophalangeal (MTP) joints during walking, trotting and galloping over 0, +15 and −15 deg sloped surfaces. We examined changes in the goats' joint angular excursions, as well as changes in the net joint moments, to assess this quadruped's strategy for modulating mechanical work during the stance phase over a range of gaits, speeds and grades. We studied goats because these animals are well adapted for locomotion on sloped, mountainous terrain.
MATERIALS AND METHODS
Animals
Seven healthy African pygmy goats (C. hircus L.) were selected from a breeding colony maintained by the Concord Field Station at Harvard University. Five females and two males, with body masses ranging from 14.1 to 53.0 kg (mean 26.2±5.0 kg), were included in this study. During the first of two test sessions, the animals ran over a level, 10 m indoor runway with a hard rubber surface. During the second test session, the animals ran over a sloped, 8 m outdoor runway with a packed soil surface and a 15 deg grade. Four of the goats were tested on both runways; three goats were tested on the level runway only. The goats were prompted to traverse the length of the runway by audible cues and by being chased. These strategies were usually sufficient to elicit transverse galloping and trotting; therefore, only minimal training was required for these experiments. Between trials, goats were allowed to rest for at least 2 min. A total of 40–60 trials were collected during each test session, and many of these trials met our inclusion criteria for this analysis (see below). A subset of the data from three goats was analyzed independently and is published elsewhere (Lee et al., 2008). All animal procedures were approved by the Institutional Animal Care and Use Committee at Harvard University.
Experimental data
GRFs and the three-dimensional locations of markers placed bilaterally over the goats' hindlimbs at joint centers and bony landmarks (see below) were recorded during galloping, trotting and walking, and these measures were used to estimate the goats' net joint moments, powers and work. Trials were excluded from inverse dynamics analysis if neither of the goat's hindlimbs contacted a force platform cleanly or if the animal did not maintain a sufficiently steady speed in the plane of the runway during the recorded portion of the trial (i.e. fluctuations in speed >15% of the mean speed for the trial were excluded). On the level runway, 75 trials from 7 animals (ranging from 5 to 17 trials per animal) met our criteria for analysis. On the sloped runway, 25 incline trials from 4 animals and 17 decline trials from 3 animals (ranging from 2 to 9 trials per animal) also met our criteria for analysis.
Pairs of force platforms were used to record the goats' three-dimensional GRFs and moments, as described previously (Lee et al., 2008). One pair of force platforms (0.4×0.6 m, Kistler 9286AA, Kistler Instruments Corp., Amherst, NY, USA) was embedded end-to-end along the level, indoor runway. A second pair of force platforms (0.4×0.6 m, AMTI BP400600HF, Advanced Mechanical Technology Inc., Watertown, MA, USA) was embedded end-to-end along the sloped, outdoor runway. Each force platform was mounted flush with the ground midway along the runway and covered with traction tape. During the experiments, the goats' GRFs and moments were recorded in the vertical, fore–aft, and medial–lateral directions. Force signals from the indoor runway were amplified, digitized and recorded using a BioWare A/D System (2812A1-3, Kistler Instruments Corp.) and BioWare v3.0 software. Force signals from the outdoor runway were amplified using strain gauge amplifiers (MSA-6, Advanced Mechanical Technology, Inc.) and were recorded using a 16-bit A/D card (6036E, National Instruments, Inc., Austin, TX, USA) and custom data acquisition code (in LabView v7.1, National Instruments, Inc.). All force signals were sampled at 2400 Hz, and the center of pressure was determined from these measurements. During post-processing, the vertical and fore–aft components of the hindlimb forces were digitally filtered using a zero-phase, fourth-order Butterworth filter (Matlab Signal Processing Toolbox, The MathWorks, Inc., Natick, MA, USA). Two different cut-off frequencies were used: 15 Hz (which is consistent with our processing of the kinematic data and appropriate for inverse dynamics analysis) and 100 Hz (which is appropriate for analyzing the GRFs alone). Sensitivity studies were conducted to assess how the choice of cut-off frequency influenced our estimates of the joint moments and work. The mediolateral component of the GRF was generally small and was neglected for the purposes of this study.
Motions of the hindlimb segments were quantified by tracking the three-dimensional locations of markers secured over the joints. The joint centers of rotation were palpated, and the goats' limbs were shaved, as needed, using small animal clippers. Positions of the hip, knee, ankle and metatarsophalangeal (MTP) joints were marked, bilaterally, using polystyrene hemispheres covered with retroreflective tape (7610WS sheeting, 3M Corp., St Paul, MN, USA). Additional markers were secured over the lateral surface of each hoof and over the anterolateral tip of each iliac crest. Marker locations were tracked at 240 Hz using three infrared cameras (Qualisys ProReflex MCUs, Qualisys AB, Gothenberg, Sweden) and Qualisys Track Manager software (QTM v1.6, Qualisys AB). These data were synchronized with the measured forces using a manual pretrigger from the motion capture system, and they were recorded in a global reference frame aligned with the force platforms. During post-processing, the raw marker coordinates were smoothed using a zero-phase, fourth-order Butterworth filter with a cut-off frequency of 80 Hz (Matlab Signal Processing Toolbox, The MathWorks, Inc.). To correct for skin motion artifacts at the knee, an optimization algorithm was implemented to adjust the coordinates of the knee marker in the sagittal plane. We constrained the knee marker to lie along the intersection of two spheres, one centered at the hip marker with a radius equal to the thigh length, and one centered at the ankle marker with a radius equal to the shank length. We solved this system of non-linear equations, at each sample point, using the measured coordinates of the knee marker as the initial guess (Matlab Optimization Toolbox, The MathWorks, Inc.).
Analysis of net joint moments, power and work
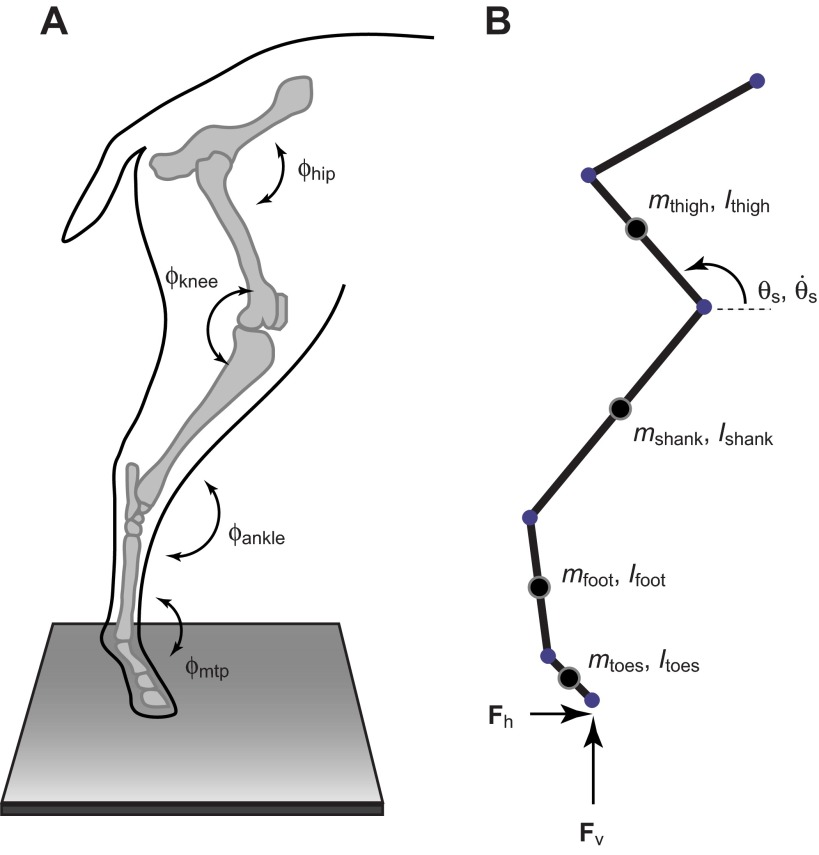
We used the hindlimb GRFs and marker coordinates, together with a four-segment model of the goat hindlimb (Fig. 1), to calculate net moments about the goats' MTP, ankle, knee and hip joints in the sagittal plane (e.g. Winter, 1983). To facilitate this analysis, we re-sampled the force and marker data at every 0.5% of the stance phase, normalizing the stance phase duration to 100% for all speeds and gaits. We determined the duration of the stance phase, for each recorded footfall, from the vertical GRF. Specifically, we defined stance phase as the period of ground contact during which the vertical force exceeded 4% of the peak force normalized by body weight (BW). We calculated the positions and orientations of the hindlimb segments from relevant markers. Angular excursions of the segments were smoothed using a zero-phase, second-order Butterworth filter with a cut-off frequency of 15 Hz. The angular velocities and accelerations of the segments, and the joint angles between adjacent segments, were estimated from these data. The masses, mass centers and moments of inertia of each segment were estimated by scaling the measurements determined experimentally on a cadaveric specimen (Table 1), based on the relative body mass and segment lengths of each goat. The net power at each joint was calculated by multiplying the net joint moment by the joint angular velocity. The net work at each joint was calculated by integrating the net joint power curve with respect to time. By convention, net extension moments are positive (balanced by extensor musculature) and net flexion moments are negative (balanced by flexor musculature). Positive work represents mechanical energy generated by muscles and tendons, and negative work represents mechanical energy absorbed by muscles and tendons. To enable comparisons across animals, the joint moments, powers and work were normalized to body mass.
Fig. 1.
Schematic diagram of the linked segment model used to calculate joint angles, moments, power and work. Angles (ϕj) at the hip, knee, ankle and metatarsophalangeal (MTP) joints were determined from the relative orientations of adjacent segments (A). Net joint moments were calculated by applying the measured vertical and horizontal ground reaction forces (GRFs: Fv and Fh) to a four-segment, sagittal-plane model of the goat hindlimb (B). The masses and moments of inertia of each segment (ms and Is) were scaled to the anthropometric dimensions of each goat based on experimental data from one goat of known size and body mass. Joint moments and powers were estimated at segment angles and angular velocities (e.g.  and
and  ) throughout the stance phase. The model shows the trailing limb of a galloping goat at 75% of the stance phase.
Table 1.
Morphometric data used to estimate segment mass and inertial properties

Comparisons of data across gaits, speeds and grades
We assessed the animals' capacity to modulate joint moments, powers and work during locomotion in two ways. First, we categorized each trial as a walk, trot, trailing-limb gallop or leading-limb gallop on a level, inclined or declined surface. We averaged the joint angles, moments and powers across corresponding trials for each hindlimb of each goat, and we averaged the data across goats (after normalizing by body mass) to obtain representative curves over the stance phase. These averaged data enabled us to qualitatively assess, for example, differences in the joint moments during walking, trotting and galloping, as well as time-varying changes in these moments over the stance phase.
Second, we quantitatively compared the goats' peak joint extension moments, powers and work on the level and sloped surfaces while accounting for differences in locomotor speed. This analysis involved several steps. Our first step was to calculate, for each recorded footfall, the animal's non-dimensionalized speed. We estimated the animal's average forward velocity over the stance phase from the coordinates of the ilium markers. We converted this average velocity, v, to a non-dimensionalized speed,  , based on the animal's hip height at mid-stance, l, and the acceleration due to gravity, g:
| (1) |
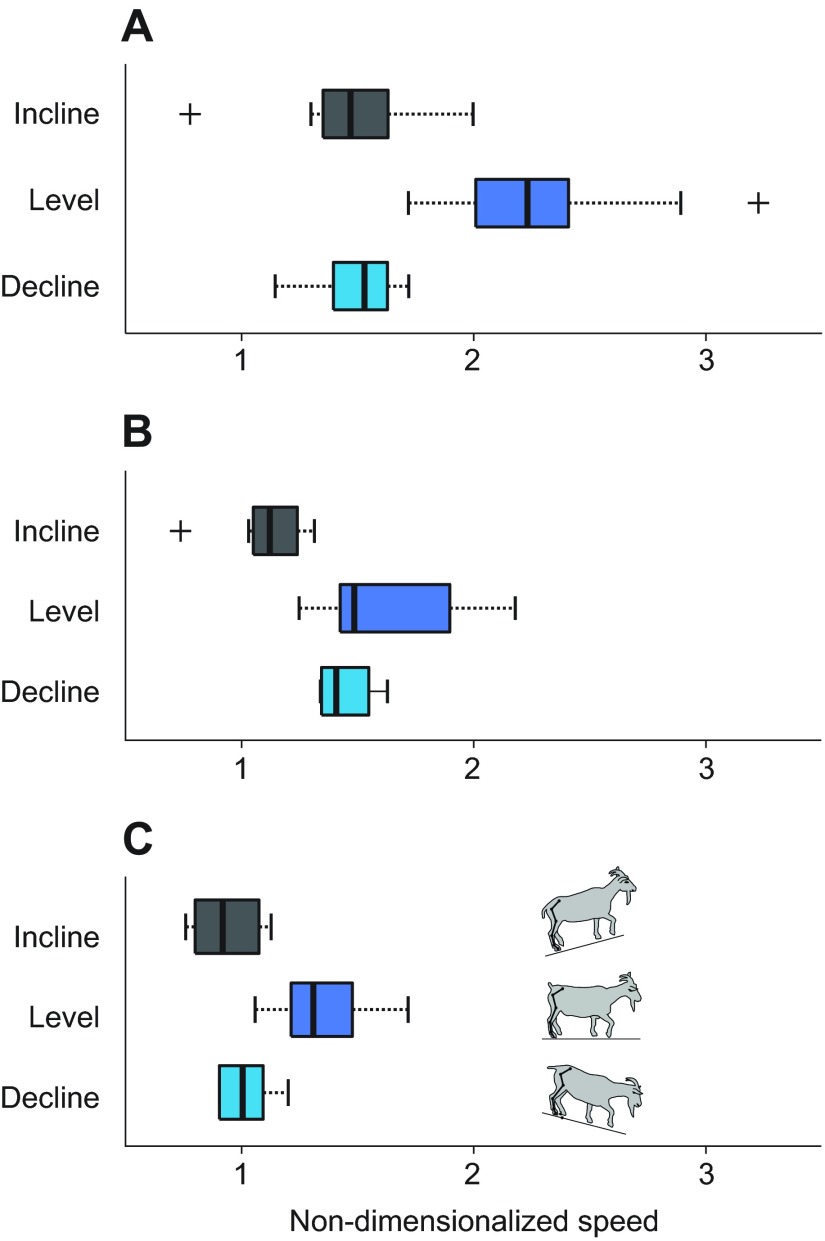
We also computed  , the Froude number (e.g. Alexander and Jayes, 1983). Inspection of these values confirmed that the goats typically ran at different speeds on the level, inclined and declined surfaces (P<0.001, Fig. 2). For example, goats trotted on the level runway at a median, non-dimensionalized speed of 1.3 (ranges: v=2.2–3.5 m s−1,
  =1.1–1.7,
  =1.1–3.0). By contrast, goats trotted on the inclined runway at a slower median speed of 0.9 (ranges: v=1.6–2.2 m s−1,
  =0.8–1.1,
  =0.6–1.3). Because of these differences in speed with surface grade, we were unable to infer the effects of grade independent of speed by directly comparing data from the level and sloped runways. Our next step, therefore, was to rigorously characterize how the goats' joint moments, powers and work varied with locomotor speed at each surface grade.
Fig. 2.
Boxplots of the goats' non-dimensionalized speeds on the level, inclined and declined runways. The goats' average, actual speeds on the level runway were 4.0 m s−1 during galloping (range 2.8–6.2 m s−1), 2.7 m s−1 during trotting (range 2.2–3.5 m s−1) and 1.8 m s−1 during walking (range 1.6–2.0 m s−1). Goats generally galloped (A, leading limb; B, trailing limb) and trotted (C) faster along the level runway than along the inclined or declined runways (P<0.001), as confirmed by Kruskal–Wallace tests. The goats' leading limb galloping trials had similar median speeds on the inclined and declined runways (A).
We quantified the influence of speed as follows. For each joint and each surface grade, we plotted the joint-related variables of interest versus the goats' non-dimensionalized speeds. In particular, we examined variations in the excursion of the joint during stance, the peak extension moment, the peak rates of energy absorption and generation, and the negative, positive and net joint work produced during stance. Next, with speed as the predictor variable, we fitted a regression equation to each set of data using a linear least-squares algorithm (Matlab Statistics Toolbox, The MathWorks, Inc.). We derived separate regression equations for each surface grade, and we included all trials, regardless of gait, as inspection of the data after categorizing by gait revealed similar trends with speed. We assessed goodness of fit based on the coefficient of determination, R2. To assess whether the joint excursion, moment, power or work data varied significantly with speed at each grade (i.e. whether the slopes of the corresponding regression equations differed significantly from zero), we conducted F-tests with α=0.05. Lastly, we used the regression equations to estimate, at representative speeds, the variables of interest and their associated 95% confidence intervals for each grade. This allowed us to make comparisons across grade while accounting for differences in speed. For example, we
estimated the goats' net joint work at a representative speed corresponding to trotting ( =1.2,
=1.2,  ≈1.5) and at a representative speed corresponding to slow galloping (
 =1.7,
=1.7,  ≈3.0) using the regression equations derived for the level, inclined and declined runways. We chose these representative speeds to be within the range of speeds exhibited by the goats during the experiments (Fig. 2). We also examined speed- and grade-related changes in the net joint moments and joint excursions to gain insight into the goats' strategies for modulating hindlimb work during the stance phase.
RESULTS
Joint moments, powers and work on level terrain and the effects of locomotor speed
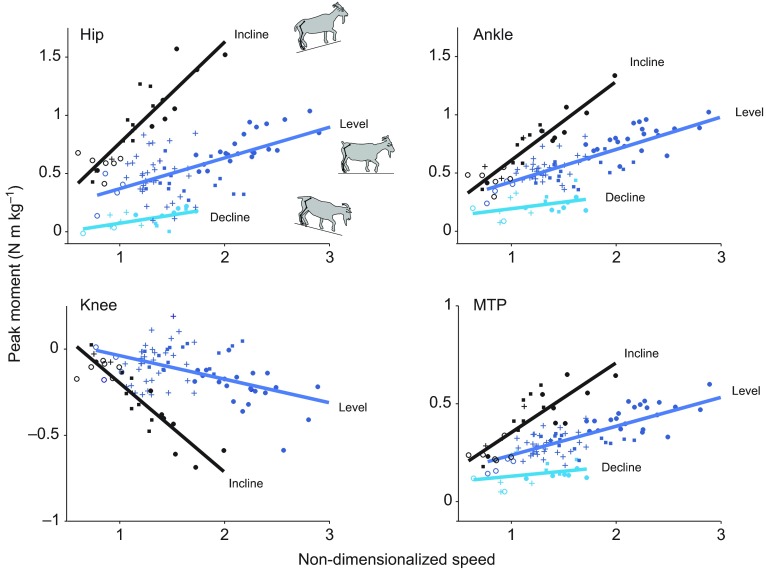
During level locomotion, the goats generated net extension moments at the hip, ankle and MTP joints that increased in magnitude with locomotor speed (P<0.001, R2 values=0.37–0.65; Figs 3, 4). At the hip, goats produced a net extension moment that peaked at ~25% of stance. At the ankle, goats produced a net extension moment that peaked at ~40% of stance, and at the MTP joint, goats produced a net extension moment that peaked at ~50% of stance. At the knee, muscles on the trailing limb during galloping generated a small net extension moment in the first half of stance, while muscles on the leading limb generated a net flexion moment; these moments also tended to increase with speed (P<0.001; Figs 3, 4). In the second half of stance, the knee muscles produced a net extension moment. Averaged moments for the goats calculated on the level runway (Fig. 3) are qualitatively similar to the moments reported previously for horses (e.g. Dutto et al., 2006) and dogs (e.g. Colborne et al., 2005; Colborne et al., 2006) trotting on level surfaces.
Fig. 3.
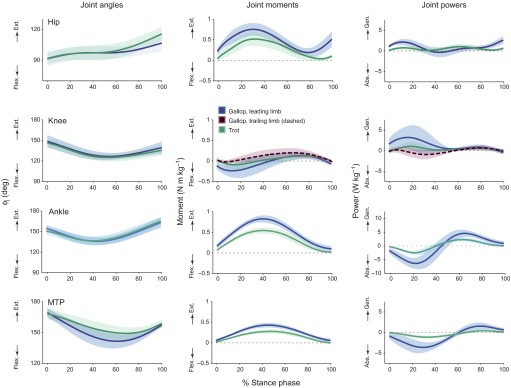
Hindlimb joint angles (ϕj), net joint moments and net joint powers during steady-speed trotting and galloping on the level runway. Shaded areas show the mean values ±1 s.d. during the stance phase. During galloping, the leading and trailing limbs generated different moments at the knee (compare solid and dashed lines) but similar moments at other joints (only the leading limb is shown, for clarity). The joint moments and powers during walking (not shown) were similar, but smaller in magnitude, to those during trotting. Flex., flexion; Ext., extension; Abs., absorption; Gen., generation.
Fig. 4.
Peak joint moments on the level, inclined and declined runways plotted versus the goats' non-dimensionalized speeds. At the hip, ankle and MTP joints, the goats' peak extension moments increased with both speed and grade. At the knee, the goats' peak flexion moment in early stance also increased with speed and grade. On the declined runway, the goats generated a knee extension moment (not shown). Lines show the best-fit linear regressions, and symbols indicate gait type: open circles, walk; crosses, trot; filled squares, trailing-limb gallop; and filled circles, leading-limb gallop. These data emphasize the need to account for differences in locomotor speed when comparing joint moments across surface grades.
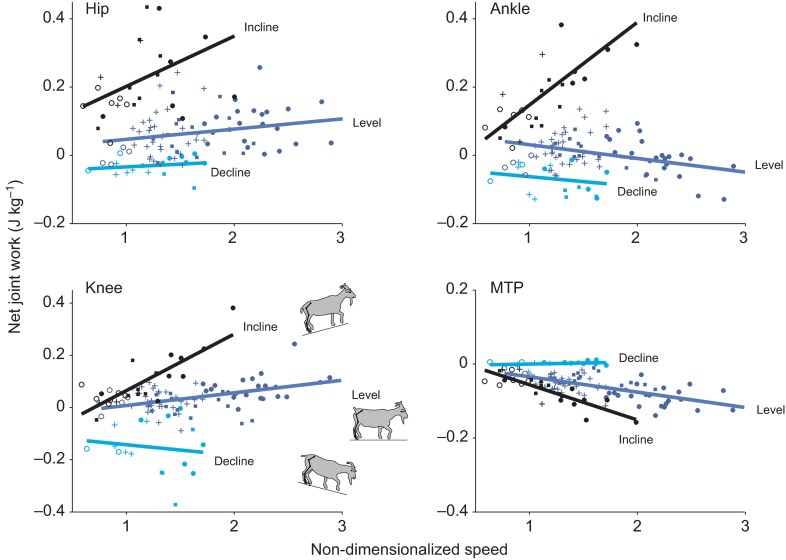
Though the goats' hindlimb joint moments varied appreciably with locomotor speed, these moments provided little net mechanical work (<0.1 J kg−1 body mass per joint) during level locomotion, irrespective of speed (Fig. 5). Hip extensors did a small amount of mechanical work in the early stance phase and, as the hip continued to extend, did more work later in stance. Knee extensors of the trailing limb absorbed energy then generated energy as the knee flexed and extended, while knee extensors and flexors of the leading limb primarily generated energy. Musculotendon structures at the ankle and MTP joints also absorbed energy in the first half of stance, as the joints dorsiflexed, and released energy in the second half of stance, as the ankle plantarflexed. These patterns of energy absorption and generation were more pronounced during galloping than during trotting or walking (Fig. 3) because of the greater net moments developed at the hindlimb joints at faster speeds (Fig. 4) and the greater GRFs generated during galloping (leading limb peak Fv=1.02±0.11 BW) than during trotting (peak Fv=0.76±0.07 BW) or walking (peak Fv=0.58±0.04 BW). Nevertheless, at each of the hindlimb joints, net work on the level runway was only slightly increased (hip, knee: P<0.05) or slightly decreased (ankle, MTP: P<0.05) at the faster galloping speeds.
Fig. 5.
Net joint work on the level, inclined and declined runways plotted versus the goats' non-dimensionalized speeds. At the hip, knee and ankle, net joint work increased with surface grade (i.e. more mechanical energy was generated during the stance phase). At the MTP joint, net joint work decreased with surface grade (i.e. more mechanical energy was absorbed during the stance phase). On the inclined runway, but not on the level or declined runways, net work dramatically increased (hip, knee, ankle) or decreased (MTP) with locomotor speed. Lines show the best-fit linear regressions, and symbols indicate gait type: open circles, walk; crosses, trot; filled squares, trailing-limb gallop; and filled circles, leading-limb gallop.
Joint moments, power and work on sloped terrain and the effects of surface grade
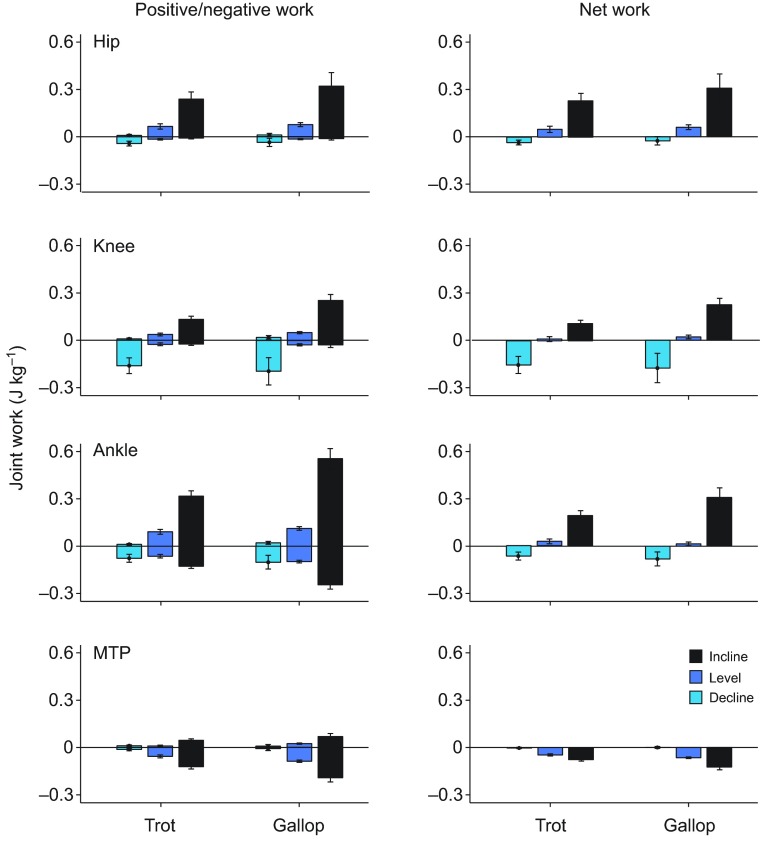
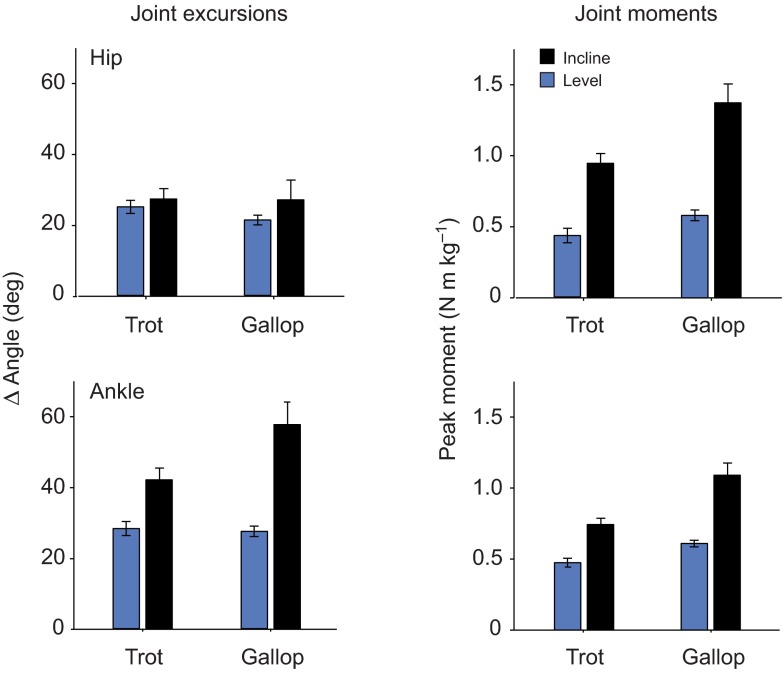
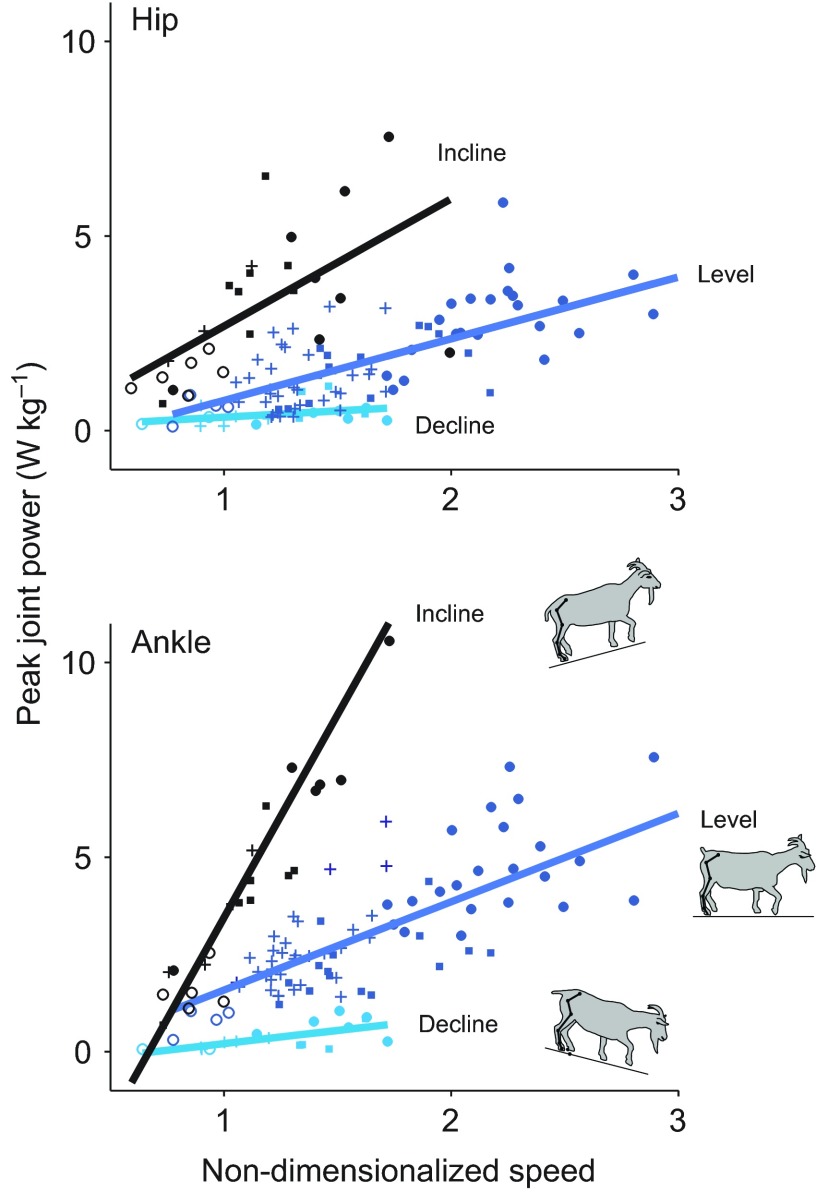
On the inclined runway, mechanical work was modulated by changes in the net moments at each of the hindlimb joints. More energy was contributed by musculotendon structures at the hip, knee and ankle, and more energy was absorbed at the MTP joint, when goats trotted and galloped uphill (Figs 6, 7). The net moments and net work at each joint varied with locomotor speed (P<0.05; R2 values=0.18–0.84; Figs 4, 5). The greatest changes in the goats' hindlimb work output occurred at the hip and ankle (Figs 6, 7). At the hip, goats responded to the demand for increased work by generating larger net extension moments (Fig. 8). At the ankle, goats responded to the demand for increased work by generating larger net extension moments and, in addition, by generating these moments over a greater ankle excursion (Fig. 8). At walking and trotting speeds, the net increase in ankle excursion was small; however, at galloping speeds, the change in ankle excursion (i.e. increased flexion in early stance) was substantial. The goats' peak power output at the hip (in mid-stance) and at the ankle (in late stance) also increased significantly with locomotor speed and surface grade (P<0.01; R2 values=0.37–0.86; Fig. 9). The increase in net power was particularly pronounced at the ankle during uphill galloping, which may reflect the recovery of tendon elastic energy; estimates of strain energy recovery in the gastrocnemius and superficial digital flexor tendons, based on in vivo measurements of tendon stress, have shown that energy recovery increases significantly when running uphill (McGuigan et al., 2009).
Fig. 6.
Changes in hindlimb joint work with surface grade at trotting and galloping speeds. Negative and positive joint work and net joint work over the stance phase were estimated at non-dimensionalized speeds of 1.2 (trotting) and 1.7 (galloping) from regression equations. Error bars show the 95% confidence intervals. The net work required for inclined running is delivered at the hip, knee and ankle joints, and this work increases with locomotor speed.
Fig. 7.
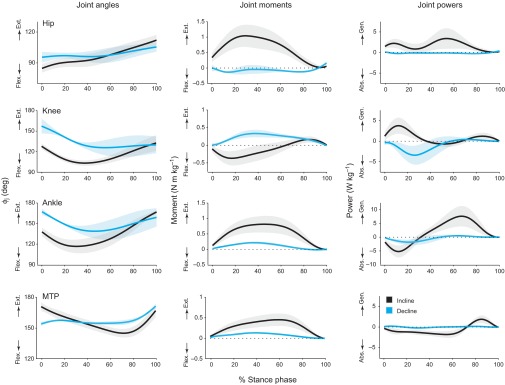
Hindlimb joint angles, net joint moments and net joint powers during steady-speed galloping (leading limb) at similar speeds on the inclined and declined runways. Shaded areas show the mean values ±1 s.d. during the stance phase. On the inclined runway, extension moments at the hip and ankle increase dramatically, resulting in increased power generation. On the declined runway, the net knee moment switches from flexion to extension in early stance, resulting in a net absorption of energy.
Fig. 8.
Factors that contribute to the increase in hindlimb joint work during inclined locomotion. Angular excursions during the stance phase and peak moments at the hip and ankle were estimated at non-dimensionalized speeds of 1.2 (trotting) and 1.7 (galloping) from regression equations. Error bars show the 95% confidence intervals. When running uphill, goats generated larger net extension moments at the ankle over a greater ankle excursion in response to the demand for increased work. Goats also generated larger net extension moments at the hip, especially during galloping.
Fig. 9.
Peak power (i.e. peak rate of energy generation) at the hip and ankle on the level, inclined and declined runways plotted versus the goats' non-dimensionalized speeds. Peak power increased with both speed and surface grade, particularly at the ankle. Lines show the best-fit linear regressions, and symbols indicate gait type: open circles, walk; crosses, trot; filled squares, trailing-limb gallop; and filled circles, leading-limb gallop.
On the declined runway, the net moments and net work at each joint were relatively independent of speed (Figs 4, 5), and work was modulated by changes in the moments at the hip, knee and ankle. Hip extensors and ankle extensors contributed less positive work, and knee extensors contributed substantially more negative work, when goats trotted and galloped downhill (Figs 6, 7). The greatest changes in the goats' hindlimb work output occurred at the knee and ankle. At the knee, goats responded to the demand for net energy absorption by generating relatively large net extension moments while permitting increased knee flexion (e.g. Fig. 7). At the ankle, goats responded to the demand for net energy absorption by generating smaller net extension moments throughout the stance phase and generating these moments over a diminished range of motion (Fig. 7). In early stance, the ankle extensors presumably stored less energy in their series elastic elements (aponeuroses and tendons); in the second half of stance, the mechanical energy delivered at the ankle was greatly diminished.
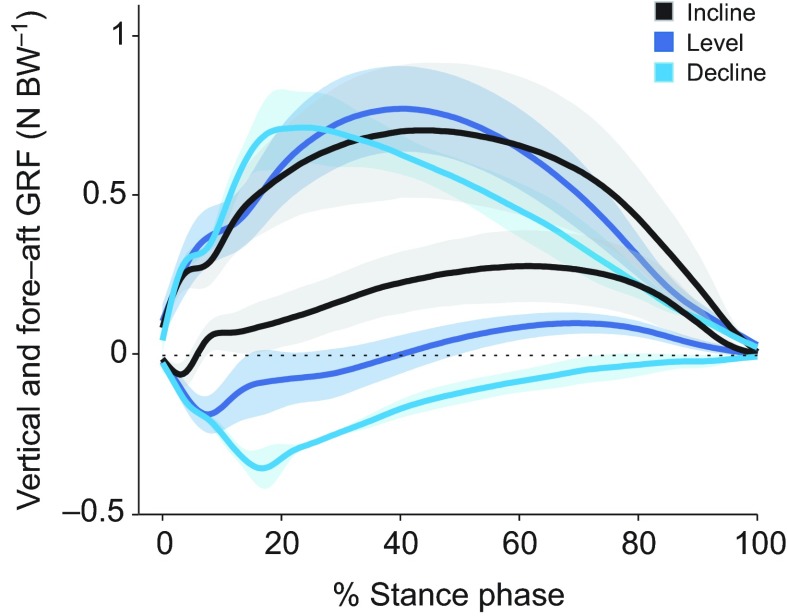
The goats' fore–aft GRFs on the inclined and declined runways were consistent with the changes in joint work. At all speeds, the hindlimb generated a net braking impulse on the downslope and a net propulsive impulse on the upslope (e.g. Fig. 10), consistent with previous studies (e.g. Gregor et al., 2006; Lee, 2011).
Fig. 10.
Vertical and fore–aft GRFs generated at the hindlimb during galloping (trailing limb) on the level, inclined and declined runways, filtered at 100 Hz and averaged across goats and trials. Shaded areas show the mean values ±1 s.d. The hindlimb generated a net braking force when running downhill and a net propulsive force when running uphill. The goats' average galloping speeds (trailing limb) were 3.4 m s−1 on the level, 2.2 m s−1 on the incline and 2.8 m s−1 on the decline. BW, body weight.
DISCUSSION
In this study, we investigated how the hindlimb muscle groups of domestic goats collectively generate and absorb mechanical energy at the hip, knee, ankle and MTP joints during level, inclined and declined locomotion. We examined the time-varying patterns of joint moments and powers based on inverse dynamics analysis, and we fitted regression equations to the data of interest to differentiate the effect of grade from the effects of speed and gait (e.g. trotting versus galloping). This study extends an earlier analysis of net joint work at the knee and ankle in goats with respect to grade (Lee et al., 2008). Notably, the current study assessed the role of moments generated at the hip, in relation to moments at the knee, ankle and MTP joints, for modulating mechanical energy with respect to speed, gait and grade. The current study also revealed, for example, how net work at the hip, knee and ankle increases with speed and how net work at the MTP joint decreases with speed, particularly on inclined surfaces.
Our study tested three hypotheses. First, we hypothesized that hindlimb joint work would be modulated more on an upslope than on a downslope given the relative importance of hindlimb propulsion during quadrupedal locomotion. This hypothesis was generally confirmed. In particular, the net increase in mechanical energy during one step on the inclined runway (+14.8 J kg−1) was about twice the net decrease in energy during one step on the declined runway (−7.1 J kg−1), when summed across hindlimb joints and estimated at galloping speeds (i.e.  =1.7). This result is consistent with the heightened role of the hindlimbs in providing support and propulsion on inclined terrain (e.g. Lee, 2011).
Our second hypothesis was that the goats' hindlimb joint work would be modulated more at faster than at slower locomotor speeds. This hypothesis was also confirmed. At the goats' walking and slow trotting speeds, differences in net joint work on the level, inclined and declined runways were minimal. However, at faster trotting and galloping speeds, differences in net joint work with surface grade were substantial (Fig. 5). Peak moments at each of the hindlimb joints also varied with grade at the goats faster' speeds (Fig. 4).
Our third hypothesis was that hindlimb joint work would be modulated more at the hip than at distal joints in these experiments. Analysis of the goats' kinematic data and GRFs showed, during uphill running, that extensor moments at the hip, knee and ankle all contributed substantially to the net increase in mechanical energy necessary to raise the goats' center of mass. During downhill running, the goats' hip extension moment in mid-stance was diminished, contributing to the decrease in energy. However, musculotendon structures at the knee and ankle also absorbed mechanical energy, and the net moments at all of these joints contributed diminished positive power in stance. Hence, our third hypothesis was not directly supported by these data. Our estimates of net joint work are consistent with patterns observed previously at the knee and ankle based on analysis of external joint moments (Lee et al., 2008).
There are both similarities and differences between the net moments and work generated by quadrupedal goats, as reported here, and those generated by bipedal humans during level, inclined and declined running. When goats run uphill, the net work at each of the hindlimb joints changes with surface grade. When humans run uphill, mechanical work is modulated primarily by increasing the extension moment generated at the hip (Roberts and Belliveau, 2005). When goats run downhill, the hip and ankle moments are diminished and the knee moment switches from flexion to extension, resulting in net negative work as the knee flexes (Fig. 7). When humans run downhill (at moderate speeds and grades) the knee and ankle moments do not change appreciably. Like goats, however, the knee and ankle undergo increased flexion, and this results in greater energy absorption (Buczek and Cavanagh, 1990).
It is instructive to compare changes in the goats' hindlimb joint work with speed and surface grade to changes in the in vivo fascicle strains measured in previous studies. For instance, we found that net work at the hip and knee increases slightly with locomotor speed (Fig. 4); this is consistent with measures of neuromuscular activation (EMG) and strain in the biceps femoris. In the goat, the biceps femoris produces both hip extension and knee flexion moments. It is activated prior to initial ground contact, and it undergoes substantial shortening in early stance (Gillis et al., 2005). Thus, the biceps femoris contributes to the positive work that is generated at the hip and knee. As speed increases from a trot to a gallop, the hip and knee moments increase. The biceps femoris shortens less, but its EMG intensity increases (Gillis et al., 2005). Together, these data suggest that the increase in joint work during galloping, as determined from inverse dynamics, is likely related to an increase in force produced by the biceps femoris (and other hip extensor muscles). Our analysis also suggests that this proximal hip extensor generates greater forces and performs substantially more work when galloping uphill (Fig. 4); this prediction remains to be tested in vivo. Proximal extensors in other species, including rats (Gillis and Biewener, 2002), turkeys (Roberts et al., 2007), wallabies (McGowan et al., 2007) and horses (Wickler et al., 2005), consistently show increased net shortening strains when running on inclined terrain.
In the distal hindlimb, changes in joint work with surface grade are substantially greater than, but generally consistent with, changes in the work produced by individual muscles during trotting. The ankle extensors are active during much of stance, and they shorten while producing an ankle extension moment (McGuigan et al., 2009). These muscles, with their pennate architecture and long distal tendons, modulate joint power and mechanical work at the ankle. When goats trot up an incline, the net fascicle shortening strain increases significantly, as does the peak tendon stress and elastic energy recovery (McGuigan et al., 2009). When goats trot down a decline, net muscle work and elastic energy recovery are diminished. These in vivo data are consistent with our analysis, which shows that increases in both ankle excursion and net extension moment contribute to the net increase in positive joint work when goats run uphill (Figs 7, 8). However, the ankle extensors produce only a small fraction (<3%) of the work needed to raise the body's center of mass when trotting uphill (McGuigan et al., 2009) and only a small fraction of the net joint work generated at the ankle. For example, the net work produced by the gastrocnemius and superficial digital flexor muscles when trotting on the level (0.09 J) (McGuigan et al., 2009) is only about 20% of the net work generated at the ankle (0.47 J, scaled to the average body mass of the goats in McGuigan and colleagues' study). When trotting on the incline runway, the net work produced by the gastrocnemius and superficial digital flexor muscles (0.44 J) (McGuigan et al., 2009) is only about 11% of the net work generated at the ankle (3.9 J). This suggests that the majority of hindlimb work during inclined or declined running must be performed by larger proximal muscles, consistent with the interpretation of in vivo data (McGuigan et al., 2009). Interestingly, our analyses revealed dramatic increases in the ankle excursions, net ankle extension moments and peak joint power at the ankle when goats galloped uphill at faster speeds (Figs 4, 9). Whether the goats' gastrocnemius and superficial digital flexor muscles contributed a greater proportion of the energy during galloping remains unknown, as galloping was not analyzed in the earlier study (McGuigan et al., 2009).
It is important to recognize that ankle motions cannot be attributed solely to active shortening of ankle extensors (e.g. Zajac and Gordon, 1989). It is also important to note that whether net work at the ankle results from active shortening of ankle extensors – or from the transfer of energy from muscles that produce moments at other joints – is not easily discerned from our inverse dynamics analysis. Hence, quantifying the relative contributions of proximal and distal muscles to the modulation of mechanical energy warrants further in vivo study. Our analysis does show that the goats' hip moments changed dramatically in response to the changes in surface grade (Figs 4, 7), providing some evidence that proximal muscles have an important role in modulating mechanical work of the limb and body as a whole.
Energy absorbed at the MTP joint may also help to modulate net work at the ankle. Changes in net work at the MTP joint with surface grade were opposite in direction to the changes at other joints. At the MTP joint, more energy was absorbed on the inclined runway, and less energy was absorbed on the declined runway, than on the level runway (Fig. 6). Also, more energy was absorbed during galloping than during trotting or walking (Figs 5, 6). Hence, net work at the MTP joint decreased with surface grade and speed. This result can be explained by examining changes in the MTP moment and excursion. On the inclined runway, as compared with the level runway, musculotendon structures at the MTP joint produced a greater net extension moment, and this moment acted over a greater range of flexion, absorbing mechanical energy. As the digital flexor muscles cross both the MTP joint and the ankle, we hypothesize that energy is stored in elastic tendons with flexion of the MTP joint, and this energy is returned with extension of the ankle (i.e. ‘transferred’ to the ankle). More energy is stored (and subsequently released) at faster running speeds. These data from goats are consistent with the increased energy absorption at the MTP joint reported for accelerating wallabies (McGowan et al., 2005) and sprinting humans (Stefanyshyn and Nigg, 1997). Interestingly, net work at the MTP joint has been shown to be relatively independent of acceleration in running greyhounds (Williams et al., 2009) and wild turkeys (Roberts and Scales, 2004). Energy absorbed at the knee joint also increased with locomotor speed, particularly during downhill running. These data are consistent with a previous study (Gillis et al., 2005) that reported a dramatic increase in the stretching strains of the vastus lateralis during galloping.
It is important to acknowledge some of the limitations of our analysis. First, goats in this study were not constrained to run on a treadmill at prescribed speeds. Rather, the goats walked, trotted and galloped over ground at a wide range of speeds, and they typically ran at different speeds on the level, inclined and declined runways for a given gait. This made it challenging to directly compare data for the level and sloped conditions, as many of our variables of interest were speed dependent. When analyzing the effects of slope, therefore, we controlled for the effects of speed by plotting relevant variables versus the animals' non-dimensionalized speeds and calculating the best-fit regression equations. A second limitation is that we evaluated the goats at only three different grades (0, +15 and −15 deg). Thus, we cannot infer whether goats use the same strategies to modulate joint work on much steeper grades, which they are likely to encounter in natural environments. Third, we did not collect EMG recordings in this study. As a result, we cannot confirm whether the observed changes in net joint moments resulted from the recruitment of different, synergistic muscles on the sloped runway, or whether the same muscles were recruited at different intensities. Fourth, we did not analyze sufficient trials to discern whether work is modulated differently in the hindlimb depending on whether the limb is trotting, trailing or leading. However, we did observe subtle but distinct differences between leading and trailing limbs, particularly in the GRFs and the knee moment. Fifth, we did not examine how joint work is simultaneously modulated in the forelimbs. GRFs and kinematic data were collected from the forelimbs, so we could analyze the net joint moments, power and work generated by muscles in the forelimb in a future study and compare these results with the data reported here.
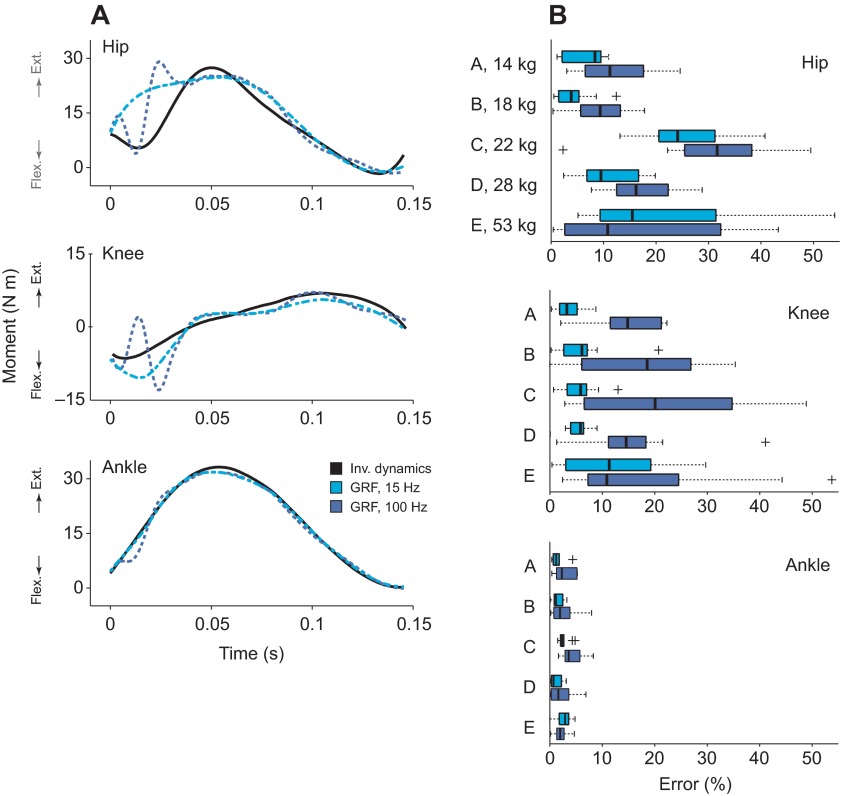
When implementing our inverse dynamics analysis, we used the same cut-off frequency (15 Hz) when filtering the segment angles and GRFs (Kristianslund et al., 2012), and we included inertial and gravitational terms. This approach may differ from approaches used in previous studies. Often, GRFs are filtered at higher cut-off frequencies than position data, as the force data are typically less noisy and do not need to be differentiated. It is also common to estimate net joint moments during the stance phase using only the GRF vector and the coordinates of the joint centers, neglecting inertial and gravitational terms. This simpler approach is often justified by comparing the results with the net joint moments obtained using inverse dynamics, and noting that they match well (e.g. Williams et al., 2009). However, such comparisons are potentially problematic. To explore these methodological issues, we conducted a sensitivity study to assess errors that could potentially arise from neglecting inertial and gravitational terms (Fig. 11). In particular, we compared the joint moments computed from inverse dynamics (including inertial and gravitational components) with the moments estimated from the GRF vector filtered at either 15 or 100 Hz. We subsequently used these joint moments to estimate positive joint work. We analyzed representative trials from five goats, ranging in body mass from 14 to 53 kg. Our sensitivity analysis revealed that the simpler method captured the salient features of the moments at the hip, knee and ankle, but errors were sensitive to the choice of cut-off frequency (Fig. 11A). When these joint moments were used to estimate positive joint work, the percentage errors were exacerbated (Fig. 11B). Not surprisingly, errors were substantially worse at the hip than at the ankle, reflecting the greater impact of limb segment mass and inertia at more proximal joints. Errors were also worse when the higher cut-off frequency was used. This is because the measured GRF includes frequency content associated with higher frequency accelerations, and this content may be erroneously attributed to joint moments, rather than inertial terms. Similar artifacts appear when inertial and gravitational terms are included in the analysis, but when the GRF data are filtered using a different cut-off frequency from that used for the position data (Kristianslund et al., 2012). This example demonstrates that when joint work is calculated at proximal joints, substantial errors can arise when inertial and gravitational terms are neglected during limb stance.
Fig. 11.
Differences in stance-phase joint moments (A) and positive joint work (B) at the hip, knee and ankle computed using inverse dynamics and using only the GRFs. In A, the moments computed from inverse dynamics (including inertial and gravitational components, solid lines) are compared with the moments estimated from the GRFs filtered at either 15 or 100 Hz (dashed lines). Joint moments are shown for a representative galloping trial (leading limb) from the largest goat (mass 53 kg). Boxplots in B show the corresponding differences in positive joint work determined for five goats (A–E) ranging in mass from 14 to 53 kg. Errors are expressed as a percentage of the joint work computed from inverse dynamics; the median errors and interquartile ranges are from representative trotting and galloping trials at a range of speeds.
In summary, in their natural environment goats routinely walk, trot and gallop over steeply graded terrain, and it is instructive to examine whether proximal muscles or distal muscles, or both, generate and absorb mechanical energy to meet the demands of the environment. Analysis of hindlimb joint power and work production across surface grades, using inverse dynamics, reveals that the net work required for inclined running is delivered at the hip, knee and ankle joints; during declined running, energy is absorbed primarily at the knee and ankle joints. Interestingly, the changes in net joint work with grade at the MTP joint are opposite to the changes at other joints. At the MTP joint, less energy is absorbed on a decline, and more energy is absorbed on an incline, than during level running. This investigation provides new insights into how the moments generated by hindlimb muscles modulate mechanical energy of the body and motivates future studies that examine the in vivo contractile patterns of proximal muscles in relation to the net joint moments and work they produce.
ACKNOWLEDGEMENTS
We are grateful to Pedro Ramirez for animal care and assistance with training. We also thank Edwin Yoo for help with data collection and Dr Carlos Moreno for help with data processing.
LIST OF SYMBOLS AND ABBREVIATIONS
- Fh
horizontal ground reaction force
- Fv
vertical ground reaction force
- g
acceleration due to gravity (9.81 m s−2)
- GRF
groudn reaction force
- Is
segment moment of inertia
- l
limb length, as estimated from the hip marker at mid-stance
- ms
segment mass
- MTP
metatarsophalangeal joint
- v
average forward velocity during the stance phase, as estimated from the ilium marker

non-dimensionalized speed

Froude number
- θs
segment angle

segment angular velocity
- ϕj
joint angle
FOOTNOTES
COMPETING INTERESTS
No competing interests declared.
FUNDING
This work was supported by the National Institutes of Health [grant no. R01-AR47679 to A.A.B. and supplement R01-AR55648S to A.S.A.]. Deposited in PMC for release after 12 months.
REFERENCES
- Alexander R. M., Jayes A. S. (1983). A dynamic similarity hypothesis for the gaits of quadrupedal mammals. J. Zool. 201, 135-152 [Google Scholar]
- Biewener A. A., McGowan C., Card G. M., Baudinette R. V. (2004). Dynamics of leg muscle function in tammar wallabies (M. eugenii) during level versus incline hopping. J. Exp. Biol. 207, 211-223 [DOI] [PubMed] [Google Scholar]
- Buczek F. L., Cavanagh P. R. (1990). Stance phase knee and ankle kinematics and kinetics during level and downhill running. Med. Sci. Sports Exerc. 22, 669-677 [DOI] [PubMed] [Google Scholar]
- Colborne G. R., Innes J. F., Comerford E. J., Owen M. R., Fuller C. J. (2005). Distribution of power across the hind limb joints in Labrador Retrievers and Greyhounds. Am. J. Vet. Res. 66, 1563-1571 [DOI] [PubMed] [Google Scholar]
- Colborne G. R., Walker A. M., Tattersall A. J., Fuller C. J. (2006). Effect of trotting velocity on work patterns of the hind limbs of Greyhounds. Am. J. Vet. Res. 67, 1293-1298 [DOI] [PubMed] [Google Scholar]
- Daley M. A., Biewener A. A. (2003). Muscle force–length dynamics during level versus incline locomotion: a comparison of in vivo performance of two guinea fowl ankle extensors. J. Exp. Biol. 206, 2941-2958 [DOI] [PubMed] [Google Scholar]
- Dutto D. J., Hoyt D. F., Cogger E. A., Wickler S. J. (2004). Ground reaction forces in horses trotting up an incline and on the level over a range of speeds. J. Exp. Biol. 207, 3507-3514 [DOI] [PubMed] [Google Scholar]
- Dutto D. J., Hoyt D. F., Clayton H. M., Cogger E. A., Wickler S. J. (2006). Joint work and power for both the forelimb and hindlimb during trotting in the horse. J. Exp. Biol. 209, 3990-3999 [DOI] [PubMed] [Google Scholar]
- Gabaldón A. M., Nelson F. E., Roberts T. J. (2004). Mechanical function of two ankle extensors in wild turkeys: shifts from energy production to energy absorption during incline versus decline running. J. Exp. Biol. 207, 2277-2288 [DOI] [PubMed] [Google Scholar]
- Gillis G. B., Biewener A. A. (2002). Effects of surface grade on proximal hindlimb muscle strain and activation during rat locomotion. J. Appl. Physiol. 93, 1731-1743 [DOI] [PubMed] [Google Scholar]
- Gillis G. B., Flynn J. P., McGuigan P., Biewener A. A. (2005). Patterns of strain and activation in the thigh muscles of goats across gaits during level locomotion. J. Exp. Biol. 208, 4599-4611 [DOI] [PubMed] [Google Scholar]
- Gregor R. J., Smith D. W., Prilutsky B. I. (2006). Mechanics of slope walking in the cat: quantification of muscle load, length change, and ankle extensor EMG patterns. J. Neurophysiol. 95, 1397-1409 [DOI] [PubMed] [Google Scholar]
- Higham T. E., Biewener A. A. (2008). Integration within and between muscles during terrestrial locomotion: effects of incline and speed. J. Exp. Biol. 211, 2303-2316 [DOI] [PubMed] [Google Scholar]
- Kristianslund E., Krosshaug T., van den Bogert A. J. (2012). Effect of low pass filtering on joint moments from inverse dynamics: implications for injury prevention. J. Biomech. 45, 666-671 [DOI] [PubMed] [Google Scholar]
- Lammers A. R., Earls K. D., Biknevicius A. R. (2006). Locomotor kinetics and kinematics on inclines and declines in the gray short-tailed opossum Monodelphis domestica. J. Exp. Biol. 209, 4154-4166 [DOI] [PubMed] [Google Scholar]
- Lee D. V. (2011). Effects of grade and mass distribution on the mechanics of trotting in dogs. J. Exp. Biol. 214, 402-411 [DOI] [PubMed] [Google Scholar]
- Lee D. V., McGuigan M. P., Yoo E. H., Biewener A. A. (2008). Compliance, actuation, and work characteristics of the goat foreleg and hindleg during level, uphill, and downhill running. J. Appl. Physiol. 104, 130-141 [DOI] [PMC free article] [PubMed] [Google Scholar]
- Maas H., Gregor R. J., Hodson-Tole E. F., Farrell B. J., Prilutsky B. I. (2009). Distinct muscle fascicle length changes in feline medial gastrocnemius and soleus muscles during slope walking. J. Appl. Physiol. 106, 1169-1180 [DOI] [PMC free article] [PubMed] [Google Scholar]
- McGowan C. P., Baudinette R. V., Biewener A. A. (2005). Joint work and power associated with acceleration and deceleration in tammar wallabies (Macropus eugenii). J. Exp. Biol. 208, 41-53 [DOI] [PubMed] [Google Scholar]
- McGowan C. P., Baudinette R. V., Biewener A. A. (2007). Modulation of proximal muscle function during level versus incline hopping in tammar wallabies (Macropus eugenii). J. Exp. Biol. 210, 1255-1265 [DOI] [PubMed] [Google Scholar]
- McGuigan M. P., Yoo E., Lee D. V., Biewener A. A. (2009). Dynamics of goat distal hind limb muscle–tendon function in response to locomotor grade. J. Exp. Biol. 212, 2092-2104 [DOI] [PMC free article] [PubMed] [Google Scholar]
- Roberts T. J., Belliveau R. A. (2005). Sources of mechanical power for uphill running in humans. J. Exp. Biol. 208, 1963-1970 [DOI] [PubMed] [Google Scholar]
- Roberts T. J., Scales J. A. (2004). Adjusting muscle function to demand: joint work during acceleration in wild turkeys. J. Exp. Biol. 207, 4165-4174 [DOI] [PubMed] [Google Scholar]
- Roberts T. J., Higginson B. K., Nelson F. E., Gabaldón A. M. (2007). Muscle strain is modulated more with running slope than speed in wild turkey knee and hip extensors. J. Exp. Biol. 210, 2510-2517 [DOI] [PubMed] [Google Scholar]
- Rubenson J., Henry H. T., Dimoulas P. M., Marsh R. L. (2006). The cost of running uphill: linking organismal and muscle energy use in guinea fowl (Numida meleagris). J. Exp. Biol. 209, 2395-2408 [DOI] [PubMed] [Google Scholar]
- Stefanyshyn D. J., Nigg B. M. (1997). Mechanical energy contribution of the metatarsophalangeal joint to running and sprinting. J. Biomech. 30, 1081-1085 [DOI] [PubMed] [Google Scholar]
- Wickler S. J., Hoyt D. F., Biewener A. A., Cogger E. A., De La Paz K. L. (2005). In vivo muscle function vs speed. II. Muscle function trotting up an incline. J. Exp. Biol. 208, 1191-1200 [DOI] [PubMed] [Google Scholar]
- Williams S. B., Usherwood J. R., Jespers K., Channon A. J., Wilson A. M. (2009). Exploring the mechanical basis for acceleration: pelvic limb locomotor function during accelerations in racing greyhounds (Canis familiaris). J. Exp. Biol. 212, 550-565 [DOI] [PMC free article] [PubMed] [Google Scholar]
- Winter D. A. (1983). Moments of force and mechanical power in jogging. J. Biomech. 16, 91-97 [DOI] [PubMed] [Google Scholar]
- Zajac F. E., Gordon M. E. (1989). Determining muscle's force and action in multi-articular movement. Exerc. Sport Sci. Rev. 17, 187-230 [PubMed] [Google Scholar]


