

Abstract
Prediction of nanoparticle (NP) distribution in a vasculature involves transport phenomena at various scales and is crucial for the evaluation of NP delivery efficiency. A combined particulate and continuum model is developed to model NP transport and delivery processes. In the particulate model ligand-receptor binding kinetics is coupled with Brownian dynamics to study NP binding on a microscale. An analytical formula is derived to link molecular level binding parameters to particulate level adhesion and detachment rates. The obtained NP adhesion rates are then coupled with a convection-diffusion-reaction model to study NP transport and delivery at macroscale. The binding results of the continuum model agree well with those from the particulate model. The effects of shear rate, particle size and vascular geometry on NP adhesion are investigated. Attachment rates predicted by the analytical formula also agree reasonably well with the experimental data reported in literature. The developed coupled model that links ligand-receptor binding dynamics to NP adhesion rate along with macroscale transport and delivery processes may serve as a faster evaluation and prediction tool to determine NP distribution in complex vascular networks.
Keywords: adhesion kinetics, Brownian dynamics, convection-diffusion-reaction model, particulate-continuum coupled model, nanoparticle
1. Introduction
A long standing issue for drug delivery is to deliver the correct dose of a particular therapeutic drug to a specific disease site. This is generally hard to achieve by traditional drug delivery methods as therapeutics have to be administered in excessively high doses, thereby increasing the odds of toxic side effects and creating a need for targeted delivery. The marriage of nanotechnology with medicine has attracted considerable interests in recent years [1–3]. Nanoscale drug-carriers can be easily tuned through rational design to change their size, shape and surface chemistry [4–7]. Designing a successful targeted drug delivery system is challenging due to unsteady blood flows, complex vascular geometries, and physiological conditions at the target site. Experimental approaches to understand nanoparticle (NP) targeting process are limited to macroscopic descriptions in terms of particle bound density and circulation half-life-time because of difficulties in tracking individual NP motion. Thus, a fast and accurate prediction tool is needed clinically to determine the drug biodistribution after administration. An appropriate approach would be to develop a multiscale model which links physical/chemical properties of ligand-receptor in micro/nanoscale (particulate model) to adhesion/detachment rates in macroscale (continuum model).
Mathematical models [8–9] and computer simulations [10–12] have been widely used to study the drug delivery mechanism. Previous models that have been proposed to study NP adhesion kinetics are mainly based on either the equilibrium approach [13–14] or kinetics approach[15]. Evans et al. [14] have developed a model to study binding dynamics of NPs by considering equilibrium force required to separate adhesive bonds while Haun et al. [15] considered the association and dissociation constants of particles as a function of receptor and ligand density. Ferrari and Decuzzi [16–17] created a NP adhesion model to demonstrate that NP binding probability decreases with size and shear rate. Complex vascular environments such as erythrocyte and vessel geometries on NP delivery have been shown an important impact on NP distribution[18–19]. It is important to note that the kinetic rates (attachment rate ka and detachment rate kd) describing the NP binding as individual units are different from the ligand-receptor reaction rates (forward binding rate kf and reverse binding rate kr) that characterize the ligand-receptor interaction at nanoscale. At the ligand-receptor level, Bell gave an analytical formula of kf and kr for a diffusion limited ligand-receptor binding process[13, 20]. Both deterministic models and probability based approaches have been proposed to study ligand-receptor bond formation [21–22]. To link the ligand receptor bond formation with particle adhesion, Liu et al. [23] proposed a mesoscale modeling method to estimate the binding affinity between a nanocarieer and endothelial cells starting with absolute binding free energies. A continuum-kinetics approach was also used to study cell adhesion and movement where communication between microscale and nanoscale is facilitated numerically through bond force and interface deformation [24]. Fogelson et al. [25] proposed a multiscale model to link ligand-receptor binding with platelet aggregation through a combined elastic inter-platelet link function and immersed boundary method where platelet convection-diffusion equations, and bond formation equations are solved interactively. All these models link bond formation to either a single nanodrug carrier, a single cell, or platelets, but do not provide a link between micro/nanoscale ligand-receptor bond formation and macroscale NP binding density. In other words, the link between NP attachment/detachment rates (ka and kd) and ligand-receptor forward/reverse binding rates (kf and kr) has yet to be created.
This paper presents a combined particulate and continuum model to model dynamic transport and adhesion of NPs of various sizes under a complex vascular environment. In the particulate model, ligand-receptor binding kinetics are coupled with Brownian dynamics to study NP binding at microscale. An analytical formula is derived to link molecular level binding parameters to particulate level adhesion and detachment rates. The particulate level attachment/detachment rates can be input directly into a convection-diffusion-reaction based continuum model to predict NP distribution. We believe this work is the first attempt to integrate the particulate nature of NP and the molecular level binding rates into a continuum model. The efficient continuum model enables systematical prediction of NP delivery and distribution in a large vascular network that can potentially lead to clinical applications. The effects of shear rate, particle size, and vascular geometry on bound density of NP are explored using the multiscale model. In the following sections, the molecular level ligand-receptor binding dynamics is introduced followed by a description of the particulate and continuum model of NP binding. An analytical formula linking NP level adhesion and detachment rates and molecular level ligand-receptor binding constants is then developed and verified numerically and experimentally. Conclusions are later drawn and future works are presented in the end.
2. Molecular ligand-receptor binding dynamics
To achieve targeted drug delivery, NPs are usually coated with ligands that bind specifically to a particular type of receptors on the vessel cell surface [26]. NP motion is modeled through Brownian dynamics coupled with the ligand-receptor binding process when it interacts with the receptor coated target surface. Since the effect of NP motion is limited locally, we neglect the influence of particle motion on the fluid flow and instead focus on the particle motion and adhesion process.
Ligand-receptor binding is described as a non-covalent interaction. When a particle approaches the vascular wall, ligands on the particle surface form bonds with receptors on the wall, as demonstrated in Fig 1. An adhesion kinetic equation is used to calculate the bond density Nb [13, 21]:
| (1) |
where Nl and Nr are the ligand and receptor densities; kf and kr are the forward and reverse reaction rates, respectively. This interaction model represents a conservation equation of the different species (ligands, receptors, and bonds). The kr and kf are functions of bond length:
| (2) |
| (3) |
where ks is the bond elastic constant; kts is the bond elastic constant at transient state; kB is the Boltzmann constant; T is the temperature; and are the reverse and forward reaction rates at zero load of ligand-receptor pair, respectively; L is the difference between bond length y and equilibrium length λ.
Fig 1.
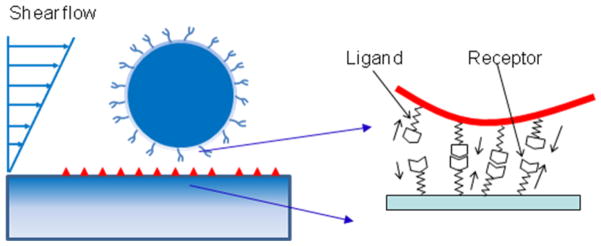
Model of ligand-receptor binding kinetics between ligand-coated NP surface and receptor coated vascular wall surface.
The receptor density Nr is much larger than ligand density Nl, which is common for targeted drug delivery. Thus, Eqn. (1) can be reduced into a first order kinetic equation for bonded ligand-density on a single particle:
| (4) |
Assuming an initial condition of Nb =0 at t=0, an analytical solution to (4) can be found as:
| (5) |
On average, the adhesive force must balance the drag force to avoid NP from being washed away. Assuming the drag is uniformly shared by all ligand-receptor pairs and the torque is only shared by the stretching part, the equivalent forces applied to the NP is F = Cd v + 2Tor/r0, where Cd is the drag coefficient, and v is the velocity of the fluid, Tor is the hydrodynamic torque, r0 is the radius of the circular contact area. For spherical NPs, Tor = 12πR3 μS, where R is the NP radius, μ is the viscosity of the fluid, S is the shear rate. The time required to form enough ligand-receptor bonds for firm adhesion of a NP can be found through F = Cd v + 2Tor/r0 = Nb f, that is:
| (6) |
The physical meaning of Tr is the average time required for enough bonds to form between ligands on a NP and receptors on the wall for adhesion. It is influenced by ligand density, forward binding rate, reverse binding rate, and hydrodynamic force.
3. Particulate model: NP Brownian Dynamics
The binding process of a NP involves transport in a fluid and adhesion to a surface. Fundamental theories of Brownian dynamics indicate that random collisions from surrounding liquid molecules impact motion of an immersed small particle [27–29]. The random force R(t) acting on a NP is responsible for Brownian motion and satisfies the fluctuation-dissipation theorem [30]:
| (7) |
| (8) |
where δ is the unit-second order tensor, δij is the Kronecker delta, δ(t − t′) is the Dirac delta function, and βt = 6πμR is the translational friction coefficient of NP. A Monte Carlo method similar as the one used in [31] is adopted to simulate the Brownian motion. The velocity of a particle moving under a deterministic force in a fluid with velocity Vf is given by:
| (9) |
where Fdet is the total deterministic force acting on the NP (including Brownian force, adhesion force, etc.), Vp and Vf are particle and fluid velocity vectors, respectively. For a time step (usually ~1 μs) much greater than a characteristic time constant m/βt (~10 ns), the NP moves with a terminal velocity, thus Eqn. (9) reduces to:
| (10) |
Eqn. (10) actually describes that the deterministic force acting on a particle is balanced by the drag force from the fluid. This is reasonable since the mass of a NP is so small that any inertia effect can be neglected. This terminal velocity is then used to update the NP position in the translational direction.
The fluid flow in our simulation is assumed to be an incompressible viscous fluid flow governed by the Navier–Stokes equations:
| (11) |
| (12) |
The Navier-Stokes equations are solved through Finite element method. The fluid velocity Vf is substituted into Eqn. (10) to calculate the NP terminal velocity.
4. Continuum model: Convection Diffusion Reaction Model
A finite element continuum model is also developed to evaluate the NP transport, diffusion, and binding dynamics at vascular scale. In this model, the convection and diffusion in the fluid domain are coupled with the adhesion occurring on the reaction surface. The transport of NPs in terms of particle concentration in the vascular medium is determined by the convection-diffusion equation,
| (13) |
where c is the particle concentration and D is the particle diffusivity. Particle diffusivity is calculated from the Stokes-Einstein equation for particles of different sizes [32]:
| (14) |
where μ is the viscosity of the fluid medium, and R is the effective particle radius. To incorporate the effect of adsorption of NPs on a functionalized surface the Langmuir reaction model is used [33]. The chemical reaction is a weakly reversible process because the NPs are either constantly captured on the receptor surface or constantly detached [34]. The material balance on the reactive surface for NP bonding is given by:
| (15) |
where cw is the bulk concentration of the NPs at surface, cs is surface concentration of binding NPs, ka and kd are attachment and detachment rates respectively. In our coupled particulate-continuum model, ka and kd are not constants, rather functions of shear rate and physical properties of particles [15, 23, 35], which are derived from the particulate model as described in section 5.
5. Linking particulate and continuum model: derivation of attachment and detachment rates
To predict NP distribution in a vascular network, it is important to combine an efficient continuum model together with an accurate molecular model. In particular, we will derive adhesion and detachment rates of NPs from molecular ligand-receptor binding dynamics. We assume that there are two critical near-wall layers where NPs need to transport through before binding with the reactive surface. A few basic assumptions are made as below:
There is a layer of particles on the reactive surface indicated as in the bottom with layer density N(y0) in Fig 2. The particle will bind with a shear rate dependent probability when a large enough number of ligand-receptor bonds are formed between the particle and wall, thus generating sufficient adhesion force on NP to resist the drag force[16]. The binding probability , where is the association constant at zero load of the ligand-receptor pair; Fdis is the dislodging force due to hydrodynamic forces; Nr, and Nl are the receptor and ligand density respectively; Ac is contact area; λ is the characteristic length of the ligand-receptor bonds.
-
There is another layer of free particles with density N(y1) above the reaction surface. Particles diffuse across a distance a on an average time interval τ, where .
Particles bonded will detach if the drag force is larger than the adhesion force.
Fig 2.

Particle binding model which shows several layers of particles close to the binding surface.
These assumptions are made for the convenience of mathematical approximation of the physics process of NP binding. The binding process is treated as two sub-processes: diffusion and reaction in each layer.
The NP binding rate at the surface can thus be approximated as the total number of binding particles per unit area divided by the time required for diffusion Td and reaction Tr.
| (16) |
where a characteristic length d is used to convert bulk concentration into NP surface density. Here d is chosen as the diameter of the particle and diffusion time is , the reaction time Tr has been given in Eqn.(6).
At the beginning of the binding process, there is no bonded particle, thus no detachment. Eqn. (15) can be simplified as:
| (17) |
Comparing Eqn.(16) and Eqn.(17), we have:
| (18) |
This is the analytical expression to approximate the attachment rate for NPs, which links molecular ligand-receptor binding rates to microscale NP attachment rates.
Experimentally the detachment rate is usually determined by flushing the adhered particles with a buffer flow and counting the number of detached particles. For detachment process, Eqn. (4) is reduced as:
| (19) |
with the initial condition of at t=0, which is obtained by considering the equilibrium case in Eqn.(4) [13]. Thus the density of ligand-receptor bonds decreases over time as:
| (20) |
The number of bonds decreases with time until the adhesion force cannot hold the particle from drag force that can be expressed as Cd v + 2Tor/r0 > Nb f. The time required to break enough bonds to detach NP is .
Thus, the detachment rate can be expressed by:
| (21) |
Eqn. (21) implies that NP detachment rate is proportional to ligand-receptor breaking rate kr, and is influenced by ligand density and hydrodynamic force.
Based on the parameters listed in Table 1, the detachment rate is found to increase with shear rate while the attachment rate is found to decrease with shear rate, as shown in Fig 3. Note that formula (18) and (21) can be easily extended to consider shear rate dependent forward and reverse reaction rates based on formula given in Eqn. (2) and (3).
Table 1.
Parameters used to evaluate attachment and detachment rate
| Parameters | Value | Description | Ref | |
|---|---|---|---|---|
| d | 100 [nm] | Diameter of the particle | [18] | |
| μ | 1×10⁻³ [pa · s] | Viscosity | [15] | |
| kr | 1.1×10− 4 [s−1] | Reverse rate of ligand | [15] | |
| kf | 11 [s−1] | Forward rate of ligand | [13] | |
| Cd | 1.98×10− 9 [kg/s] | Drag coefficient | Calculated | |
| f | 1×10⁻¹¹ [N] | Force per bond | [13] | |
| Nl | 21 [μm−2] | Ligand density | [15] | |
| ld | 20×10− 9 [m] | Bond length | [36] | |
| A |
|
Contact area | Calculated | |
| D | 4.3947×10⁻¹² [m2/s] | Diffusion coefficient | Calculated based Eqn.(14) | |
| C0 | 5×10⁹ [#/mL] | Concentration in the inlet | [15] |
Fig 3.

Attachment rate and detachment rate at different shear rates.
6. Comparison between Particulate and Continuum Model
To test the developed formula of ka and kd, a particulate model and a continuum model with the same configuration are compared.
First, we perform a benchmark case for the particulate and continuum model that are created with the same geometry and flow conditions, as shown in Fig 4.
Fig 4.
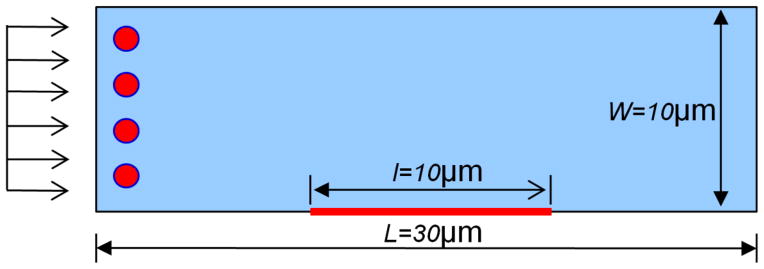
Schematic view of particle transport and absorption in a fluid channel.
In the particulate model, the fluid field is obtained by solving incompressible Navier-Stokes equations through finite element method. NPs motion is modeled by Brownian adhesion dynamics, as described in section 3 and 4. In the continuum model, coupled incompressible fluid dynamics, diffusion, and convection models are solved. The inlet is assigned with initial NP concentration c0; the outlet is open; other walls are insulated and nonslip; NP diffusion flux is set as ka cw − kd cs at the receptor coated surface. The model has 24496 2D triangular elements in the fluid domain while a finer mesh is used near the reactive surface. 100 nm NPs are injected into the channel with a reaction surface at the central bottom surface. The parameters used are listed in Table 1. The NPs binding time histories from the particulate model and the continuum model are plotted in Fig 5. The results from particulate and continuum models agree well with each other, which validates the formula in Eqn.(18). In the particulate model, a depletion layer is also observed around the binding region, where the number of NPs decreases due to the binding process, as shown in Fig 6. The particle distribution image is processed by averaging nearby number of particles into a concentration field so that it can be used to compare with results in the continuum model. Most of the fluid domain has uniform concentration (covered by the same red color) except some random spots where the concentration varies. This is due to the inherent nature of particulate model that randomness is inevitable to avoid.
Fig 5.

Binding time history comparison between continuum model and particulate model for 100 nm NPs at shear rate of 200 s−1.
Fig 6.

(A) Particle distribution in particulate model (PM); (B) Averaged particle concentration in PM; (C) Particle concentration in continuum model
To study the influence of shear rate on NP binding density, cases with various shear rates and NP sizes are created. The parameters used are similar to that listed in Table 1. The results are shown in Fig 7. It clearly shows that smaller 50 nm NPs have a higher binding rate due to faster diffusion and less reaction time compared to bigger 100 nm NPs. The binding rate of NPs increases with shear rates first, and decreases next. High shear rate has two effects on NP binding. On one hand, more particles pass through the reaction surface due to the large flux. On the other hand, high shear rate reduces the attachment rate by increasing the drag force. The final binding results are the competion between these two effects. The result from the continuum model matches reasonably well with the particulate model over a range of shear rates. Hence, the developed formulas of ka is valid for NPs delivery in a simple straight channel.
Fig 7.

Comparison of binding rates between particulate model (circles and rectangles) and continuum model (dashed lines) for NPs of 50 nm and 100 nm at different shear rates.
The developed coupled model has also been verfied in a more complex flow geometry, i.e., a branched channel. The geometry and dimensions of a symetrically branched channel are shown in Fig 8. Shear rate and concentration of NP at the inlet are 400 s−1 and 5×10⁹ #/mL, respectively. The diameters of NP are chosen as 100 and 200 nm. All other parameters are the same as those listed in Table 1. The region marked by bold lines in Fig 8A is the reaction area which is set in the vicinity of the bifurcation. The NPs binding histories from the particulate model and the continuum model are plotted in Fig 8B. The results from particulate and continuum models agree well with each other. This proves that the developed coupled model is applicable to non-straight channels with complex geometry and flow conditions.
Fig 8.

(A) Schematic view of NP transport and absorption in fluid channel; (B) Binding time history comparison between continuum model and particulate model for 100 and 200 nm NPs at shear rate of 400 s−1.
7. Comparison between our model and experimental data
The previous two cases show that the proposed adhesion formula Eqn. (18) can be used in the continuum model to predict NP delivery process at large scale yet still capture the molecular ligand-receptor binding dynamics. To further verify this formula, the simulated results are compared with the experimental data reported in the supporting data of Ref. [15]. The parameters used in the model and the experiment are listed in Table 2
Table 2.
Parameters used in our model to compare experimental data of adhesion rate
| Parameters | Value | Description | Ref | |
|---|---|---|---|---|
| d | 210 [nm] | Diameter of the particle | [15] | |
| μ | 1×10⁻³ [ pa · s] | Viscosity | [15] | |
| kr | 1.1×10⁻⁴ [s−1] | Reverse rate | [15] | |
| kf | 6.8×10⁻⁷ × {410, 1080, 3400} [s−1] | Forward rate | [15] | |
| Cd | 3πμd [kg/s] | Drag coefficient | [15] | |
| f | 1×10⁻¹¹ [N] | Force per bond | [13] | |
| Nl | {21, 41, 134} [μm−2] | Ligand density | [15] | |
| ld | 20×10−9 [m] | Bond length | [36] | |
| A |
|
Contact area | Calculated | |
| D | 2.1×10⁻¹² [m2/s] | Diffusion coefficient | Calculated based Eqn.(14) |
As shown in Fig 9, the adhesion rate increases with both ligand density and receptor density. The simulation results from our model agree well with the experimental data presented in Ref. [15].
Fig 9.

Comparison of adhesion rates between our model and the data presented in [15]
8. Discussions
In this paper, we presented a new and simple formula to link the molecular level ligand receptor forward binding rate (kf) and reverse binding rate (kr) to the continuum level attachment rate (ka) and detachment rate (kd) of NPs. It incorporates NP diffusion time to arrive the wall and reaction time to form enough ligand receptor bonds to hold NP against the drag force. Thus it is applicable to both transport limited and reaction limited NP binding. A dimensionless number γ is defined as the ratio of the reaction time over diffusion time, , to characterize the relative importance of each process. If γ < 1, it is a diffusion limited binding process, and if γ > 1, it is a reaction limited binding process. The dimensionless number γ associated with the cases studied in Fig 7 is plotted in Fig 10, where γ ranges from 0.3 to 15.2, thus covering both diffusion and reaction limited cases.
Fig 10.

Dimensionless number γ at different shear rates for 50 nm and 100 nm NPs. The black dotted line is the neutral condition where γ = 1
It is interesting to examine analytically the diffusion dominant case where γ ≪ 1. From the particulate model, we have the attachment rate expressed as:
| (22) |
From the continuum model, recall that the diffusive flux should be equal to bond formation rate at the wall . Combined with Eqn. (17), we have, , which gives exactly the same results shown in Eqn. (22). This proves analytically that the formula presented in Eqn. (18) is the same for particulate and continuum model for a diffusion dominant process.
For shear rates between 100 s−1 and 1000 s−1, the coupled formula predicts the binding results very well, with less than 10% difference between continuum and particulate results in most different cases. These variances are likely due to Brownian motion and particulate nature of the binding process near the wall. Theoretically, only when the number of particles near the wall is large enough can it be described with concentration as a continuum problem.
9. Conclusion and Future Work
In conclusion, we developed a coupled NP binding model which links particulate model and continuum model together. It provides a good estimation for NP binding density under different shear rates at a large scale. This coupled model could be to use to predict NP transport and distribution in a complex vascular system where direct measurements are difficult. Furthermore, the developed coupled formula is general and can be readily extended to model delivery of NPs of different sizes and shapes in a complex vascular geometry.
One limitation of this model is that the statistical nature of the NP bonds formation is not considered. Hence this is a deterministic model that can be used to obtain the average rate of NP binding. In the future, we plan to extend this model to a probability based model that includes stochastic nature of NP binding process.
Highlights.
Nanoparticle (NP) transport and binding process is modeled.
A coupled particulate and continuum nanoparticle delivery model is developed.
NP adhesion/detachment rates are derived from ligand-receptor binding constants.
The modeling results agree well with the experimental data.
Acknowledgments
The authors acknowledge the supports of this work from National Institute of Health (Grant EB009786) and National Science Foundation (Grant CBET-1113040).
Footnotes
Publisher's Disclaimer: This is a PDF file of an unedited manuscript that has been accepted for publication. As a service to our customers we are providing this early version of the manuscript. The manuscript will undergo copyediting, typesetting, and review of the resulting proof before it is published in its final citable form. Please note that during the production process errors may be discovered which could affect the content, and all legal disclaimers that apply to the journal pertain.
References
- 1.Sanhai WR, et al. Seven challenges for nanomedicine. Nat Nano. 2008;3(5):242–244. doi: 10.1038/nnano.2008.114. [DOI] [PubMed] [Google Scholar]
- 2.Wang AZ, Langer R, Farokhzad OC. Nanoparticle Delivery of Cancer Drugs. Annual Review of Medicine. 2012;63(1):185–198. doi: 10.1146/annurev-med-040210-162544. [DOI] [PubMed] [Google Scholar]
- 3.Jain RK, Stylianopoulos T. Delivering nanomedicine to solid tumors. Nat Rev Clin Oncol. 2010;7(11):653–664. doi: 10.1038/nrclinonc.2010.139. [DOI] [PMC free article] [PubMed] [Google Scholar]
- 4.Simone EA, Dziubla TD, Muzykantov VR. Polymeric carriers: role of geometry in drug delivery. Expert Opinion on Drug Delivery. 2008;5(12):1283–1300. doi: 10.1517/17425240802567846. [DOI] [PMC free article] [PubMed] [Google Scholar]
- 5.Decuzzi P, et al. Size and shape effects in the biodistribution of intravascularly injected particles. Journal of Controlled Release. 2010;141(3):320–327. doi: 10.1016/j.jconrel.2009.10.014. [DOI] [PubMed] [Google Scholar]
- 6.Pasqualini R, Ruoslahti E. Organ targeting In vivo using phage display peptide libraries. Nature. 1996;380(6572):364–366. doi: 10.1038/380364a0. [DOI] [PubMed] [Google Scholar]
- 7.Liu Y, et al. The shape of things to come: importance of design in nanotechnology for drug delivery. Therapeutic Delivery. 2012;3(2):181–194. doi: 10.4155/tde.11.156. [DOI] [PMC free article] [PubMed] [Google Scholar]
- 8.Arifin DY, Lee LY, Wang CH. Mathematical modeling and simulation of drug release from microspheres: Implications to drug delivery systems. Advanced Drug Delivery Reviews. 2006;58(12–13):1274–1325. doi: 10.1016/j.addr.2006.09.007. [DOI] [PubMed] [Google Scholar]
- 9.Grief AD, Richardson G. Mathematical modelling of magnetically targeted drug delivery. Journal of Magnetism and Magnetic Materials. 2005;293(1):455–463. [Google Scholar]
- 10.Shah S, Liu Y. Modeling Particle Shape-Dependent Dynamics in Nanomedicine. Jounal of Nanoscience and Nanotechnology. 2011;11(2):919–928. doi: 10.1166/jnn.2011.3536. [DOI] [PMC free article] [PubMed] [Google Scholar]
- 11.Glaser RW. Antigen-Antibody Binding and Mass Transport by Convection and Diffusion to a Surface: A Two-Dimensional Computer Model of Binding and Dissociation Kinetics. Analytical Biochemistry. 1993;213(1):152–161. doi: 10.1006/abio.1993.1399. [DOI] [PubMed] [Google Scholar]
- 12.Frieboes H, et al. Nanotechnology in Cancer Drug Therapy: A Biocomputational Approach. 2006:435–460. [Google Scholar]
- 13.Bell G. Models for the specific adhesion of cells to cells. Science. 1978;200(4342):618–627. doi: 10.1126/science.347575. [DOI] [PubMed] [Google Scholar]
- 14.Evans EA. Detailed mechanics of membrane-membrane adhesion and separation. II. Discrete kinetically trapped molecular cross-bridges. Biophysical Journal. 1985;48(1):185–192. doi: 10.1016/S0006-3495(85)83771-1. [DOI] [PMC free article] [PubMed] [Google Scholar]
- 15.Haun JB, Hammer DA. Quantifying Nanoparticle Adhesion Mediated by Specific Molecular Interactions. Langmuir. 2008;24(16):8821–8832. doi: 10.1021/la8005844. [DOI] [PubMed] [Google Scholar]
- 16.Decuzzi P, Ferrari M. The adhesive strength of non-spherical particles mediated by specific interactions. Biomaterials. 2006;27(30):5307–5314. doi: 10.1016/j.biomaterials.2006.05.024. [DOI] [PubMed] [Google Scholar]
- 17.Gentile F, Ferrari AGM, Decuzzi P. ON THE ADHESION OF PARTICLES TO A CELL LAYER UNDER FLOW. 2006. [Google Scholar]
- 18.Tan J, Thomas A, Liu Y. Influence of red blood cells on nanoparticle targeted delivery in microcirculation. Soft Matter. 2012;8(6) doi: 10.1039/C2SM06391C. [DOI] [PMC free article] [PubMed] [Google Scholar]
- 19.Prabhakarpandian B, et al. Synthetic microvascular networks for quantitative analysis of particle adhesion. Biomedical Microdevices. 2008;10(4):585–595. doi: 10.1007/s10544-008-9170-y. [DOI] [PMC free article] [PubMed] [Google Scholar]
- 20.Bell GI, Dembo M, Bongrand P. Cell adhesion. Competition between nonspecific repulsion and specific bonding. Biophysical Journal. 1984;45(6):1051–1064. doi: 10.1016/S0006-3495(84)84252-6. [DOI] [PMC free article] [PubMed] [Google Scholar]
- 21.Dembo M, et al. The Reaction-Limited Kinetics of Membrane-to-Surface Adhesion and Detachment. Proceedings of the Royal Society of London Series B, Biological Sciences. 1988;234(1274):55–83. doi: 10.1098/rspb.1988.0038. [DOI] [PubMed] [Google Scholar]
- 22.Cozens-Roberts C, Lauffenburger DA, Quinn JA. Receptor-mediated cell attachment and detachment kinetics. I. Probabilistic model and analysis. Biophysical Journal. 1990;58(4):841–856. doi: 10.1016/S0006-3495(90)82430-9. [DOI] [PMC free article] [PubMed] [Google Scholar]
- 23.Liu J, et al. Computational model for nanocarrier binding to endothelium validated using in vivo, in vitro, and atomic force microscopy experiments. Proceedings of the National Academy of Sciences. 2010;107(38):16530–16535. doi: 10.1073/pnas.1006611107. [DOI] [PMC free article] [PubMed] [Google Scholar]
- 24.Dri N, Shyy NAW, Tran-Son-Tay R. Computational Modeling of Cell Adhesion and Movement Using a Continuum-Kinetics Approach. Biophysical Journal. 2003;85(4):2273–2286. doi: 10.1016/s0006-3495(03)74652-9. [DOI] [PMC free article] [PubMed] [Google Scholar]
- 25.Fogelson AL, Guy RD. Immersed-boundary-type models of intravascular platelet aggregation. Computer Methods in Applied Mechanics and Engineering. 2008;197(25–28):2087–2104. [Google Scholar]
- 26.Lutters BCH, et al. Blocking endothelial adhesion molecules: a potential therapeutic strategy to combat atherogenesis. Current Opinion in Lipidology. 2004;15(5):545–552. doi: 10.1097/00041433-200410000-00008. [DOI] [PubMed] [Google Scholar]
- 27.Ermak DL, Mccammon JA. Brownian Dynamics with Hydrodynamic Interactions. Journal of Chemical Physics. 1978;69(4):1352–1360. [Google Scholar]
- 28.Li A, Ahmadi G. Dispersion and Deposition of Spherical-Particles from Point Sources in a Turbulent Channel Flow. Aerosol Science and Technology. 1992;16(4):209–226. [Google Scholar]
- 29.Einstein A. In: Investigations on the Theory of Brownian Movement. Fürth R, editor; Cowper AD, translator. New York: Dover Publ; 1956. 1926, reprinted 1956. [Google Scholar]
- 30.Mori N, Kumagae M, Nakamura K. Brownian dynamics simulation for suspensions of oblong-particles under shear flow. Rheologica Acta. 1998;37(2):151–157. [Google Scholar]
- 31.Berthier J, Silberzan P. Microfluidics for Biotechnology. Artech House; 2005. p. 374. [Google Scholar]
- 32.Won J, et al. Diffusion of Spheres in Entangled Polymer Solutions: A Return to Stokes-Einstein Behavior. Macromolecules. 1994;27(25):7389–7396. [Google Scholar]
- 33.Silberzan JBaP. Microfluidics for Biotechnology. 2006. (Artech House microelectromechanical systems series, Microelectromechanical systems series). [Google Scholar]
- 34.Kwon Hyun J, CKB, Dodge Brian T, Agoki George S. Study of Simultaneous Fluid and Mass Adsorption Model in the QCM-D Sensor for Characterization of Biomolecular Interactions. COMSOL Conference 2009; Boston. [Google Scholar]
- 35.Doshi N, et al. Flow and adhesion of drug carriers in blood vessels depend on their shape: A study using model synthetic microvascular networks. Journal of Controlled Release. 2010;146(2):196–200. doi: 10.1016/j.jconrel.2010.04.007. [DOI] [PMC free article] [PubMed] [Google Scholar]
- 36.Ward MD, Hammer DA. A Theoretical-Analysis for the Effect of Focal Contact Formation on Cell-Substrate Attachment Strength. Biophysical Journal. 1993;64(3):936–959. doi: 10.1016/S0006-3495(93)81456-5. [DOI] [PMC free article] [PubMed] [Google Scholar]