Abstract
The development of sophisticated and high throughput whole body small animal imaging technologies has created a need for improved image analysis and increased automation. The registration of a digital mouse atlas to individual images is a prerequisite for automated organ segmentation and uptake quantification. This paper presents a fully-automatic method for registering a statistical mouse atlas with individual subjects based on an anterior-posterior X-ray projection and a lateral optical photo of the mouse silhouette. The mouse atlas was trained as a statistical shape model based on 83 organ-segmented micro-CT images. For registration, a hierarchical approach is applied which first registers high contrast organs, and then estimates low contrast organs based on the registered high contrast organs. To register the high contrast organs, a 2D-registration-back-projection strategy is used that deforms the 3D atlas based on the 2D registrations of the atlas projections. For validation, this method was evaluated using 55 subjects of preclinical mouse studies. The results showed that this method can compensate for moderate variations of animal postures and organ anatomy. Two different metrics, the Dice coefficient and the average surface distance, were used to assess the registration accuracy of major organs. The Dice coefficients vary from 0.31±0.16 for the spleen to 0.88±0.03 for the whole body, and the average surface distance varies from 0.54±0.06 mm for the lungs to 0.85±0.10 mm for the skin. The method was compared with a direct 3D deformation optimization (without 2D-registration-back-projection) and a single-subject atlas registration (instead of using the statistical atlas). The comparison revealed that the 2D-registration-back-projection strategy significantly improved the registration accuracy, and the use of the statistical mouse atlas led to more plausible organ shapes than the single-subject atlas. This method was also tested with shoulder xenograft tumor-bearing mice, and the results showed that the registration accuracy of most organs was not significantly affected by the presence of shoulder tumors, except for the lungs and the spleen.
1. Introduction
Mice are widely used in preclinical studies because their biochemical interactions and pathways resemble human physiologic conditions. In the past two decades there have been many advances in small animal imaging techniques that facilitate or combine the non-invasive observation of anatomical and functional information from living mice. Along with the development of mouse imaging approaches, there is increasing demand of computerized image analysis to assist the definition of organ regions (Cheng-Liao and Qi, 2010; Khmelinskii et al., 2011a; Maroy et al., 2008), the quantification of molecular probe uptake (Maroy et al., 2010) and the construction of physiological models (Song et al., 2007; Zheng et al., 2011), so as to make data analysis less subjective, more accurate and faster. To serve these purposes, the registration of a mouse atlas to individual subjects is generally required to provide organ-level anatomical references. Various whole-body scale mouse atlases (Dogdas et al., 2007; Johnson et al., 2002; Khmelinskii et al., 2011a; Segars et al., 2004) have been developed and several approaches have been proposed to register these atlases with tomographic images like micro computed tomography (micro-CT) (Baiker et al., 2010; Baiker et al., 2011; Wang et al., 2012a), micro magnetic resonance imaging (micro-MR) (Khmelinskii et al., 2010), micro positron emission tomography (micro-PET) (Kesner et al., 2006) and micro single photon emission tomography (micro-SPECT) (Khmelinskii et al., 2011b).
In recent years, an emerging direction of small animal imaging uses limited-view projections instead of full tomography to guide the atlas registration. For example, Baiker et al. (Baiker et al., 2009) registered the mouse atlas with the body silhouettes captured by three optical cameras. Savinaud et al. and Zhang et al. (Savinaud et al., 2010; Zhang et al., 2009) used multiple-view optical photos or video sequences to fuse mouse atlases with optical molecular imaging. Li et al. (Li et al., 2009) developed a conical mirror to acquire laser scans of the entire animal surface and then registered the mouse atlas based on a surface-volume-combined elastic registration method (Joshi et al., 2010b). There are also efforts made to register 3D micro-CT images with multiple optical photographs of the same subject, based on 3D distance transform (Wildeman et al., 2009) or affine transformation (Xia et al., 2008). The benefits of using limited-view mouse atlas registrations are the reduced system complexity and cost, and the potential for high-throughput imaging and straight-forward organ region definitions. Due to simpler system design, the limited-view systems are also easier to integrate with molecular imaging modalities to provide combined functional/atlas information. In an overview of multiple potential limited-view mouse imaging systems (Wang et al., 2011), we simulated 11 combinations of three non-tomographic imaging devices (optical camera, planar X-ray and surface scanner) and compared the atlas registration accuracy of the 11 combinations. Based on the comparison, a mouse atlas registration system was designed composed of an anterior-posterior (AP) miniature X-ray projector and a lateral-view optical camera (Wang et al., 2012b). Fig. 1(a) illustrates the architecture of such a system. This system generates bi-planar projections where the X-ray presents the body region, the skeleton and the lungs, and the optical photo illustrates the lateral silhouette. Although the bi-planar projections do not provide full tomographic information, they already imply rich anatomical information because many low X-ray contrast organs (e.g. the brain, heart, liver, and kidneys) are anatomically correlated with the high X-ray contrast organs, (the body, skeleton and lungs), and the optical silhouette also reveals lateral spine curvature. Therefore, with a proper atlas registration method, a reasonable estimation of the whole-body anatomy can be achieved with the AP-view X-ray projection and lateral optical photo, as illustrated by Fig. 1(b).
Fig 1.
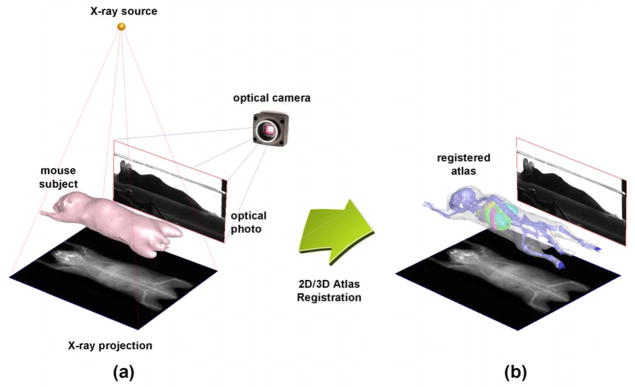
(a) The bi-planar mouse imaging system, including an AP-view X-ray projector and a lateral-view optical camera. (b) The purpose of this study is to register the mouse atlas with the bi-plane projections, and yield a 3D estimation of the mouse organ regions.
Beyond the preclinical field, 2D/3D atlas registration has been widely studied for clinical applications (Markelj et al., 2012), with the purpose of assisting image-guided interventions in bones and vascular structures (Groher et al., 2009). In recent years, statistical shape models (SSMs) became popular for 2D/3D atlas registration and have been applied to different bone parts like the femur (Baka et al., 2011; Hans et al., 2006; Zheng et al., 2009), the pelvis (Sadowsky et al., 2011; Yao and Taylor, 2003), the vertebrae (Benameur et al., 2003; Fleute et al., 1999) and the ribs (Dworzak et al., 2010). The SSM represents 3D organ shapes as a linear combination of the mean shape and the principal variations of the training set. By optimizing the combination coefficients of the SSM, the model can be fitted to the X-ray projections of the individual patient, leading to patient-specific reconstruction of anatomical models.
Compared with the clinical 2D/3D atlas registrations, the work presented here has unique challenges:
Most clinical applications target on local bony structures, while this study aims for the whole mouse body, which is a non-rigid multi-organ system with inter-subject variations of body postures and organ anatomies.
Not all the mouse organs have good contrast in the projection images. From the X-ray and optical images, only the body, the skeleton and the lungs can be distinguished, while other soft organs are visually imperceptible.
The number of projections involved in this study is limited (only two orthogonal projections), which poses challenges to accurate estimation of the atlas deformation.
To address the above challenges, the following strategies are used.
A statistical whole-body mouse atlas is constructed based on multiple training subjects. Statistical shape models (SSM) of the mouse organs are constructed to represent the inter-subject variations of postures and organ anatomies.
The organs in the atlas are divided into two groups according to their contrasts in the projection images, i.e. the high contrast group and the low contrast group. The anatomical correlation between the two groups is represented with a conditional Gaussian model (CGM) and thin-plate-spline (TPS) interpolation.
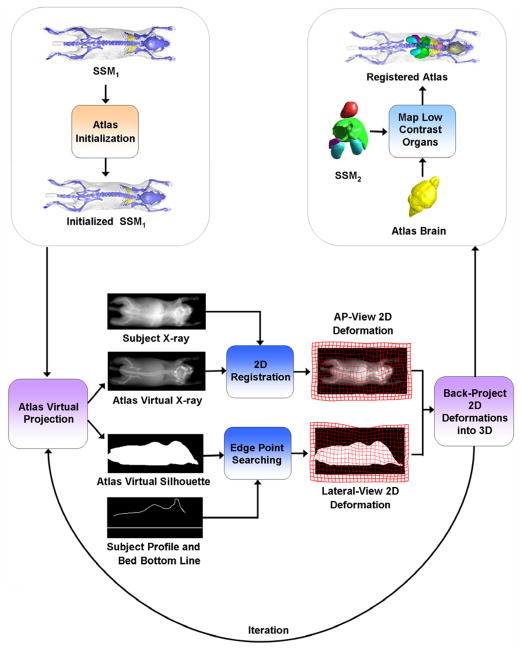
For atlas registration, the SSM of the high contrast group is first registered with the X-ray and optical images, and then the low contrast group is mapped using the CGM and the TPS interpolation.
To register the atlas with the limited number of projections, we use a 2D-registration-back-projection strategy which registers the atlas projections in 2D, and then back-projects the 2D registration results to 3D to guide the deformation of the atlas.
2. Methods
2.1. Statistical mouse atlas
Due to the articulated skeleton motion and the variations in strain, weight, sex and age, normal laboratory mice present significant inter-subject differences of body postures and organ shapes. To overcome these differences, existing mouse atlas registration methods generally use a global non-rigid deformation to match a single-subject atlas with the target subject. However, this global deformation is inadequate to compensate for local organ differences. Moreover, since the deformation is normally derived from the mapping of skin or skeleton, it tends to distort the internal organs which don’t always follow the skin/skeleton deformations. To address these problems, we constructed a statistical mouse atlas from multiple training subjects instead of only one subject. Using the statistical shape model, the modes of inter-subject posture differences and organ deformations are learned from the training population. In one of our previous studies (Wang et al., 2012a), a statistical mouse atlas was constructed for the trunk region. In this study, we extend the atlas from the trunk to the whole-body, and increase the training sample size (from 45 to 83) to improve the coverage of subject variability. In the following paragraphs, we will briefly describe the atlas construction method and highlight the differences from the previous work.
The training set includes 83 healthy subjects of different strains, age, and sex selected from the database of the Crump Institute for Molecular Imaging, UCLA (Stout et al., 2005). Three commonly used strains (Nude, C57Bl/6 and severe-combined immunodeficient (SCID)) were included and the body weights varied from 15 g to 40 g. The training subjects were imaged at prone positions inside standardized multimodality imaging chambers (Suckow et al., 2009). Although these chambers provide moderate constrains of subject posture, random flexures of the spine and limbs were included in the training set. The Fenestra™ (ART, Quebec, Canada) liver-contrast agent was used to enhance the contrast of soft organs. Human experts were invited to segment the major organs from the micro-CT images, including the skin, skeleton, heart, lungs, liver, spleen and kidneys. The segmented organs were converted into triangular surface meshes, and the vertex numbers for different organ meshes were: 3000 for each of the skin and skeleton, 1500 for each of the lungs and liver and 800 for each of the heart, spleen and kidney. To establish the vertex correspondence between the training subjects, a reference subject was selected for each organ (except for the skeleton) and registered to the rest of the training subjects using the point set registration method based on Gaussian mixture models (Bing and Vemuri, 2005). For the skeleton, the point set registration method doesn’t work well due to the skeleton’s articulated nature, therefore the articulated skeleton atlas (Khmelinskii et al., 2011a) was used and registered to each training subject to obtain the vertex correspondences.
To describe the inter-subject anatomical/postural variations, the statistical shape model (SSM) was constructed based on the corresponding mesh vertices. The SSM is based on a linear point distribution model described as
| (1) |
where V ∈ R3N is a shape instance of the model represented as a column vector concatenated with the coordinates of N mesh vertices, V̄ ∈ R3N is the mean value of the shape instances in the training set, Φ∈ R3N×k is the matrix of k shape variation modes, which are obtained using the principal component analysis (PCA) of the mesh vertices and b∈ Rk represents the shape coefficients that control the linear combination of the variation modes.
As explained in the introduction section, the organs are divided into two groups. The first group was composed by the skin, skeleton and lungs, which present high contrast in the X-ray or optical images. The second group was composed by the low contrast organs including the heart, liver, spleen and kidneys. For each of the two groups, all the organs belonging in that group are modeled as a single object by concatenating the vertex coordinates of multiple organs into a single vector. The purpose of doing this is to guarantee that multiple organs deform in accordance with each other (i.e. avoiding organ intersections). The shape vector of the high contrast group is represented as
| (2) |
where NH =Nskin+Nskeleton+Nlungs, and Nskin, Nskeleton, and Nlungs are the number of vertices of the skin, skeleton and lungs, respectively; , with ( ) being the 3D coordinates of the jth vertex of training subject i. The same notations also apply to skeleton and lungs. Similarly, the shape vector of the low contrast group is defined as
| (3) |
where NL =Nheart+Nliver+Nspleen+Nleft kidney+Nright kidney, and Nheart, Nliver, Nspleen, Nleft kidney, and Nright kidney are the number of vertices of the heart, liver, spleen, left kidney and right kidney, respectively.
Two SSMs, namely SSMH and SSML, are constructed for the high and low contrast groups based on the training sets of and , respectively. To integrate into the atlas model, the anatomical correlation between SSMH and SSML was described using the conditional Gaussian model (CGM),
| (4) |
where bH and bL are the shape coefficients of SSMH and SSML, respectively; b̄L|H and ΣL|H are the mean and covariance of the conditional distribution between bH and bL; b̄H, ΣH and b̄L, ΣL are the mean and covariance of bH and bL; ΣL,H and ΣH,L are the cross-covariance between bH and bL, respectively. The values of b̄H, ΣH, b̄L, ΣL, ΣL,H and ΣH,L are estimated from the training set.
The CGM provides a method to estimate the conditional distribution of low contrast organs according to the registered high contrast organs. In this study, the CGM was used for the heart, liver, spleen and kidneys, but not for the brain, which is highly correlated to the skull cavity. For the brain, simple TPS interpolation is sufficient to obtain reasonable brain mapping. The brain structures of the Digimouse atlas (Dogdas et al., 2007) were borrowed for this study, and the skull vertices of the articulated skeleton atlas were used as the TPS control points.
2.2. Registration method
The workflow of the proposed method is demonstrated in Fig. 2 and a supplementary video of the web version of this article. The atlas is registered in a hierarchical manner: SSMH is registered first, then the low contrast organs are mapped based on the registered SSMH. The registration of SSMH is an iterative process. In each iteration, SSMH is virtually projected as an AP-view X-ray and a side-view silhouette, and these virtual projections are registered with the measured subject projections in 2D, resulting in 2D deformations of each virtual projection. At last the 2D deformations are back-projected into 3D space, and the SSMH is deformed via the back-projected 3D deformation. The details of each step are explained in the following subsections.
Fig 2.
Workflow of the registration method.
2.2.1. Preprocessing of the input images
Previous to the registration, camera calibrations are performed for both the AP- and lateral-views, and the X-ray and optical images are corrected for perspective and barrel distortions. As shown in Fig.1, the ventral part of the optical silhouette is blocked by the imaging chamber that supports the subject. To eliminate the influence of the imaging chamber, the optical photo is cropped, leaving only the dorsal silhouette (Fig.3(c)). Binary body regions are extracted from both the X-ray image (Fig.3(b)) and the optical photo (Fig.3(d)), using the ISODATA clustering method (Velasco, 1980). For the X-ray, 10 clusters are segmented and the darkest cluster is classified as the background; for the optical photo, two clusters are segmented and the brightest cluster is classified as the background. To facilitate subsequent registration, the back contour (Fig.3(e)) of the mouse is extracted from the lateral body region (Fig.3(d)). To compensate for the missing information of the ventral silhouette, the bottom line of the mouse bed (Fig.3(e)) is added underneath the back contour by projecting the known location of the mouse bed surface onto the lateral image. Since the position of the bed is fixed in the imaging system gantry, the bed projection only needs to be performed once for each imaging system.
Fig 3.
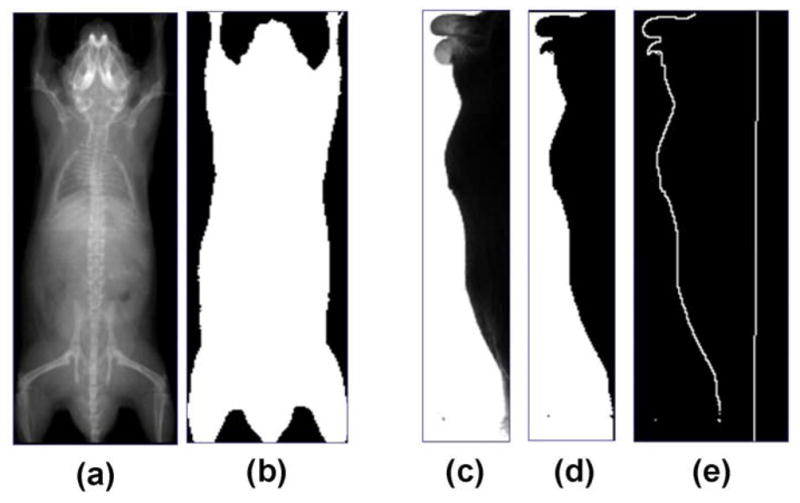
Preprocessing of the X-ray image and the optical photo. (a) Input X-ray image. (b) Segmentation of body region from (a). (c) Input optical photo. (d) Segmentation of body region from (c). (e). Contour of mouse back extracted from (d), with the bed bottom line obtained by projecting the known location of the mouse bed onto the lateral-view image.
2.2.2. Atlas initialization
At the very beginning of the registration, the mean shape of SSMH is automatically placed at a fixed position and orientation in the imaging system gantry space. Then, initial adjustment of the atlas position, size and shape is calculated to give a rough alignment in whole-body scale. The initial adjustment is described by a transformation Tinit = [l, bH] that is applied to SSMH, where l ∈ R9 is a 3D linear transformation, including three translations, three rotations and three anisotropic scaling factors; bH ∈ R24 is as described above, the shape coefficient of SSMH, which contains 24 principal components that represent 95% of the training set variations. The purpose of the initialization step is to optimize the value of Tinit to minimize the discrepancy between the virtual atlas projections and the measured subject projections in both projection views. We use an iterative optimization scheme to achieve this goal. For each iteration, a new value of Tinit is evaluated; the evaluated Tinit value is applied to SSMH to calculate the 3D vertex coordinates of the high contrast organs:
| (6) |
where L is the linear transform corresponds to l, V̄H and ΦH are the mean shape and shape variation matrix of SSMH, respectively. Binary ray-tracing is performed to project the mesh of VH into AP- and lateral-views by judging whether the projection ray is blocked by the skin mesh triangles. These projections produce two 2D binary images of the atlas body region, which are compared with the 2D body regions of the subject (as shown in Fig.3.(b) and (d)) based on the Kappa Statistics (KS) metric (Zijdenbos et al., 1994),
| (7) |
where NA,S is the number of pixels of value 1 in the projection images of both the atlas and the subject, NA is the number of pixels of value 1 only in the atlas projection image, and NS is the number of pixels of value 1 only in the subject projection image. KS has the range of [0, 1] where 0 means no overlap and 1 means complete overlap. The combined discrepancy metric of the two projection views between the atlas and the subject is defined as (1-KSX)+(1-KSC), where KSX and KSC indicates the KSs of the X-ray and optical camera images, respectively. To minimize this discrepancy metric with respect to Tinit, the Powell method (Powell, 1964) which does not require explicit derivatives is used, because it is not straightforward to derive analytical functions between 3D mesh and its binary projections. The initial values of l and bH are set to the identity transform and 0, respectively. To accelerate the convergence and avoid local minima, l is optimized first by keeping bH as 0, and then followed by a joint optimization of l and bH. Please note that during the Powell optimization, only the skin part of SSMH is used for the binary projection. The skeleton and lungs are not projected because the binary projection rays are blocked by the skin thus cannot reach the internal organs. As a result, the Powell method will only optimize the skin deformation, but the skeleton and lungs will follow the skin deformation, because the skin, skeleton and lungs are all modeled together as a single object (see section 2.1, equation (2)). This is the first step necessary for initialization of the atlas registration.
2.2.3. 2D registration of the projections
After initialization, SSMH enters the iteration loops of 2D-registration-back-projection. At the beginning of each loop, SSMH is projected into both AP- and lateral-view, generating the virtual X-ray projection and virtual lateral silhouette of the atlas (as shown in Fig.2). The virtual X-ray projection is generated using the mesh-based ray-tracing approach (Wang et al., 2011) which computes the X-ray attenuation based on the traveling distance inside different tissues. The virtual lateral silhouette is generated using the binary projection approach described in section 2.2.2.
The virtual X-ray projection of SSMH is registered with the subject X-ray projection using the mutual information-based 2D B-spline registration method (Thevenaz and Unser, 2000). The size of the B-spline control grid is 10×10 pixels. A multi-resolution registration scheme with five levels is used to accelerate the registration. The down-sampling ratios for the five resolutions are 16, 8, 4, 2 and 1 and an adaptive stochastic gradient descent algorithm is used as the optimizer. The registration is implemented using the elastix software (Klein et al., 2010). The output of the registration is the 2D deformation field DX : R2→R2 that maps the atlas X-ray to the subject X-ray, and DX is represented as the 2D B-spline interpolation of the control grid point displacements. To obtain the atlas deformation from the AP-view, all the vertices (including skin, skeleton and lungs) of SSMH are projected onto the X-ray image plane. Let VH be the 3D vertex coordinates of SSMH, and PX : R3→R2 be the projection from 3D space to the 2D X-ray image plane, the 2D projection of VH on the X-ray image plane is , and then DX is applied to to obtain the deformed coordinates of the projected vertices.
In a difference from the X-ray registration, we do not use mutual information-based 2D B-spline registration for the optical lateral silhouette registration. Instead, we use edge point searching and 2D thin-plate-spline (TPS) interpolation. This is because the lateral silhouette does not contain any anatomical structure inside the body region for the B-spline registration to match with. In this case, simple edge point searching is more efficient than the 2D B-spline registration. As demonstrated in Fig. 4, from each edge point of the atlas silhouette (gray line), line searching is performed along the edge normal to find the nearest subject silhouette edge (white line) (as shown in Fig.3(e)). The result of the line search is the vectors (red arrows) which point from the edge of the atlas silhouette to the edge of the subject silhouette. The 2D deformation field DC : R2→R2 of the lateral image is represented as the 2D TPS interpolation of the edge point vectors. Let PC : R3→R2 be the projection from 3D coordinate to 2D optical camera image coordinates, the 2D projection of VH onto the camera image plane is calculated as , and then DC is applied to to obtain the deformed coordinates of the projected vertices.
Fig 4.
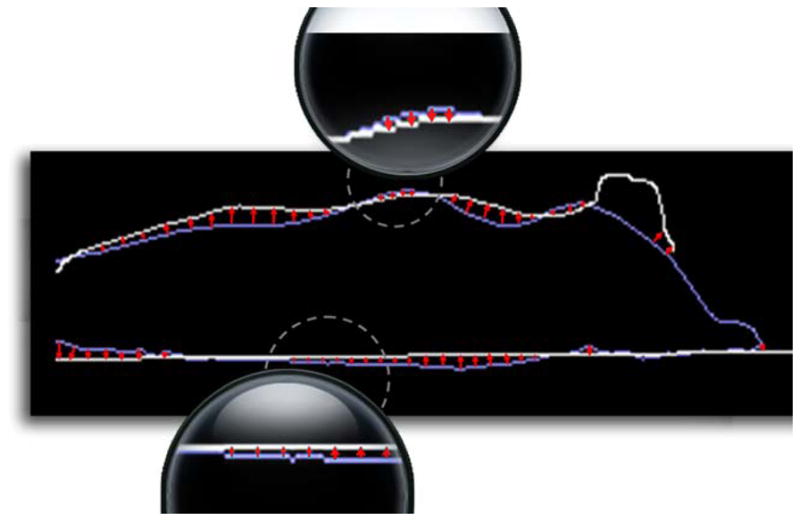
Edge point searching of the lateral-view silhouette. Line searching is performed for the edge points on the atlas silhouette (blue color) to find the corresponding edge points on the subject silhouette (white color). The red arrows indicate the deformation vectors of the atlas silhouette edge. Local parts (in dashed circles) with small arrows are magnified for clearer view. (For interpretation of the references to colors in this figure, the reader is referred to the web version of this article.)
2.2.4. Back-project 2D deformations into 3D
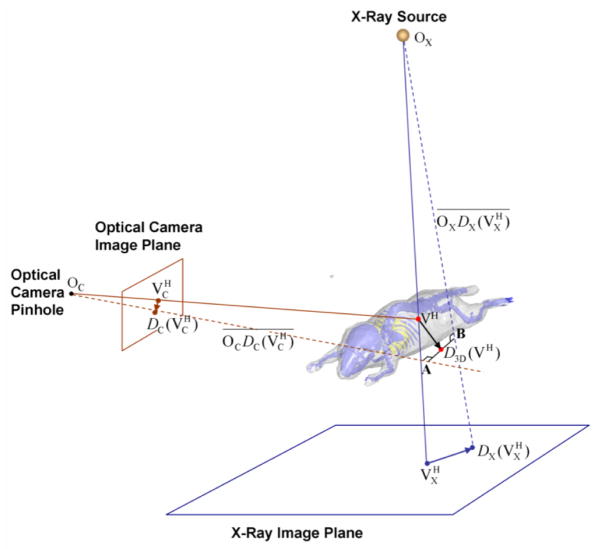
After the 2D registrations are accomplished, the 2D deformations of the two virtual projection views are back-projected into 3D to derive a 3D deformation of the atlas. The principle of the back-projection is illustrated by Fig.5, in which only one vertex (the red dot VH) of SSMH is demonstrated for clarity. Let OX and OC be the X-ray point source and the camera pinhole, respectively. Let be the 3D line connecting OX and , and be the 3D line connecting OC and . The back-projected 3D deformation is D3D defined as
Fig 5.
Illustration of back-projecting the 2D deformations into 3D.
| (8) |
where CP ( )is the function that calculates the closest point to the two lines and , i.e. D3D(VH) is the midpoint of the shortest connection between and , where the shortest connection is shown as line section AB in Fig.5. The calculation of the closest point between two skew 3D lines is an analytical geometry problem which can be solved in various ways. We refer to (Ericson, 2005) for an efficient solution.
The back-projection provides straight-forward guidance of the 3D atlas deformation. However, the back-projected 3D deformation might be anatomically implausible, because there may be conflicts between the two 2D deformations, and each 2D deformation is also subject to the anatomical ambiguity caused by the 3D to 2D projections. To obtain anatomically plausible results, we project D3D(VH) into the shape space of the statistical atlas, using similar strategy to the active shape models (Heimann and Meinzer, 2009). As a result, the shape coefficient of SSMH is updated as
| (9) |
where (ΦH)+ is the pseudo-inverse of ΦH, and Sim is a 3D similarity transformation (including three translations, three rotations and one scaling). Sim satisfies the minimization of the summed squared distance ||Sim (D3D (VH))– V̄H|| and is calculated using the Generalized Procrustes Analysis (Bookstein, 1996). Finally, the vertices of SSMH are updated as
| (10) |
where Sim−1 is the inverse transform of Sim. Based on the updated VH, the registration proceeds into the next iteration loop, and the 2D registrations and back-projections are repeated consecutively until convergence. The criteria of convergence is datlas<ε, where datlas is the mean vertex distance of the deformed atlas between two loops, and ε is set to 0.2 mm, which is the voxel size of micro-CT images used for the atlas construction.
2.2.5. Map low contrast organs
After SSMH is registered, SSML is mapped using the CGM. The details of CGM-based organ mapping can be referred to (Wang et al., 2012a), and the basic principle has been described by equation (2). As a result of the CGM-based mapping, the low contrast organs closely follow the deformation of the high contrast organs without appreciable intersections. Finally, the brain is mapped using TPS-interpolation via the skull control points, as described in section 2.1.
3. Test data and validation metrics
The registration method was validated based on imaging studies performed by researchers at the Crump Institute for Molecular Imaging at UCLA. The AP-view, X-ray projection and lateral-view optical photos of the mice were acquired with the mouse atlas registration system (MARS) (Wang et al., 2012b) which is integrated into the Genisys4™ micro-PET scanner (Sofie Biosciences, Culver City, U.S.A.). The X-ray imaging protocol was 40 kVp, 100 μA, and 3 sec exposure, the output image was 1024×1000 pixels, each measuring 96x96μm. The optical photo was acquired with a 5mm focal length lens and 200 ms exposure, and the output image was 640×480 pixels, covering ~71×53 mm2 field of view at the imaging plane.
In total, 55 subjects were involved in this validation, including 38 normal subjects and 17 tumor-bearing subjects with shoulder subcutaneous xenografts. The tested subjects were separated from the atlas training set. The test set included four commonly used strains (29 black C57Bl/6 mice, 15 Nude mice, nine SCID mice and two C3H agouti mice), and the body weights varied from 17 g to 45 g. All the subjects were imaged with prone positions inside multimodality imaging chambers. The normal subjects were used to test the method’s ability to handle different postures and body sizes, as well as the method’s convergence properties and registration accuracy. The tumor-bearing subjects were used to evaluate the influence of tumors on the registration accuracy.
To evaluate the registration accuracy of internal soft organs, the Fenestra™ liver-contrast agent was used for 14 of the normal subjects and 5 of the tumor-bearing subjects. The injection dose of the contrast agent was minimized to maintain reasonable CT contrast without undermining the spine contrast in the X-ray projections. Immediately after X-ray projection and photograph imaging in the MARS, tomographic micro-CT scans of the 19 contrast-enhanced subjects were acquired, and the animal motion between the MARS and CT imaging was minimized by the multimodality imaging chambers with anesthesia (Chow et al., 2006). The CT system was a MicroCAT II small animal CT scanner (Siemens Preclinical Solutions, Knoxville, TN, USA). The exposure settings were 70 kVp, 500 mAs, 500 ms and 360° rotation in 1° steps with 2.0 mm aluminum filtration. Images were reconstructed using a modified Feldkamp process to isotropic voxel size 0.20 mm, and a matrix size 256×256×496.
Human expert segmentations of the contrast enhanced micro-CT images were used as reference standard for organ regions. The micro-CT images were rigidly aligned with the MARS coordinate space by projecting the outlines of the segmented skin, skeleton and lungs onto the X-ray images and optical photos. Manual fine-tuning of the 3D rigid transformation (including three translations and three rotations) was applied to make sure the projected CT organ outlines matched the organ edges of the X-ray and optical images. Two accuracy metrics, the Dice coefficient and the averaged surface distance (ASD), were used to evaluate the registration accuracy. The Dice coefficient is defined as
| (11) |
where RA and RS represent the organ region of the registered atlas and the expert segmentation, respectively (|·| denotes the number of voxels and ∩ means the overlap between two regions). The Dice coefficient has the value range of [0, 1], where 1 corresponds to complete overlap and 0 corresponds to no overlap. The ASD is defined as
| (12) |
where nA and nS are the number of vertices in the surface mesh of the registered atlas and the expert segmentation, respectively. di is the minimum distance from the ith vertex of the atlas surface to all the vertices of the expert segmentation surface, and dj is the minimum distance from the jth vertex of the expert segmentation surface to all the vertices of the atlas surface. Based on this definition, smaller ASD means better registration accuracy.
4. Results
4.1. Visual inspection of registration results
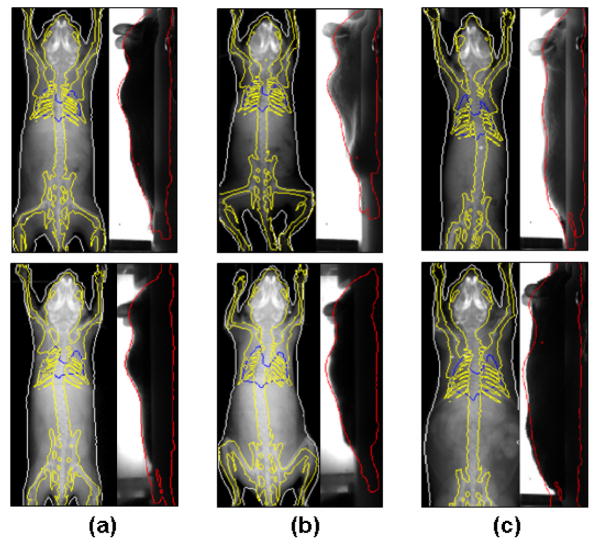
Although the investigators performing the experiments were asked to position the animals in prone positions with stretched limbs, the test subjects still presented moderate posture variations across the test dataset. The purpose of the normal subject evaluation was to validate the ability of the proposed method to match subjects with various postures, body size and internal anatomy. Fig. 6 and 7 demonstrate the results of twelve representative subjects from the total of 38 normal subjects. To visually compare the registered atlas with the target subjects, the organ outlines of the registered atlas are projected onto the X-ray and optical images. For clarity, the organs are divided into two groups for display. Fig. 6 shows the outlines of high contrast organs, i.e. the skin, skeleton and lungs, while Fig. 7 shows the outlines of internal soft organs, i.e. the brain, lungs, heart, liver, spleen and kidneys. Fig.6(a) shows two subjects with normal body size and standard posture; Fig.6(b) presents two subjects with irregular posture, with different limb orientations and spine curvatures; Fig.6(c) demonstrates two subjects with different body size, where the upper one is underweight and the lower one is overweight. Fig.7(a) also shows two subjects with different body sizes, where the upper one is overweight and the right one is underweight. Fig.7(b) displays two subjects with different spine curvature from the AP-view, where the upper one curves to the left and the lower one curves to the right; Fig.7(c) displays two subjects with different spine curvature from the lateral-view, where the upper one has a stretched spine and the lower one has a curved spine. Overall, the registration method is capable to provide close registration of the high contrast organs and reasonable estimation of the internal soft organs.
Fig 6.
Registration results of high contrast organs for the normal subjects. The organ outlines are projected onto the X-ray and optical images, respectively. Different organs are distinguished with different colors; White, skin; Yellow, skeleton; Blue, lungs. (For interpretation of the references to colors in this figure, the reader is referred to the web version of this article.) (a) Two subjects with normal body sizes and standard postures. (b) Two subjects with irregular postures, and different open angles of the fore and hind limbs. (c) Two subjects with different body sizes: the upper one is underweight and the lower one is overweight.
Fig 7.
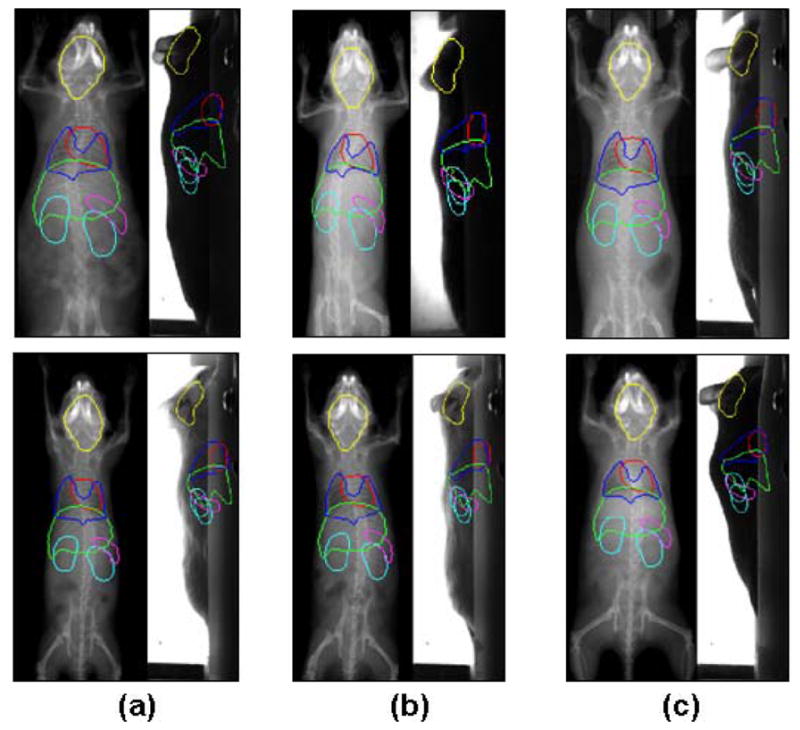
Registration results of low contrast (soft tissue) organs of the normal subjects. The organ outlines are projected onto the X-ray and optical images, respectively. Different organs are distinguished with different colors; Yellow, brain; Red, heart; Dark blue, lungs; Green, liver; Purple, spleen; Light green, Kidneys. (For interpretation of the references to colors in this figure, the reader is referred to the web version of this article.) (a) Two subjects with different body sizes: the upper one is overweight and the lower one is underweight. (b) Two subjects with different spine curvatures from the AP-view. (c) Two subjects with different spine curvatures from the lateral-view.
4.2. Quantitative evaluation of atlas registration accuracy
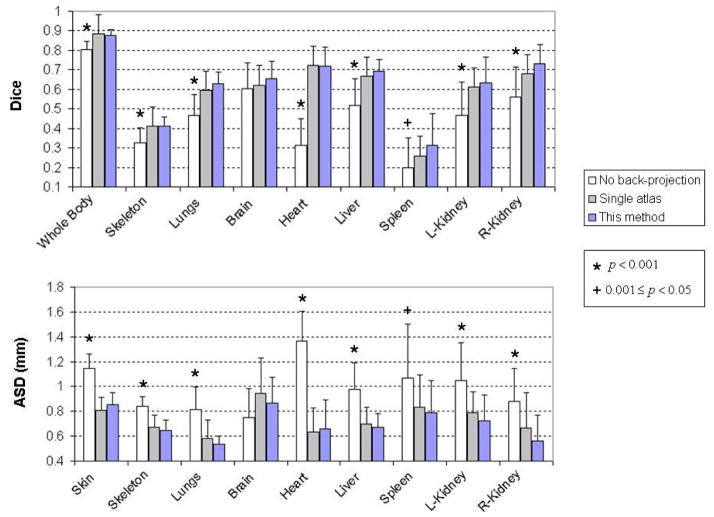
Based on the 14 contrast-enhanced normal subjects, the Dice coefficients and ASD were calculated for the skin, skeleton, lungs, brain, heart, liver, spleen and kidneys. In the Dice evaluation, the skin is also called “whole body”, since even though the skin is a surface object, it coincides with the whole body as the volumetric region enclosed by the skin. Fig.8 demonstrates the box and whisker plots of the Dice coefficients and ASD for the major organs. It can be seen that most organs have median Dice coefficients over 0.5 (except for the skeleton and the spleen) and median ASD below 0.8 mm (except for the skin and the brain). The reason of the organ-dependant accuracy will be discussed in the discussion section.
Fig 8.

Dice coefficient and average surface distance (ASD) for the major organs of the 14 normal test subjects.
Since the skin and skeleton are whole-body scale organs, it is important to measure the regional registration accuracy for different parts of the skin and the skeleton. Fig. 9 illustrates the average local surface distance of the skin and skeleton across the 14 normal subjects. The local surface distance is measured as the minimum distance from each vertex of the atlas mesh to all the vertices of the CT segmentation surface mesh. It can be seen that for most parts of the skin and skeleton, the average local surface distance is less than 1.4 mm. Comparing the skin with the skeleton, the skin has larger surface distance than the skeleton at each corresponding location, because the 3D shape of the skin is more difficult to be determined from bi-planar projections. The hindlimbs have larger surface distance than the forelimbs because the hind-limbs in our implementation are always out of the X-ray field of view. The dorsal part of the head has larger surface distance for both skin and skeleton, because the presence of the ears slightly biases head registration. The dorsal part of the back skin and the spine have relative larger surface distance than their surroundings, because the atlas fitting tends to sacrifice this small and high-curvature part to optimize global fitting.
Fig 9.
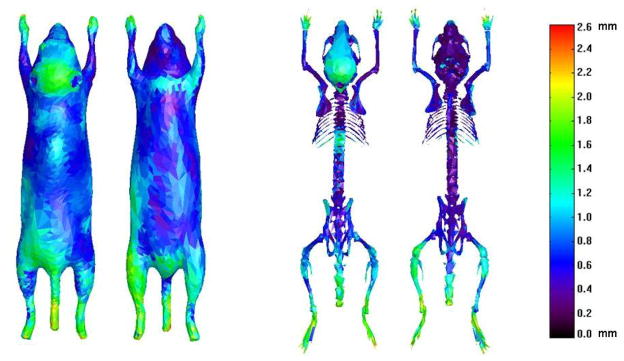
Average local surface distances of the registered atlas skin and skeleton. Both the dorsal and ventral views are shown for the skin and skeleton.
4.3. Evaluation of convergence properties
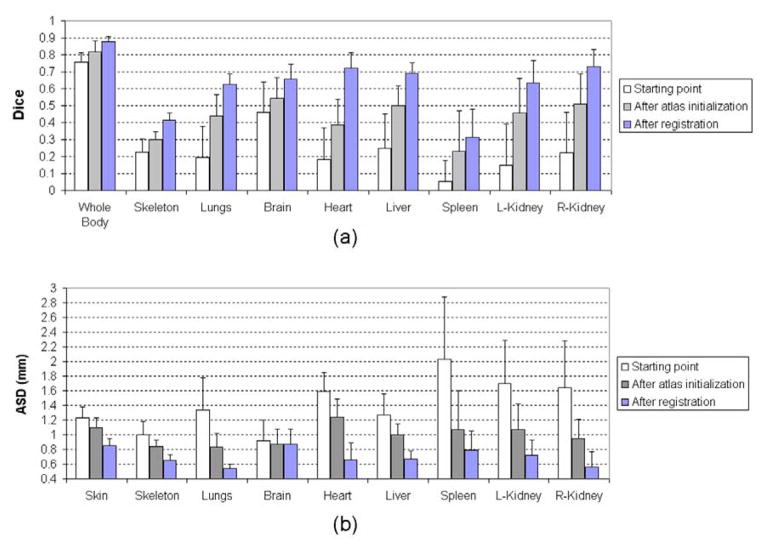
The proposed registration method has three major steps: the starting point where the mean shape of SSMH is placed at a fixed starting position, the atlas initialization step where the shape and size of SSMH is initialized according to the binary body regions, and the final registration step where SSMH is registered via an iterative process. To evaluate the accuracy of the three steps, the Dice coefficient and ASD were calculated at the end of each step, based on the 14 normal contrast enhanced subjects. To observe the influence of high-contrast organ accuracy on low-contrast organ accuracy, the low-contrast organs were mapped for the results of each step. Fig. 10 demonstrates a visual example of the registered atlas at each step (from the left to the right are the starting point, after atlas initialization and after registration, respectively), and the mean values and standard deviations of Dice coefficients and ASDs of each step are shown in Fig.11(a) and (b), respectively. It is clear that the accuracy improves and the standard deviation decreases as the registration progresses from the first to the last step. It can also be seen that the accuracy of low contrast organs improves from the first to the last step, meaning the accuracy of low contrast organs is directly affected by the high contrast organs.
Fig 10.
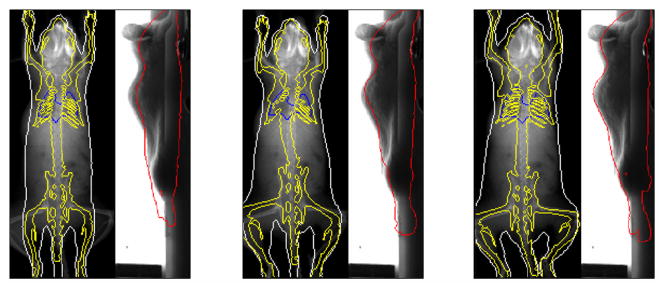
An example of the registered atlas at each step. From the left to the right: the starting point, after atlas initialization and after registration.
Fig 11.
Registration accuracy of the different steps of the proposed method. (a) Dice coefficients of different organs at each step. (b) ASDs of different organs at each step.
As a validation of the convergence speed, the entire registration took 176±45 (mean ± standard deviation) seconds on a PC with a 3.05 GHz CPU and 5.99 GB RAM, with the final registration step requiring an average of 6.4±2.2 iteration loops. The registration method was programmed with IDL 7.1 (ITT Visual Information Solutions, Boulder, CO, USA), except that the atlas initialization step was programmed with C++, and the 2D X-ray registration was realized by calling the external elastix software.
4.4. Comparison with other registration methods
The proposed method has two main features, i.e. the 2D-registration-back-projection strategy and the use of a statistical mouse atlas. To validate the effectiveness of the two features, a comparison test was performed by turning off each feature separately:
Turning off the back-projection strategy means that the atlas deformation is optimized directly in 3D. Direct 3D optimization has been used in several clinical studies (Benameur et al., 2003; Fleute et al., 1999; Yao and Taylor, 2003) to register a statistical bone model to X-ray projections. In a previous study (Wang et al., 2012b), we also used such a strategy to register the statistical mouse atlas with the AP-view X-ray projection and lateral-view optical photo. To realize this, the deformation of SSMH (T=[l, bH] similar as introduced in section 2.2.2) was optimized to maximize the similarity between the projections of the atlas and the subject. The initial values of l and bH were set to identity transform and 0, respectively. The registration was executed iteratively, and at each iteration the similarity (fX) between the atlas X-ray projection and the individual X-ray projection was measured with mutual information (Wells et al., 1996), and the similarity (fS) between the atlas silhouette and the individual silhouette was measured with 1-KS (KS is the Kappa Statistics introduced in section 2.2.2). The Powell method was used to obtain the optimal T value that minimized the combined similarity f = fX + fS . A tri-resolution scheme was used to accelerate the registration and the down-sampling ratios of the three resolutions were 4, 2 and 1. After SSMH was registered, the low contrast organs were mapped in the same way as described in section 2.2.5. In this work, the direct 3D optimization method is called no back-projection.
Turning off the statistical mouse atlas means using a single-subject atlas for the registration. This is the general strategy used by most existing 2D/3D mouse atlas registration methods (Baiker et al., 2009; Joshi et al., 2010b; Savinaud et al., 2010; Wang et al., 2011; Zhang et al., 2009). For our test, the single-subject atlas was created by combining the mean shapes of SSMH and SSML, as well as the brain structures from the Digimouse atlas. The atlas initialization step was similar as in section 2.2.2, but only l was initialized because a single-subject atlas doesn’t have shape coefficients b. For registration, the skin, skeleton and lungs of the single-subject atlas were virtually projected and registered in 2D, and then the back-projection was applied to derive the 3D deformation (similar as section 2.2.4). However, the back-projected deformation was not smoothed as in section 2.2.4, because the single-subject atlas doesn’t have the atlas deformation space which must be learned from multiple training subjects. After the skin, skeleton and lungs were registered, the low-contrast organs were mapped via TPS interpolation of the back-projected deformation. In this work, the single-subject atlas registration strategy is called single atlas.
Fig.12 illustrates the comparison of Dice coefficients and ASD (mean values and standard deviations) between these two methods and the proposed method, based on the 14 contrast-enhanced normal subjects. Statistical tests were performed to evaluate the significance of differences between each of the two methods with the proposed method. For the results with normal distributions, paired student’s t-tests were used, otherwise the nonparametric Wilcoxon signed rank tests were performed. The star sign indicates p value less than 0.001, and the plus sign indicates p value between [0.001, 0.05). For p≥0.05, the results are considered not significant thus no sign is used. It can be seen that the proposed method is significantly more accurate than the “no back-projection” method for most organs, in terms of both Dice coefficient and ASD. This result confirms the effectiveness the 2D-registration-back-projection strategy. However, the proposed method is not significantly better than “no back-projection” for the brain, mainly because of the inaccurate registration of the dorsal head part as revealed by Fig.9. For the spleen, the advantage of the proposed method over the “no back-projection” method is weak for both the Dice coefficient and the ASD. The spleen is difficult to register because it is a small organ with banana-like curved shape, and its position is flexible due to the influence of surrounding organs. Comparing the proposed method with the “single atlas” method, the proposed method is more accurate for most organs (judging from the mean values of Dice and ASD), but the differences are not significant. This is because the proposed method has an additional step of atlas smoothing (equation (3) and (4)), which greatly improves the plausibility of organ shapes but only slightly improves the registration accuracy. To illustrate such a point, an example of the three methods is shown in Fig.13, where the “single atlas” method demonstrates reasonably accurate registration but implausible deformations of the skull, the limbs, the sternum and the lungs. On the contrary, the “no back-projection” method presents plausible but less accurate result.
Fig 12.
Comparison results between the “no back-projection” method, the “single atlas” method and the proposed method, based on the 14 contrast-enhanced normal subjects. For each major organ, the mean values and standard deviations of the three methods are plotted. Statistical tests are performed evaluate the significance of differences between the proposed method and each of the “no back-projection” method and the “single atlas” method. The star sign indicates p value less than 0.001, and the plus sign indicates 0.001≤p<0.05. For p≥0.05, no sign is plotted because the results are considered as not significantly different.
Fig 13.
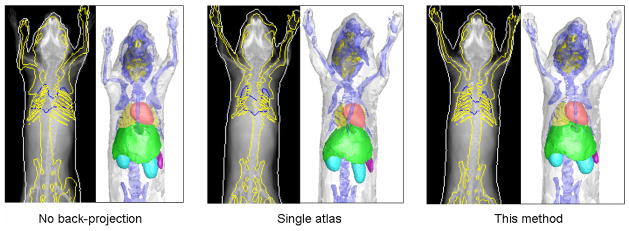
Visual comparison of the “no back-projection” method, the “single atlas” method and the proposed method. For each method, from the left to the right, the registered atlases are presented as the projection onto the X-ray images and the surface rendering, respectively.
Regarding convergence speed, the “no back-projection” method took 226±54 seconds, and the “single atlas” method took 114±36 seconds. The “no back-projection” method was programmed using IDL, with the atlas projection and Powell optimization steps programmed in C++; The “single atlas” method was programmed using IDL, with the atlas initialization step programmed in C++ and the 2D X-ray registration realized by calling the external elastix software.
4.5. Results of tumor-bearing subjects
The proposed method was tested using 17 subjects with shoulder tumor xenografts. Fig.14 demonstrates six representative results from these 17 subjects. For each subject in Fig.14, the left part shows the X-ray image (with a red arrow pointing out the tumor location), the middle and right parts show the registered SSMH overlaid on the X-ray and optical images, respectively. It can be seen that despite the presence of the tumor, the registration method still produces reasonable fitting of the organ outlines. Notably, the tumor outlines are not fitted because the atlas is trained from healthy subjects lacking this feature. For all the 17 test subjects, there is only one case demonstrating visually apparent misalignment, as shown by the lower right subject of Fig.14, whose head is inaccurately registered due to severe head twisting caused by the tumor.
Fig 14.
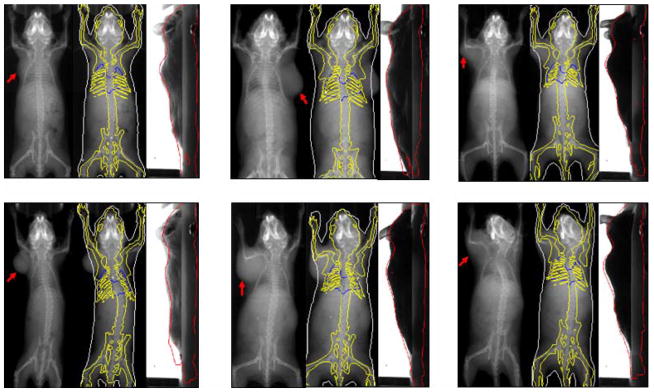
Representative registration results of tumor-bearing subjects. For each subject, the left part shows the X-ray projection image with a red arrow pointing out the tumor location, the middle and right parts show the registered SSMH overlaid on the X-ray and optical images, respectively. (For interpretation of the references to colors in this figure, the reader is referred to the web version of this article.)
To quantitatively validate the registration accuracy of the tumor-bearing subjects, the Dice coefficient and ASD were computed for the five contrast-enhanced tumor-bearing subjects. Table 1 reports the comparison of the Dice coefficient and ASD between the 14 normal subjects and the five tumor-bearing subjects. It is interesting to see that the tumor-bearing group has larger mean Dice coefficients and smaller mean ASDs than the normal group for most organs, except for the lungs and the spleen. However, it is not sufficient to conclude that the proposed method performs better on tumor-bearing group than on normal group, because the two groups are composed of different subjects. The tumor-bearing group has better registration accuracy mainly because the body weights of the tumor-bearing subjects (22~24g) match well with the majority of the atlas training subjects. Nevertheless, the comparison results at least confirm that the proposed method performs reasonably well on shoulder tumor subjects. Moreover, although the tumor-bearing group shows better accuracy for most organs, it shows slightly worse accuracy for the lungs and much worse accuracy for the spleen. Possible reasons for this are that the presence of shoulder tumor slightly impaired the local accuracy of the thorax registration, and the tumor bearing subjects always have severely enlarged spleen due to immune response.
Table 1.
Comparison of the organ registration accuracy between the normal subjects and tumor-bearing subjects. In each entry the mean value ± standard deviation is reported
| Body | Skeleton | Lungs | Brain | Heart | Liver | Spleen | L-Kidney | R-Kidney | ||
|---|---|---|---|---|---|---|---|---|---|---|
| Dice | Normal | 0.88±0.03 | 0.41±0.06 | 0.63±0.14 | 0.66±0.13 | 0.72±0.05 | 0.69±0.05 | 0.32±0.10 | 0.64±0.08 | 0.74±0.10 |
| Tumor | 0.89±0.04 | 0.43±0.05 | 0.62±0.07 | 0.73±0.09 | 0.77±0.14 | 0.71±0.07 | 0.20±0.18 | 0.69±0.12 | 0.75±0.09 | |
| ASD (mm) | Normal | 0.85±0.15 | 0.65±0.12 | 0.54±0.21 | 0.87±0.28 | 0.66±0.12 | 0.67±0.10 | 0.79±0.13 | 0.72±0.13 | 0.56±0.22 |
| Tumor | 0.74±0.13 | 0.58±0.07 | 0.56±0.09 | 0.64±0.14 | 0.53±0.31 | 0.66±0.12 | 1.01±0.26 | 0.60±0.20 | 0.52±0.19 |
5. Discussion and conclusions
Based on the normal test subjects, the registration method demonstrated the capability of capturing posture differences and anatomical variations. As shown in Fig.6(a) and (b), most posture differences in imaging chambers occur due to changing limb orientations and spine curvatures, which are successfully captured by the registration method. Moreover, the body size differences, as shown by Fig.6(c) and Fig.7(a), are also compensated. Note that when the body size changes from thin to fat, the organ anatomy does not undergo simple scaling. The main difference between thin and fat subjects is the amount of subcutaneous and visceral fat, while the size of internal organs remains relatively stable. Such thin-fat differences are captured by the proposed method, due to the use of the statistical mouse atlas. Fig.7(b) shows two subjects with different AP-view spine curve directions. The results show that when the spine curvature changes between left and right, the positions of the abdominal organs (especially the kidneys) don’t change dramatically. As a result, it appears in the X-ray images that the left-curved spine overlaps with the left kidney, and the right-curved spine overlaps with the right kidney. This finding coincides with the principle that the animal body is designed to minimize the influence of external motion onto internal organs. Fig.7(c) illustrates the difference between the stretched and curved bodies. It can be seen that the internal organs move accordingly with the body (seen from the lateral photo), implying that the conditional Gaussian model has the ability to follow the SSMH deformation.
For a quantitative evaluation, Fig.8 shows that most of the organs have a Dice coefficient over 0.5 and ASD less than 0.8mm. It is worth pointing out that the Dice coefficients in this study are comparable to the results in (Baiker et al., 2010) which registers single-subject atlas with full tomographic micro-CT images. This achievement is due to the use of the statistical mouse atlas, which uses prior anatomical knowledge to compensate for missing information of non-tomographic projections. From Fig.8, it can also be observed that the registration accuracy is organ-dependent. The accuracy of a specific organ is a combined effect of the organ size, shape, contrast and position. Larger organs (e.g. the whole body and the liver) tend to have higher Dice coefficients because larger targets are easier to hit. Sphere-shaped organs (e.g. the heart and the kidneys) have higher Dice coefficients than curve-shaped organs (e.g. the skeleton and the spleen), because a spherical shape is easier to get overlapped than a curved shape. However, a high Dice coefficient doesn’t necessarily mean low ASD, such as the highest Dice organ (the whole body) doesn’t have the lowest ASD, and the lowest ASD organ (the lungs) doesn’t have the highest Dice. A major factor that affects the ASD value is the organ contrast. High contrast organs present clearer edges in the X-ray and optical images, thus they have more accurate surface fitting. It can also be observed that the high contrast organs (the skin/whole body, skeleton and lungs) have more compact distributions of both Dice coefficient and ASD, because these organs are deterministically registered with SSMH, while the low contrast organs are probabilistically estimated using the CGM. Moreover, if an organ is close to a good-accuracy neighbor, it also tends to have good accuracy. For example, the heart and the liver are close to the lungs, thus they have relatively larger Dice coefficient and lower ASD. Similarly, the right kidney has larger Dice coefficient and lower ASD than the left kidney, because the right kidney is close to the liver, while the left kidney is close to the spleen.
For the comparison with other registration methods, Fig.12 and Fig.13 show that the 2D-registration-back-projection strategy is significantly more accurate than the direct 3D optimization strategy. This is because the former is a bottom-up strategy which finds the 2D edge correspondences first and then back-projects them into 3D, while the latter is a top-down strategy which guesses the 3D correspondence first and then projects it into 2D. It is clear that the bottom-up approach is more effective, because the edge correspondences are easier to be found in 2D. Moreover, the direct 3D optimization strategy takes hundreds of iterations while the 2D- registration-back-projection strategy takes 6.4 iterations on average, therefore the 2D-registration-back-projection also converges faster than the direct 3D optimization. On the other hand, although the 2D-registration-back-projection is more effective, it is susceptible to the errors of 2D registration, making the back-projected deformation discontinuous and unrealistic, as shown by the results of single-atlas registration (Fig. 13). Thanks to the use of the statistical mouse atlas, the back-projected deformation is regulated within the plausible deformation space, and realistic organ shapes are preserved. It should be mentioned that other authors also developed 2D/3D registration methods based on single-subject mouse atlas, and they used different strategies to regulate the unrealistic deformations, such as using elastic energy minimization (Joshi et al., 2010a) or simplifying the TPS-interpolation with a small number of landmarks (Baiker et al., 2009). However, none of these methods are based on the organ deformation model that is learned from the training population.
It is worth noting that in the clinical field, there are also some methods that combine similar 2D-matching-back-projection strategies with statistical atlases for 2D/3D registration of human bones (Baka et al., 2011; Zheng et al., 2009). The difference is that the clinical methods mostly perform edge point searching for the X-ray images, while we use intensity-based registration, because the mouse body presents noisier edges than human bones. The mouse body includes multiple soft organs which produce faint edges in the X-ray image, and even bony structures produce rugged edges because of the complex 3D shapes (like for the skull and the spine). As a result, we find mutual information-based image registration more reliable than edge point searching. Furthermore, unlike clinical studies which only focus on high X-ray contrast organs, our application involves both high and low X-ray contrast organs. The use of CGM facilitates the estimation low contrast organs based on high contrast organs. From Fig.11, it can be seen that when the accuracy of high contrast organs improves along with the registration steps, the accuracy of low contrast organs also improves, implying that the accuracy of low contrast organs depends on the high contrast organs.
For the tumor-bearing subjects, Fig.14 shows that this method produces healthy body shapes as if there is no tumor. This finding allows us to entertain the possibility of tumor detection from X-ray images, i.e. by subtracting the registered body region from the subject body region, and the leftover pixels could become tumor candidates. While tumor detection is out of the scope of this work, this could become an interesting topic of future research. Based on table 1, it can be seen that the implant of a shoulder tumor negatively affected the registration accuracy of the lungs and the spleen, because the presence of the tumor distorted the 2D registration of the thorax, while the tumor also stimulated an immune response leading to abnormally large spleen. Moreover, in this study, we only tested with shoulder xenografts, but didn’t test with visceral or other orthotopic tumors. This is because our data sources come from ongoing preclinical research at our institute where shoulder xenografts are more popular. Overall, we consider this tumor-bearing test as preliminary. In the future, it might be necessary to conduct more comprehensive tumor subject tests which involve animal growing, tumor implanting and subject selection. We may also need to construct a specialized atlas for tumor-bearing anatomy (e.g. enlarged spleen), and use finite element modeling to simulate the tissue distortion caused by shoulder or visceral tumors.
In this paper, the shapes of the body skin and skeleton are modeled via linear point distribution models. However, the articulated motions of the limbs and spine are nonlinear. The proposed method is only effective for subject postures constrained in specialized animal chambers, because the training set covers most common postures inside the chambers like those used in this work. It is unclear how well the registration method performs without such chambers, or with other types of animal holding devices (e.g. test tubes), but it is obvious that this method cannot capture free animal motions. For future study, to broaden the capture range of animal posture, we will consider adding articulated motion into the atlas skeleton, and solve the problem of moving the skin along with the skeleton. The studies of (Gilles et al., 2010; Khmelinskii et al., 2011a; Savinaud et al., 2010) have explored similar problems, and the exiting human and animal animation techniques (Brett et al., 2003; Robert and Jovan, 2004) are also candidate solutions, but to adapt these approaches for 2D/3D registration is still challenging. There are also approaches that cluster the training subjects into sub-groups, and construct linear point distribution models for each sub-group. Since the nonlinearity of each sub-group is much reduced compared to the whole training set, this strategy works reasonably well for articulated motions while maintains the efficiency of linear model. Sub-grouping of the training set can be achieved with either fuzzy k-means (Bowden, 1999) or manifold learning (Kadoury and Paragios, 2010) methods. However, the prerequisite of the sub-grouping strategy is a large enough training size which covers most possible postures. Apparently the 83 training subjects of this paper is not sufficient to cover all free postures, but increasing the straining size will lead to nontrivial time and expense costs.
To describe the inter-subject deformations of multiple organs in the atlas, we constructed the SSMs by treating multiple organs as a single object. This strategy effectively avoids the intersection of nearby organs, but potentially limits the deformation ability of each single organ. In future studies, we may implement other existing multi-organ SSM approaches (Cerrolaza et al., 2012; Gorczowski et al., 2007; Okada et al., 2008; Zhang et al., 2011). The principal nested sphere method (Jung et al., 2010) could also be an alternative of the PCA to give better modeling of the organ deformations. Last but not least, we also ought to consider building different atlases for different weights, strains, and sex, to see if more dedicated atlases can future improve the registration accuracy.
Overall, in this paper, a 2D/3D mouse atlas registration method is presented for preclinical mouse studies. The registration is based on AP-view X-ray projection and lateral-view optical photo. The combined use of the 2D-registration-back-projection strategy and the statistical mouse atlas yield promising registration results for both normal subjects and shoulder tumor-bearing subjects. This method could compensate for moderate posture changes and inter-subject anatomical variations, and it registers both high and low X-ray contrast organs by combining the statistical shape model with the conditional Gaussian model. Using two projection views is a low cost, low radiation dose option and our automated processing means this method is suitable for routine use with everyday imaging study. Future study will focus on improving the atlas construction method and conducting more comprehensive tumor-bearing subject tests.
Supplementary Material
Research highlights.
Registration of a statistical mouse atlas with an X-ray projection and a lateral optical photo.
A statistical mouse atlas for posture and anatomical variations.
A 2D-registration-back-projection strategy for efficient and accurate atlas deformation.
Compares favorably to two existing methods, and is robust even with the presence of shoulder tumor.
Acknowledgments
The authors would like to thank Dr. Anna Wu, Dr. Owen Witte, Dr. Scott Knowles, Dr. Richard Tavare and Melissa McCracken from UCLA for sharing the tumor-bearing mouse models, Dr. Boudewijn P.F. Lelieveldt for providing the online resource of the articulated mouse atlas, Dr. Stefan Klein and Dr. Marius Staring for providing the elastix registration toolbox, and Dr. Bing Jian for providing codes of point set Registration using mixture of Gaussians. We appreciate Waldemar Ladno and Darin Williams for help with animal experiments, and John David DVM for the professional help on animal knowledge and manuscript preparation. We also appreciate the efforts of the anonymous reviewers who helped us to improve the paper quality. This work was supported in part by SAIRP NIH-NCI 2U24 CA092865 and in part by a UCLA Chancellor’s Bioscience Core grant.
Footnotes
Publisher's Disclaimer: This is a PDF file of an unedited manuscript that has been accepted for publication. As a service to our customers we are providing this early version of the manuscript. The manuscript will undergo copyediting, typesetting, and review of the resulting proof before it is published in its final citable form. Please note that during the production process errors may be discovered which could affect the content, and all legal disclaimers that apply to the journal pertain.
References
- Baiker M, Milles J, Dijkstra J, Henning TD, Weber AW, Que I, Kaijzel EL, Lowik CW, Reiber JH, Lelieveldt BP. Atlas-based whole-body segmentation of mice from low-contrast Micro-CT data. Med Image Anal. 2010;14:723–737. doi: 10.1016/j.media.2010.04.008. [DOI] [PubMed] [Google Scholar]
- Baiker M, Staring M, Löwik CWGM, Reiber JHC, Lelieveldt BF. Medical Image Computing and Computer-Assisted Intervention-MICCAI 2011. 2011. Automated Registration of Whole-Body Follow-Up MicroCT Data of Mice; pp. 516–523. [DOI] [PubMed] [Google Scholar]
- Baiker M, Vastenhouw B, Branderhorst W, Reiber JHC, Beekman F, Lelieveldt BPF. Atlas-driven scan planning for high-resolution micro-SPECT data acquisition based on multi-view photographs: a pilot study. In: Miga MI, Wong KH, editors. SPIE Medical Imaging 2009: Visualization, Image-Guided Procedures, and Modeling. 1. SPIE; Lake Buena Vista, FL, USA: 2009. pp. 72611L72611–72611L72618. [Google Scholar]
- Baka N, Kaptein BL, de Bruijne M, van Walsum T, Giphart JE, Niessen WJ, Lelieveldt BP. 2D-3D shape reconstruction of the distal femur from stereo X-ray imaging using statistical shape models. Med Image Anal. 2011;15:840–850. doi: 10.1016/j.media.2011.04.001. [DOI] [PubMed] [Google Scholar]
- Benameur S, Mignotte M, Parent S, Labelle H, Skalli W, de Guise J. 3D/2D registration and segmentation of scoliotic vertebrae using statistical models. Comput Med Imaging Graph. 2003;27:321–337. doi: 10.1016/s0895-6111(03)00019-3. [DOI] [PubMed] [Google Scholar]
- Bing J, Vemuri BC. A robust algorithm for point set registration using mixture of Gaussians. IEEE International Conference on Computer Vision (ICCV 2005); 2005. pp. 1246–1251. [DOI] [PMC free article] [PubMed] [Google Scholar]
- Bookstein FL. Landmark methods for forms without landmarks: localizing group differences in outline shape, Mathematical Methods in Biomedical Image Analysis. MMBIA 19Journal of Educational PsychologyJournal of Educational Psychology96. 1996:279–2890. [Google Scholar]
- Bowden R. Learning non-linear Models of Shape and Motion, Dept Systems Engineering. Brunel University; Uxbridge, Middlesex, UK: 1999. [Google Scholar]
- Brett A, Brian C, Zoran P. The space of human body shapes: reconstruction and parameterization from range scans. ACM Trans Graph. 2003;22:587–594. [Google Scholar]
- Cerrolaza JJ, Villanueva A, Cabeza R. Hierarchical statistical shape models of multiobject anatomical structures: application to brain MRI. IEEE Trans Med Imag. 2012;31:713–724. doi: 10.1109/TMI.2011.2175940. [DOI] [PubMed] [Google Scholar]
- Cheng-Liao J, Qi J. Segmentation of mouse dynamic PET images using a multiphase level set method. Phys Med Biol. 2010;55:6549–6569. doi: 10.1088/0031-9155/55/21/014. [DOI] [PMC free article] [PubMed] [Google Scholar]
- Chow PL, Stout DB, Komisopoulou E, Chatziioannou AF. A method of image registration for small animal, multi-modality imaging. Phys Med Biol. 2006;51:379–390. doi: 10.1088/0031-9155/51/2/013. [DOI] [PMC free article] [PubMed] [Google Scholar]
- Dogdas B, Stout D, Chatziioannou AF, Leahy RM. Digimouse: a 3D whole body mouse atlas from CT and cryosection data. Phys Med Biol. 2007;52:577–587. doi: 10.1088/0031-9155/52/3/003. [DOI] [PMC free article] [PubMed] [Google Scholar]
- Dworzak J, Lamecker H, von Berg J, Klinder T, Lorenz C, Kainmuller D, Seim H, Hege HC, Zachow S. 3D reconstruction of the human rib cage from 2D projection images using a statistical shape model. Int J Comput Assist Radiol Surg. 2010;5:111–124. doi: 10.1007/s11548-009-0390-2. [DOI] [PubMed] [Google Scholar]
- Ericson C. In: Real-time collision detection. Cox T, editor. Morgan Kafmann Publishers; San Francisco: 2005. pp. 146–147. [Google Scholar]
- Fleute M, Lavallée S, Taylor C, Colchester A. Nonrigid 3-D/2-D Registration of Images Using Statistical Models Medical Image Computing and Computer-Assisted Intervention – MICCAI’99. Springer; Berlin / Heidelberg: 1999. pp. 138–147. [Google Scholar]
- Gilles B, Revéret L, Pai DK. Creating and Animating Subject-Specific Anatomical Models. Computer Graphics Forum. 2010;29:2340–2351. [Google Scholar]
- Gorczowski K, Styner M, Ja-Yeon J, Marron JS, Piven J, Hazlett HC, Pizer SM, Gerig G. Statistical Shape Analysis of Multi-Object Complexes, Computer Vision and Pattern Recognition, 2007. CVPR '07. IEEE Conference on; 2007. pp. 1–8. [Google Scholar]
- Groher M, Zikic D, Navab N. Deformable 2D-3D registration of vascular structures in a one view scenario. IEEE Trans Med Imag. 2009;28:847–860. doi: 10.1109/TMI.2008.2011519. [DOI] [PubMed] [Google Scholar]
- Hans L, Thomas HW, Hans-Christian H. Atlas-based 3D-Shape Reconstruction from X-Ray Images. Proceedings of the 18th International Conference on Pattern Recognition; IEEE Computer Society. 2006. [Google Scholar]
- Heimann T, Meinzer HP. Statistical shape models for 3D medical image segmentation: A review. Med Image Anal. 2009;13:543–563. doi: 10.1016/j.media.2009.05.004. [DOI] [PubMed] [Google Scholar]
- Johnson GA, Cofer GP, Gewalt SL, Hedlund LW. Morphologic Phenotyping with MR Microscopy: The Visible Mouse. Radiology. 2002;222:789. doi: 10.1148/radiol.2223010531. [DOI] [PubMed] [Google Scholar]
- Joshi AA, Chaudhari AJ, Li C, Dutta J, Cherry SR, Shattuck DW, Toga AW, Leahy RM. DigiWarp: a method for deformable mouse atlas warping to surface topographic data. Phys Med Biol. 2010a;55:6197–6214. doi: 10.1088/0031-9155/55/20/011. [DOI] [PMC free article] [PubMed] [Google Scholar]
- Joshi AA, Chaudhari AJ, Li C, Dutta J, Cherry SR, Shattuck DW, Toga AW, Leahy RM. DigiWarp: a method for deformable mouse atlas warping to surface topographic data. Phys Med Biol. 2010b;55:6197–6214. doi: 10.1088/0031-9155/55/20/011. [DOI] [PMC free article] [PubMed] [Google Scholar]
- Jung S, Liu X, Marron J, Pizer S, Angeles J, Boulet B, Clark J, Kövecses J, Siddiqi K. Generalized PCA via the Backward Stepwise Approach in Image Analysis Brain, Body and Machine. Springer; Berlin / Heidelberg: 2010. pp. 111–123. [Google Scholar]
- Kadoury S, Paragios N. Nonlinear embedding towards articulated spine shape inference using higher-order MRFs. Medical Image Computing and Computer-Assisted Intervention-MICCAI. 2010;2010:579–586. doi: 10.1007/978-3-642-15711-0_72. [DOI] [PubMed] [Google Scholar]
- Kesner AL, Dahlbom M, Huang SC, Hsueh WA, Pio BS, Czernin J, Kreissl M, Wu HM, Silverman DHS. Semiautomated analysis of small-animal PET data. J Nucl Med. 2006;47:1181–1186. [PubMed] [Google Scholar]
- Khmelinskii A, Baiker M, Chen XJ, Reiber J, Henkelman RM, Lelieveldt B. Atlas-based organ & bone approximation for ex-vivo MRI mouse data: A pilot study. 7th IEEE Int. Symp. on Biomedical Imaging: From Nano to Macro. IEEE; Rotterdam, the Netherlands. 2010. pp. 1197–1200. [Google Scholar]
- Khmelinskii A, Baiker M, Kaijzel EL, Chen J, Reiber JH, Lelieveldt BP. Articulated whole-body atlases for small animal image analysis: construction and applications. Mol Imag Biol. 2011a;13:898–910. doi: 10.1007/s11307-010-0386-x. [DOI] [PMC free article] [PubMed] [Google Scholar]
- Khmelinskii A, Baiker M, Kok P, de Swart J, Reiber JHC, de Jong M, Lelieveldt BPF. Atlas-based articulated skeleton segmentation of SPECT mouse data. 8th IEEE Int. Symp. Biomed. Imag.: From Nano to Macro. IEEE; Chicago, IL., US. 2011b. pp. 437–440. [Google Scholar]
- Klein S, Staring M, Murphy K, Viergever MA, Pluim JP. elastix: a toolbox for intensity-based medical image registration. IEEE Trans Med Imag. 2010;29:196–205. doi: 10.1109/TMI.2009.2035616. [DOI] [PubMed] [Google Scholar]
- Li C, Mitchell GS, Dutta J, Ahn S, Leahy RM, Cherry SR. A three-dimensional multispectral fluorescence optical tomography imaging system for small animals based on a conical mirror design. Opt Exp. 2009;17:7571–7585. doi: 10.1364/oe.17.007571. [DOI] [PMC free article] [PubMed] [Google Scholar]
- Markelj P, Tomazevic D, Likar B, Pernus F. A review of 3D/2D registration methods for image-guided interventions. Med Image Anal. 2012;16:642–661. doi: 10.1016/j.media.2010.03.005. [DOI] [PubMed] [Google Scholar]
- Maroy R, Boisgard R, Comtat C, Frouin V, Cathier P, Duchesnay E, Dolle F, Nielsen PE, Trebossen R, Tavitian B. Segmentation of Rodent Whole-Body Dynamic PET Images: An Unsupervised Method Based on Voxel Dynamics. Medical Imaging, IEEE Transactions on. 2008;27:342–354. doi: 10.1109/TMI.2007.905106. [DOI] [PubMed] [Google Scholar]
- Maroy R, Boisgard R, Comtat C, Jego B, Fontyn Y, Jan S, Dubois A, Trebossen R, Tavitian B. Quantitative organ time activity curve extraction from rodent PET images without anatomical prior. Med Phys. 2010;37:1507–1517. doi: 10.1118/1.3327454. [DOI] [PubMed] [Google Scholar]
- Okada T, Yokota K, Hori M, Nakamoto M, Nakamura H, Sato Y. Construction of hierarchical multi-organ statistical atlases and their application to multi-organ segmentation from CT Images. In: Metaxas D, Axel L, Fichtinger G, Székely G, editors. Medical Image Computing and Computer-Assisted Intervention (MICCAI 2008) Springer; Berlin / Heidelberg: 2008. pp. 502–509. [DOI] [PubMed] [Google Scholar]
- Powell MJD. An efficient method for finding the minimum of a function of several variables without calculating derivatives. The Computer Journal. 1964;7:155–162. [Google Scholar]
- Robert WS, Jovan P. Deformation transfer for triangle meshes. ACM Trans Graph. 2004;23:399–405. [Google Scholar]
- Sadowsky O, Lee J, Sutter EG, Wall SJ, Prince JL, Taylor RH. Hybrid cone-beam tomographic reconstruction: incorporation of prior anatomical models to compensate for missing data. IEEE Trans Med Imag. 2011;30:69–83. doi: 10.1109/TMI.2010.2060491. [DOI] [PMC free article] [PubMed] [Google Scholar]
- Savinaud M, de La Gorce M, Maitrejean S, Paragios N. Model-based multi-view fusion of cinematic flow and optical imaging. Med Image Comput Comput Assist Interv. 2010;13:668–675. doi: 10.1007/978-3-642-15745-5_82. [DOI] [PubMed] [Google Scholar]
- Segars WP, Tsui BMW, Frey EC, Johnson GA, Berr SS. Development of a 4-D digital mouse phantom for molecular imaging research. Mol Imag Biol. 2004;6:149–159. doi: 10.1016/j.mibio.2004.03.002. [DOI] [PubMed] [Google Scholar]
- Song X, Wang D, Chen N, Bai J, Wang H. Reconstruction for free-space fluorescence tomography using a novel hybrid adaptive finite element algorithm. Optics Express. 2007;15:18300–18317. doi: 10.1364/oe.15.018300. [DOI] [PubMed] [Google Scholar]
- Stout D, Chatziioannou A, Lawson T, Silverman R, Gambhir S, Phelps M. Small animal imaging center design: the facility at the UCLA Crump Institute for Molecular Imaging. Mol Imag Biol. 2005;7:393–402. doi: 10.1007/s11307-005-0015-2. [DOI] [PMC free article] [PubMed] [Google Scholar]
- Suckow C, Kuntner C, Chow P, Silverman R, Chatziioannou A, Stout D. Multimodality rodent imaging chambers for use under barrier conditions with gas anesthesia. Mol Imag Biol. 2009;11:100–106. doi: 10.1007/s11307-008-0165-0. [DOI] [PMC free article] [PubMed] [Google Scholar]
- Thevenaz P, Unser M. Optimization of mutual information for multiresolution image registration. IEEE Trans Image Process. 2000;9:2083–2099. doi: 10.1109/83.887976. [DOI] [PubMed] [Google Scholar]
- Velasco FRD. Thresholding using the ISODATA clustering algorithm. IEEE Trans Syst Man Cybern. 1980;10:771–774. [Google Scholar]
- Wang H, Stout D, Chatziioannou A. Mouse Atlas Registration with Non-tomographic Imaging Modalities—a Pilot Study Based on Simulation. Mol Imag Biol. 2011;14:408–419. doi: 10.1007/s11307-011-0519-x. [DOI] [PMC free article] [PubMed] [Google Scholar]
- Wang H, Stout DB, Chatziioannou AF. Estimation of mouse organ locations through registration of a statistical mouse atlas with micro-CT images. IEEE Trans Med Imag. 2012a;31:88–102. doi: 10.1109/TMI.2011.2165294. [DOI] [PMC free article] [PubMed] [Google Scholar]
- Wang H, Stout DB, Taschereau R, Gu Z, Vu NT, Prout DL, Chatziioannou AF. MARS: a mouse atlas registration system based on planar x-ray projector and optical camera. Phys Med Biol. 2012b;57:6063–6077. doi: 10.1088/0031-9155/57/19/6063. [DOI] [PMC free article] [PubMed] [Google Scholar]
- Wells WM, 3rd, Viola P, Atsumi H, Nakajima S, Kikinis R. Multi-modal volume registration by maximization of mutual information. Med Image Anal. 1996;1:35–51. doi: 10.1016/s1361-8415(01)80004-9. [DOI] [PubMed] [Google Scholar]
- Wildeman MH, Baiker M, Reiber JHC, Lowik CWGM, Reinders MJT, Lelieveldt BPF. 2D/3D registration of micro-CT data to multi-view photographs based on a 3D distance map. 6th IEEE Int. Symp. Biomed. Imag.: From Nano to Macro; Boston, MA., USA. 2009. pp. 987–990. [Google Scholar]
- Xia Z, Huang XS, Zhou XB, Sun YX, Ntziachristos V, Wong STC. Registration of 3-D CT and 2-D flat images of mouse via affine transformation. IEEE Trans Inf Technol Biomed. 2008;12:569–578. doi: 10.1109/TITB.2007.904631. [DOI] [PubMed] [Google Scholar]
- Yao J, Taylor R. Assessing accuracy factors in deformable 2D/3D medical image registration using a statistical pelvis model, Computer Vision, 2003. Proceedings. Ninth IEEE International Conference on; 2003. pp. 1329–1334. [Google Scholar]
- Zhang S, Huang J, Mustafa U, Shen T, Foteini D, Huang X, Nora V, Panayotis T, Dimitris NM. 3d segmentation of rodent brain structures using hierarchical shape priors and deformable models. Proceedings of the 14th international conference on Medical image computing and computer-assisted intervention - Volume Part III; Springer-Verlag, Toronto, Canada. 2011. [DOI] [PMC free article] [PubMed] [Google Scholar]
- Zhang X, Badea CT, Johnson GA. Three-dimensional reconstruction in free-space whole-body fluorescence tomography of mice using optically reconstructed surface and atlas anatomy. J Biomed Opt. 2009;14:064010. doi: 10.1117/1.3258836. [DOI] [PMC free article] [PubMed] [Google Scholar]
- Zheng G, Gollmer S, Schumann S, Dong X, Feilkas T, Gonzalez Ballester MA. A 2D/3D correspondence building method for reconstruction of a patient-specific 3D bone surface model using point distribution models and calibrated X-ray images. Med Image Anal. 2009;13:883–899. doi: 10.1016/j.media.2008.12.003. [DOI] [PubMed] [Google Scholar]
- Zheng X, Tian G, Huang SC, Feng D. A hybrid clustering method for ROI delineation in small-animal dynamic PET images: application to the automatic estimation of FDG input functions. IEEE Trans Inf Technol Biomed. 2011;15:195–205. doi: 10.1109/TITB.2010.2087343. [DOI] [PMC free article] [PubMed] [Google Scholar]
- Zijdenbos AP, Dawant BM, Margolin RA, Palmer AC. Morphometric analysis of white matter lesions in MR images: method and validation. IEEE Trans Med Imag. 1994;13:716–724. doi: 10.1109/42.363096. [DOI] [PubMed] [Google Scholar]
Associated Data
This section collects any data citations, data availability statements, or supplementary materials included in this article.


