Abstract
Context
Fusions of androgen-regulated genes and v-ets erythroblastosis virus E26 oncogene homolog (avian) (ERG) occur in ~50% of prostate cancers, encoding a truncated ERG product. In prostatectomy specimens, ERG-rearrangements are >99% specific for prostate cancer or high grade prostatic intraepithelial neoplasia (HGPIN) adjacent to ERG-rearranged prostate cancer by fluorescence in situ hybridization (FISH) and immunohistochemistry (IHC).
Objective
To evaluate ERG staining by IHC on needle biopsies, including diagnostically challenging cases.
Design
Biopsies from a retrospective cohort (n=111) enriched in cores requiring diagnostic IHC and a prospective cohort from all cases over 3 months (n=311) were stained with an anti-ERG antibody (clone EPR3864).
Results
Amongst evaluable cores (n=418), ERG staining was confined to cancerous epithelium (71/160 cores, 44%), HGPIN (12/68 cores, 18%) and atypical foci (3/28 cores, 11%), with staining in only 2/162 (1%) cores diagnosed as benign. ERG was expressed in ~5 morphologically benign glands across 418 cores, and was uniformly expressed by all cancerous glands in 70/71 cores.
Conclusions
ERG staining is more prostate cancer-specific than alpha-methylacyl-CoA racemase (AMACR), and staining in an atypical focus supports a diagnosis of cancer if HGPIN can be excluded. Thus, ERG staining shows utility in diagnostically challenging biopsies and may be useful in molecularly subtyping prostate cancer and risk stratifying isolated HGPIN.
Introduction
Although the diagnosis of prostate carcinoma (PCa) on needle biopsy cores can typically be made on morphology using standard hematoxylin and eosin (H&E) staining, atypical foci, particularly those that are small, can pose diagnostic difficulty with discordant diagnoses amongst even expert pathologists1. Hence, immunohistochemistry (IHC), most commonly with basal cell markers (p63 and high molecular weight cytokeratin [HMWCK]) and alpha-methylacyl-CoA racemase (AMACR), is performed to render a diagnosis or support morphologic impressions. Unfortunately, lack of basal cell markers and positive AMACR staining can occur in small foci of benign mimickers of PCa, including adenosis (atypical adenomatous hyperplasia) and partial atrophy, and AMACR is positive in only ~80% of limited PCa foci on needle biopsy2. AMACR also stains almost all high grade prostatic intraepithelial neoplasia (HGPIN)2-4, the presumed precursor lesion of PCa, limiting its utility for molecular risk stratification of HGPIN. Hence, robust immunohistochemical markers of PCa may have utility in diagnosis, molecular subtyping and risk stratification.
In 2005, chromosomal rearrangements were identified in prostate cancer that fuse the 5′ untranslated region of the androgen-regulated gene transmembrane protease, serine 2 (TMPRSS2) with v-ets erythroblastosis virus E26 oncogene homolog (avian) (ERG) or ets variant 1 (ETV1), two members of the ETS transcription factor family5. Subsequent studies confirmed ETS gene fusions in approximately 50% of PSA-screened prostate cancers6,7. Fusions between TMPRSS2 (or more rarely solute carrier family 45, member 3 [SLC45A3] or NDRG18, 9) and ERG represent approximately 90% of all ETS gene fusions, and result in marked over-expression of the fusion transcript7. Importantly, rearrangements of ERG at the chromosomal level (by fluorescence in situ hybridization [FISH]) are essentially 100% specific for the presence of prostate cancer or HGPIN immediately adjacent to cancer in tissue studies7,10,11. ERG rearrangements appear highly clonal, as when present, nearly all cells in a given cancer focus are positive, although distinct cancer foci in a single prostate may have discordant ERG rearrangement status12-15. Multiple studies have also demonstrated that ERG rearrangements are detectable in approximately 15% of HGPIN lesions, invariably adjacent to ERG rearranged PCa 16-18. In vitro and in vivo studies have also demonstrated a functional role for ERG gene fusions in prostate cancer oncogenesis7,17,19,20, and ERG rearrangement positive and negative tumors have distinct molecular profiles21,22. Taken together, ERG gene fusions are the most prostate cancer-specific biomarker yet identified and likely define a specific molecular subtype of prostate cancer.
Multiple groups have characterized ERG staining in prostatectomy specimens by IHC using monoclonal antibodies against ERG. Using tissue microarrays containing 207 cores of PCa from prostatectomy specimens, Park et al. demonstrated strong ERG staining using a monoclonal antibody against ERG (anti-C terminus, clone EPR3864, Epitomics) in 92 cores (44%), with overall 95.7% sensitivity and 96.5% specificity compared to FISH for ERG rearrangements; no benign glands showed ERG staining11. Similarly, Furstato et al., using a different anti-ERG monoclonal antibody on whole mount prostatectomy specimens, demonstrated diffuse ERG staining in 117 of 261 (45%) cancer foci, but only 22 of an estimated 200,000 benign glands10. Importantly, they also demonstrate that 82 of 85 (96.5%) evaluable specimens with ERG expressing tumor foci contained ERG expressing HGPIN lesions, with all ERG positive PIN foci adjacent to ERG positive tumors.
More recently, studies have begun to address the utility of ERG staining in needle biopsies. For example, van Leenders et al. evaluated the EPR3864 antibody on a consecutive series of needle biopsies containing PCa, with 51 of 83 (61%) cores demonstrating ERG staining in cancerous foci glands23. ERG staining was present in 11 of 21 (52%) foci of HGPIN, invariably adjacent to ERG positive PCa (in the 10 of 11 foci with residual PCa in the core). Similarly, He et al. evaluated EPR3864 anti-ERG staining in 103 needle biopsy cores with a diagnosis of “atypical glands suspicious for cancer” and found that 16 (15.5%) expressed ERG24. Finally, Yaskiv et al. evaluated dual staining with p63 and EPR3864 on 77 needle biopsies containing limited PCa (<1mm involvement of only 1 core of the entire biopsy set) and observed ERG staining in 32 of 77 (42%) foci of PCa25.
Together, these results support the cancer specificity of ERG rearrangements, support ERG staining by IHC as a surrogate for ERG rearrangement status, and suggest diagnostic utility. However, ERG staining in the full spectrum of lesions encountered on routine diagnostic needle biopsies has not been evaluated; nor has ERG staining been evaluated in a prospective series. Here, we evaluate the performance of ERG by IHC in 422 diagnostic needle biopsies, including challenging cases.
Materials and Methods
Cohort
Uunstained levels from prostate needle core biopsies were selected from men undergoing biopsy at a single academic institution from April 2008 through January 2011, and consisted of two cohorts. Cores were obtained with Institutional Review Board approval. All diagnoses were made prior to evaluation of ERG.
The first cohort of 111 cores was identified retrospectively, with cores selected from biopsies from April 2008 to September 2010 and January 2011, and was enriched for cores requiring IHC for diagnosis (using the basal cell markers p63 and high molecular weight cytokeratin [HMWCK, clone 34βE12], and AMACR as a triple cocktail, n=66) and cores with minute cancer foci (30 of 61 cores with cancer).
A second prospective cohort of 311 cores was obtained by collecting levels from all cases at the time of diagnosis from September to December 2010. In cases with benign diagnoses, cores were randomly selected from both sides of the prostate. In cases with PCa, a core from each involved side was selected, generally representing the highest Gleason score (in cases with Gleason score >6) or smallest % core involvement (in cases with Gleason score = 6). All cores with a diagnosis of HGPIN or atypia (including atypical small acinar proliferation [ASAP] and HGPIN with adjacent atypical glands [PINATYP]) were selected. Finally, all cores requiring IHC for diagnosis was selected. In some cases, unstained levels were not available for all selected cores (tissue exhausted, used for additional H&E staining, etc.) or were not obtained.
ERG Immunohistochemistry (IHC)
IHC on unstained formalin fixed, paraffin-embedded levels was performed using a monoclonal antibody against ERG, clone EPR 3864 (Epitomics, Burlingame, CA), using the automated Discovery XT staining platform (Ventana Medical Systems, Tucson, AZ) as described11. ERG staining was evaluated by the study pathologists. Staining of vessels was used as a positive control and slides without staining of vessels were excluded from further analysis. ERG staining in prostatic glands was either absent or diffusely strong (2-3+), unless otherwise indicated, and was reported as present/absent.
Results
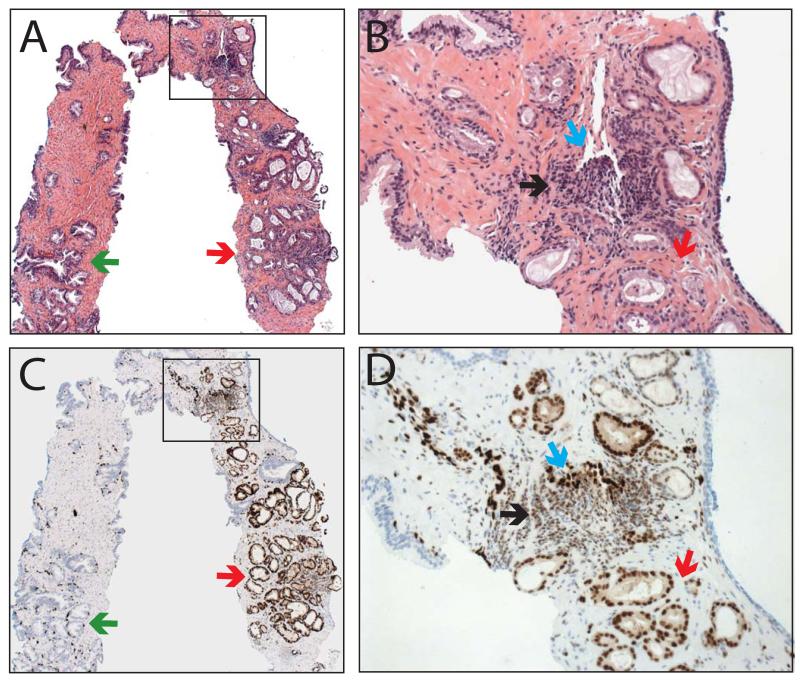
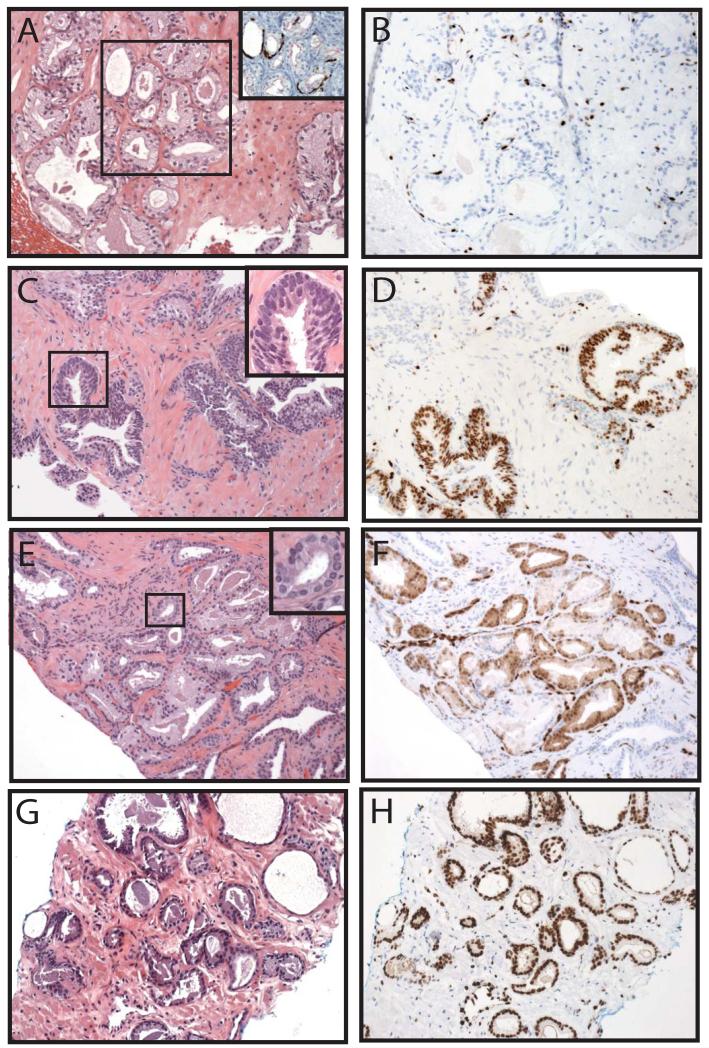
Of the 422 total cores stained for ERG, tissue was lost on one core, the atypical focus on one core was not present (remaining benign glands showed no ERG staining) and staining failed on two cores, leaving 418 (99%) cores for analysis. Demographics from both the retrospective and prospective cohorts, which differed primarily by the inclusion of more benign cores in the prospective cohort, are shown in Table 1, and results for both cohorts are summarized below. As ERG (wild-type) is expressed in endothelial cells, where it has a known biological role26, staining in vessels was used as an endogenous positive control, and in all evaluable cores, strong nuclear staining was present in all endothelial cells. Consistent with previous results on prostatectomy sections, ERG was also expressed in a subset of lymphocytes11, which may be due to cross-reactivity of the antibody with Friend leukemia virus integration 1 (FLI1), a similar ETS family protein expressed in both endothelial cells and lymphocytes, as shown by Furstato et al10. In our experience, staining in vessels and a subset of lymphocytes does not result in difficulty interpreting ERG staining in benign or cancerous glands;Figure 1 shows a representative H&E (A&B) and ERG stained (&D) core with benign prostatic glands, lymphocytes, vessels and prostate cancer. ERG expression across representative cores with benign glands (Figure 2A&B), HGPIN (C&D), atypical foci (E&F) and prostate cancer (G&H) are also shown.
Table 1. Clinicopathological data for patients with prostate biopsy cores evaluable for v-ets erythroblastosis virus E26 oncogene homolog (avian) (ERG) staining (total n=418).
| Parameter | (n) | Retrospective (n=111 cores; 86 cases) |
(n) | Prospective (n=307 cores; 142 cases) |
|---|---|---|---|---|
| Diagnosis of core: | 111 | 307 | ||
| Benign | 18 (16%) | 144 (47%) | ||
| HGPIN: | 18 (16%) | 50 (16%) | ||
| Atypia: | 14 (13%) | 14 (5%) | ||
| Cancer: | 61 (55%) | 99 (32%) | ||
|
| ||||
| Age (years): | 86 | 64 (58-71) | 142 | 63 (59-69) |
|
| ||||
| Race: | 86 | 142 | ||
| White | 77 (90%) | 118 (83%) | ||
| Asian | 2 (2%) | 8 (6%) | ||
| Black | 7 (8%) | 11 (8%) | ||
| Hispanic | 0 (0%) | 1 (1%) | ||
| Other/Unknown | 0 (0%) | 4 (3%) | ||
|
| ||||
| PSA (ng/mL): | 80 | 6.0 (3.7-7.3) | 130 | 6.1 (4.0-8.0) |
|
| ||||
| Ultrasound volume (cc): | 76 | 43 (35-70) | 115 | 50 (35-76) |
|
| ||||
| PSAD: | 73 | 0.10 (0.07-0.16) | 109 | 0.10 (0.07-0.17) |
|
| ||||
| # of biopsy cores: | 86 | 12 (12-14) | 142 | 12 (12-13) |
|
| ||||
| DRE: | 77 | 121 | ||
| Abnormal | 15 (19%) | 15 (12%) | ||
| Normal | 62 (81%) | 106 (88%) | ||
|
| ||||
| 1 Previous biopsy: | 60 | 105 | ||
| Yes | 20 (33%) | 26 (25%) | ||
| No | 40 (67%) | 79 (75%) | ||
|
| ||||
| Active surveillance: | 86 | 141 | ||
| Yes | 22 (26%) | 27 (19%) | ||
| No | 64 (74%) | 114 (81%) | ||
|
| ||||
| 2 Case Diagnosis: | 86 | 142 | ||
| Benign | 10 (12%) | 57 (40%) | ||
| HGPIN | 9 (10%) | 14 (10%) | ||
| Atypia | 5 (6%) | 1 (1%) | ||
| HGPIN+Atypia | 4 (5%) | 4 (3%) | ||
| Cancer | 58 (67%) | 66 (46%) | ||
Median (IQR) or Number (Percent). Abbreviations: high grade prostatic intraepithelial neoplasia (HGPIN), prostate specific antigen (PSA), prostate specific antigen density (PSAD), digital rectal exam (DRE).
Excluding patients on active surveillance.
Overall reported diagnosis from the case.
Figure 1. v-ets erythroblastosis virus E26 oncogene homolog (avian) (ERG) staining in prostate needle biopsies.
Prostate needle biopsies were A&B) stained by hematoxylin and eosin or C&D) evaluated for ERG staining by immunohistochemistry. A representative core containing benign glands (green arrows), cancerous glands (red), vessels (blue) and lymphocytes (black) is shown. Inset regions of A&C (indicated by boxes) are shown in B&D. Original magnifications 2.5x (A&C) and 20x (B&D).
Figure 2. Representative v-ets erythroblastosis virus E26 oncogene homolog (avian) (ERG) staining across diagnostic lesions.
Prostate needle biopsies were stained by hematoxylin and eosin (A,C,E&G) or evaluated for ERG staining by immunohistochemistry (IHC) (B,D,F&H). A&B. Negative ERG staining in a benign focus of adenosis requiring IHC with basal cell markers (p63 and high molecular weight cytokeratin [34βE12], brown) and alpha-methylacyl-CoA racemase (AMACR, red) for diagnosis (inset of A). C&D. Positive ERG staining in a focus of high grade prostatic intraepithelial neoplasia (HGPIN). Inset of C demonstrates nuclear atypia including prominent nucleoli. E&F. Positive ERG staining in a focus of atypical small acinar proliferation (ASAP). Inset of E demonstrates focal nuclear atypia. G&H. Positive ERG staining in a focus of Gleason 3+3 prostate cancer. Inset regions are indicated by boxes. Original magnifications 20x (A-H, inset A) and 40x (insets of C&E).
ERG staining in PCa
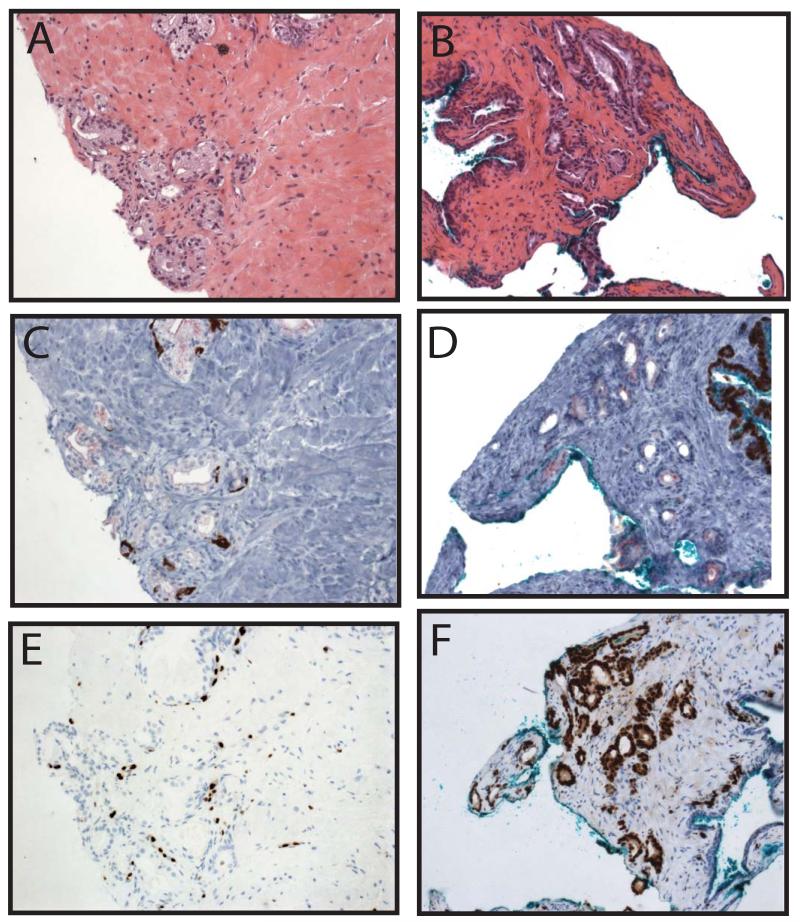
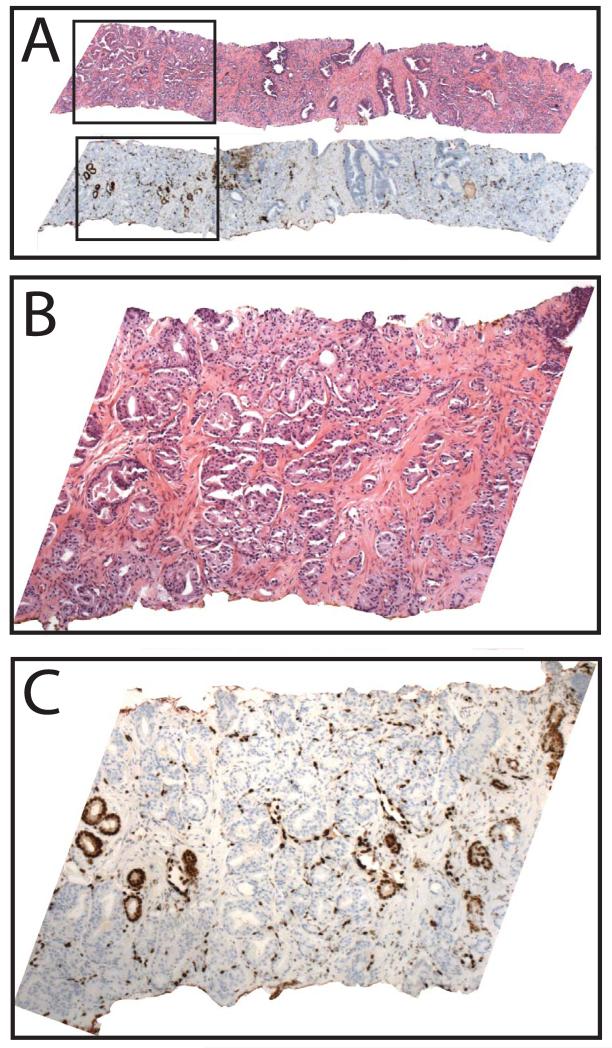
Amongst all evaluable cores (n=418), diagnosed prior to evaluation of ERG staining, ERG was expressed in cancerous glands in 71 of 160 cores (44%) as shown in Table 2 and Figure 2G&H. In cores with PCa where diagnostic IHC was performed, ERG was expressed in cancerous glands in 11 of 39 cores (28%), as shown in Table 3 and Figure 3A-F. When positive, ERG showed strong (2-3+), nuclear staining in cancerous glands; no benign glands showed ERG staining (except in a single core as described below). ERG was expressed diffusely in all cancerous glands in 70 of 71 cores (99%). A single core, shown in Figure 4A&B, showed ERG staining in a minority of cancerous glands (C), with no appreciable morphologic difference between ERG positive and negative glands. Although by FISH we could not definitively identify the ERG staining glands for evaluation of ERG rearrangement status, given the strongly clonal nature of ERG rearrangements and staining in individual tumor foci, this may represent a collision of ERG positive and negative tumors, which we have observed in prostatectomy studies (unpublished observations).
Table 2. v-ets erythroblastosis virus E26 oncogene homolog (avian) (ERG) expression in prostate needle biopsy cores (n=418).
| 1 Diagnosis | ERG expression |
|---|---|
| Benign: | 2/162 (1.2%) |
| HGPIN: | 12/68 (17.6%) |
| Atypia: | 3/28 (10.7%) |
| PCa: | 71/160 (44.7%) |
Abbreviations: high grade prostatic intraepithelial neoplasia (HGPIN), prostate cancer (PCa).
Diagnosis made prior to evaluation of ERG expression
Table 3. v-ets erythroblastosis virus E26 oncogene homolog (avian) (ERG) expression in prostate needle biopsy cores requiring diagnostic immunohistochemistry (IHC, n=101).
| 1Diagnosis | ERG expression |
|---|---|
| Benign: | 1/35 (2.9%) |
| HGPIN: | 2/9 (22.2%) |
| Atypia: | 1/18 (5.6%) |
| PCa: | 11/39 (28.2%) |
Abbreviations: high grade prostatic intraepithelial neoplasia (HGPIN), prostate cancer (PCa).
Diagnosis made after IHC with basal cell markers and alpha-methylacyl-CoA racemase (AMACR), but prior to evaluation of ERG expression.
Figure 3. Representative v-ets erythroblastosis virus E26 oncogene homolog (avian) (ERG) staining in lesions requiring diagnostic immunohistochemistry (IHC) with basal cell markers and alpha-methylacyl-CoA racemase (AMACR).
Prostate needle biopsies were stained by hematoxylin and eosin (A&B), evaluated for staining of basal cell markers p63 and high molecular weight cytokeratin (34βE12, brown) and AMACR (red) by IHC as part of the diagnostic workup (C&D), or evaluated for ERG staining by IHC (E&F). A,C&E. Negative ERG staining in a benign focus of adenosis requiring diagnostic IHC. B,D&F. Positive ERG staining in a minute focus of Gleason 3+3 PCa requiring diagnostic IHC. Original magnifications 20×.
Figure 4. A single core with focal v-ets erythroblastosis virus E26 oncogene homolog (avian) (ERG) staining in PCa.
Prostate needle biopsies were stained by hematoxylin and eosin (H&E) or evaluated for ERG staining by immunohistochemistry. In 62 of 63 cores with PCa expressing ERG, staining was present in all cancerous glands. A. A single core with PCa (top) showed focal staining of ERG in a subset of cancerous glands (bottom). Inset regions of H&E and ERG staining (indicated by boxes) are shown in B and C, respectively. Original magnifications 2.5x (A) and 10x (B&C).
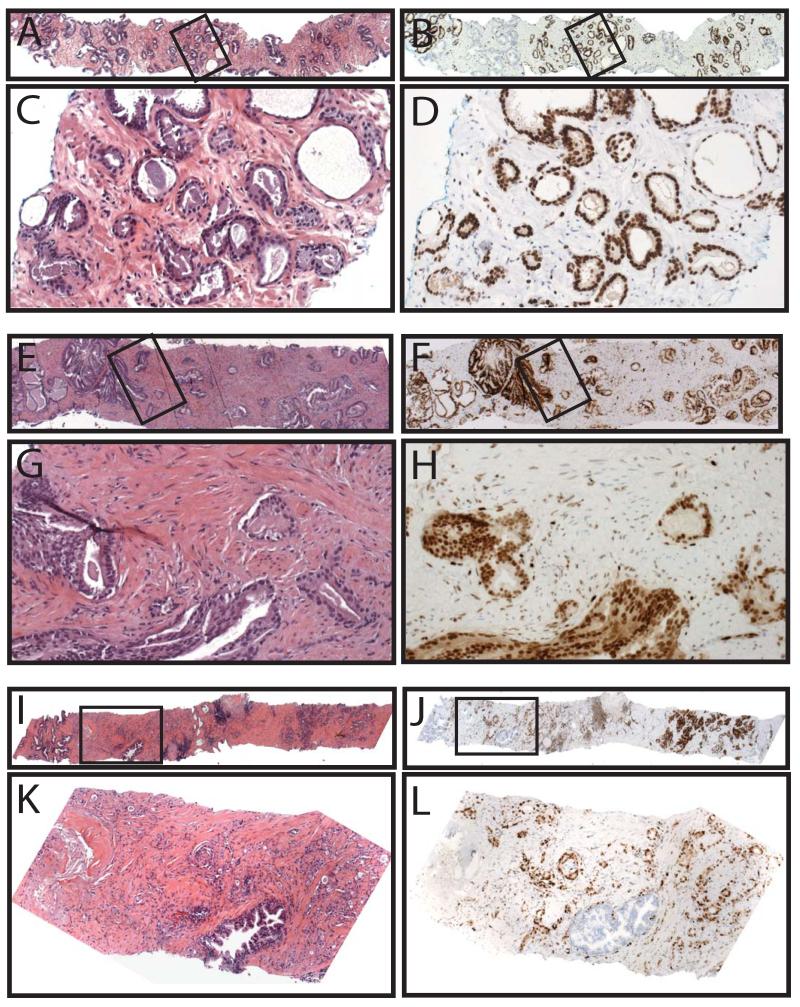
When positive, ERG showed strong nuclear staining regardless of Gleason pattern; as shown in Figure 5, amongst cancerous cores, ERG was positive in 56 of 91 (39%) Gleason score 6 cores (A-D), 30 of 52 (58%) Gleason score 7 cores (E-H) and 6 of 17 (35%) Gleason score 8-10 cores (I-L). Given the diagnostic difficulty posed by small atypical foci, we preferentially selected cores with minute cancerous foci (defined as ≥ 5% core involvement) for evaluation of ERG staining. Overall, 60 of 160 (38%) cancerous cores had minute cancerous foci, with 22 of 60 (37%) minute cancerous cores expressing ERG, compared to 49 of 100 (51%) non-minute cancerous cores.
Figure 5. v-ets erythroblastosis virus E26 oncogene homolog (avian) (ERG) staining in prostate cancer across Gleason scores.
Consecutive levels from diagnostic prostate needle biopsies were stained by hematoxylin and eosin or evaluated for ERG staining by immunohistochemistry. Representative H&E staining (A,C,E,G,I&K) and ERG staining (B,D,F,H,J&L) in cores with Gleason score 6 (A-D), 7 (E-H) and 9 (I-L) prostate cancer. Inset regions of A,B,E,F,I&J,(indicated by boxes) are shown in C,D,G,H,K&L,. Original magnifications 2.5x (A,B,E,F,I&J), 10x (K&L) and 20x (C,D,G&H).
In cases where multiple cancerous cores were evaluated from the same side (right or left) of the prostate, 10 of 10 (100%) cases showed concordant ERG staining (5 ERG positive, 5 ERG negative). In cases where multiple cancerous cores were evaluated from both sides of the prostate, 24 of 30 (80%) cases showed concordant ERG staining (9 ERG positive, 15 ERG negative), with 6 of 30 cases showing at least one ERG positive and one ERG negative core.
ERG staining in HGPIN
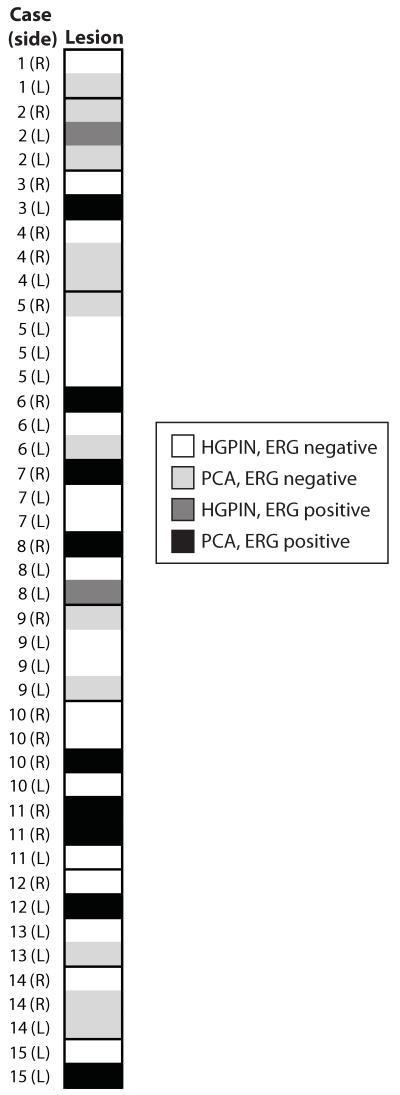
ERG was expressed in 12 of 68 (18%) cores diagnosed as HGPIN; in cores where diagnostic IHC was performed, ERG was expressed in 2 of 9 cores (22%) diagnosed as HGPIN (Table 2&3 and Figure 2C-D). In all positive cores, ERG staining was limited to HGPIN foci, with no staining in adjacent benign glands. In cases where multiple cores with HGPIN were evaluated from the same side (right or left) of the prostate, 9 of 11 (82%) cases showed concordant ERG staining (1 ERG positive, 8 ERG negative). In cases where multiple cores with HGPIN were evaluated from both sides of the prostate, 4 of 6 (67%) cases showed concordant ERG staining (1 ERG positive, 3 ERG negative), with 2 cases showing at least one ERG positive and one ERG negative core. Of 15 cases with at least one cancerous core and one core with HGPIN evaluated for ERG staining, 6 of 15 (40%) cases showed entirely concordant ERG staining (all 6 with ERG negative HGPIN and PCa), and 9 cases showing discordant ERG staining (Figure 6).
Figure 6. v-ets erythroblastosis virus E26 oncogene homolog (avian) (ERG) staining in cases with cores containing high grade prostatic intraepithelial neoplasia (HGPIN) and prostate cancer (PCa).
Prostate needle biopsies were stained by hematoxylin and eosin or evaluated for ERG staining by IHC. Heatmap visualization of fifteen cases with at least one core with HGPIN and one core with PCa. Side of the prostate (right or left) is indicated for each core. ERG negative HGPIN or PCa is indicated in white or light gray, respectively, and ERG positive HGPIN or PCa is indicated in dark gray or black, respectively, as indicated in the legend.
ERG staining in atypical foci
In 28 cores with foci diagnosed as atypical (including ASAP and PINATYP), the atypical focus in 3 (11%) expressed ERG (all diagnosed as ASAP), with ERG staining in 1 of 17 (6%) cores diagnosed as atypical after diagnostic IHC (Figure 2E-F, Tables 2&3). In all positive cores, ERG staining was limited to the atypical foci, with no staining in adjacent benign glands. Of 5 cases with at least one cancerous core and one core with an atypical focus evaluated for ERG staining, ERG staining was concordant in 4 of 5 (80%) cases (1 ERG positive, 3 ERG negative).
ERG staining in benign prostatic tissue
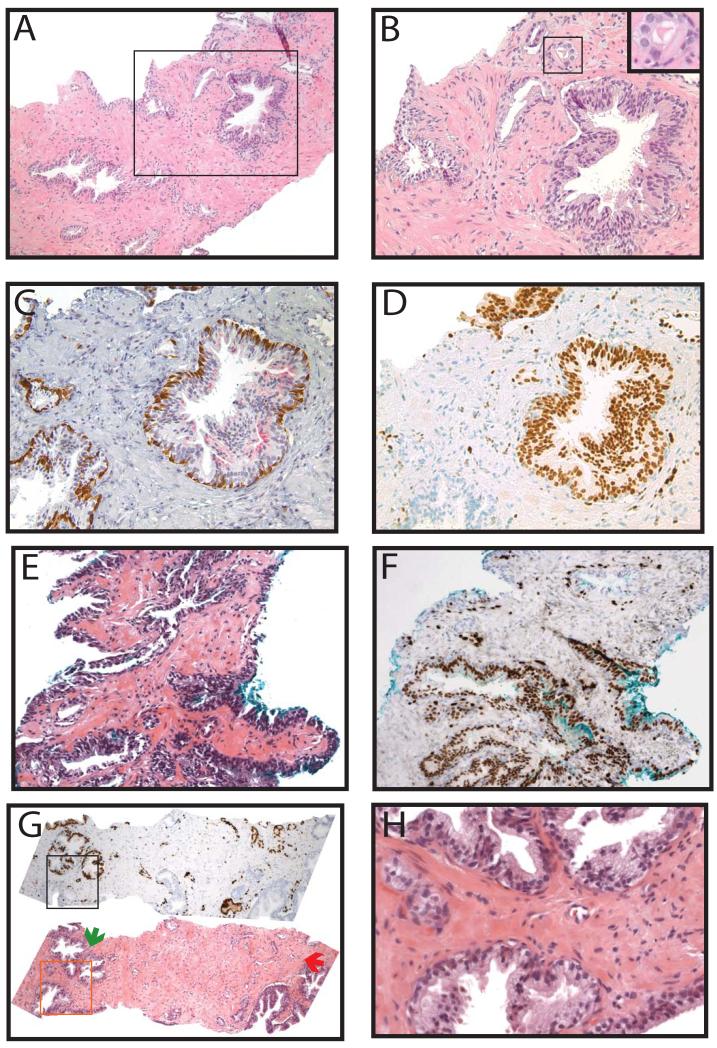
In cores diagnosed as benign, ERG was expressed in 2 of 162 cores (1%), as shown in Table 2 and Figure 7A-F. Amongst benign cores requiring diagnostic IHC (most commonly for foci of partial atrophy or adenosis), ERG was expressed in 1 of 35 cores (3%) as shown in Table 3 and Figure 7A-F. The ERG positive benign core that required diagnostic IHC was stained for a focus of small suspicious glands adjacent to a large gland with nuclear enlargement, hyperchromasia and occasional nucleoli, which upon review, is borderline between low-grade PIN and HGPIN (Figure 7A-B). Diagnostic IHC showed weak AMACR staining and a complete basal layer around the large gland suspicious for HGPIN and lack of AMACR and an incomplete patchy basal layer around the small glands (Figure 7C). ERG was expressed in the PIN gland, the adjacent small glands, and a larger gland at the edge of the biopsy (Figure 7D). Thus, on review, this core may better be classified as PINATYP with positive ERG staining. The patient with this core did not have HGPIN, atypia, or PCa on any other core in the biopsy. The second ERG positive core diagnosed as benign showed ERG staining in a large gland(s) with slight nuclear enlargement and hyperchromasia without prominent nucleoli (consistent with what was previously termed low-grade PIN), as shown in Figure 7E&F. The patient with this core had 2 additional cores with cancer in the biopsy. Finally, a single core showed ERG staining in four morphologically benign glands adjacent to a minute focus of PCa (Gleason 3+3), that also expressed ERG (Figure 7G&H). Thus, in total, ERG was expressed in only ~5 morphologically benign glands from 2 foci across 418 cores.
Figure 7. v-ets erythroblastosis virus E26 oncogene homolog (avian) (ERG) staining in cores diagnosed as benign and in morphologically benign glands.
A&B. A core diagnosed as benign contained a gland with nuclear enlargement and hyperchromasia but with only occasional nucleoli, along with adjacent suspicious small glands. Inset region of A (indicated by box) is shown in B. Inset of B indicated by box. C. Diagnostic immunohistochemistry showed weak alpha-methylacyl-CoA racemase (AMACR) staining and a complete basal layer around the larger gland and lack of AMACR and an incomplete patchy basal layer around the small glands. D. ERG was expressed in the large gland, the adjacent small glands and a large gland at the edge of the specimen. Thus, on review, this core may better be classified as high grade prostatic intraepithelial neoplasia with adjacent small atypical glands (PINATYP) with positive ERG staining. E-H. On re-review of all cores (n=418), 2 cores contained morphologically benign glands that expressed ERG. E&F. One core contained a large gland(s) with nuclear enlargement and hyperchromasia, but insufficient nucleolar enlargement for diagnosis of HGPIN, which expressed ERG. G. A second core (bottom panel) contained a focus of benign glands (green arrow) adjacent to a minute focus of cancer (red arrow), both of which expressed ERG (top panel). H. Inset of similar morphologically benign glands (indicated by box in G) that were positive (top glands) or negative (bottom gland) for ERG staining. Original magnifications 4x (G), 10x (A), 20x (B-F) and 40x (H, inset of B).
Discussion
In this study, we have demonstrated the clinical utility of a monoclonal antibody against the C-terminus of ERG across a wide spectrum of lesions encountered in diagnostic prostate core biopsies, including challenging lesions. Gene fusions between androgen regulated genes (most commonly TMPRSS2) and ERG, occur in ~50% of prostate cancers. By FISH, ERG gene rearrangements have been shown to be nearly 100% specific for the presence of PCa (or HGPIN immediately adjacent to ERG rearranged PCa) across more than 2,000 samples, including prostatectomy and needle biopsy specimens7. As FISH can be difficult to perform in routine diagnostic settings, alternative techniques to detect ERG gene rearrangements are desirable and may be more clinically applicable. Although common ERG gene fusions do not encode chimeric proteins, a monoclonal antibody against the C-terminus of ERG (retained in all known ERG gene fusions) has previously been shown to be highly sensitive and specific for detecting ERG rearranged PCa (as assessed by FISH) on prostatectomy specimens11. Although the antibody used in our study has also been shown to react with FLI110, our results demonstrate that FLI1 staining is very rare in prostate cancer (given the previously demonstrated concordance between the antibody and ERG rearrangement status by FISH11) and benign prostate glands (given only 5 benign glands across 418 cores with any staining in the current study).
We evaluated ERG staining in two cohorts of diagnostic needle biopsy cores. The first retrospective cohort was enriched for cores most likely to pose diagnostic difficulty, including cores subjected to diagnostic IHC [with basal cell markers and AMACR] and cores with minute cancer foci. The second cohort consisted of cores from all cases signed out during 3 months at an academic center with subspecialty based signout. In this cohort, cores selected for ERG evaluation from each case were again enriched for those requiring diagnostic IHC and minute cancer foci, but also included HGPIN, benign cores from men without a diagnosis of PCa and a full spectrum of Gleason score PCa. Hence, our study assessed ERG staining across a large spectrum of lesions encountered in diagnostic needle biopsy specimens.
In this study, ERG was expressed in 71 of 160 (44%) cores with cancer, including 11 of 39 (28%) cores requiring IHC for diagnosis and 22 of 60 (37%) cores with minute cancer foci. In positive cores, ERG showed strong nuclear staining, and in 70 of 71 (98%) cores was diffusely expressed in all cancerous glands, regardless of Gleason pattern, consistent with the highly clonal nature of ERG rearrangements. As not all cores with minute cancer foci or the highest Gleason score were selected from each case, we did not formally compare rates of ERG staining in minute vs. non-minute cancers and across Gleason scores, which has been addressed in prior studies using FISH for ERG rearrangement7, 27.
Overall, our results were highly concordant with those of Park et al., who performed IHC on prostatectomy specimens using the same antibody, where 44% of PCa foci expressed ERG (all of which showed diffuse staining)11, as well as those of van Leenders et al., who using the same antibody reported ERG staining in 51 of 83 (61%) cores with cancerous foci glands23. As the antibody used in our study has been shown to have >95% sensitivity and specificity between FISH for ERG rearrangement and ERG staining by IHC11, our results here demonstrate that IHC can be used to determine ERG rearrangement status on biopsy specimens, which may facilitate molecular subtyping of prostate cancer in the clinical setting. However, concordant ERG status in cancerous cores evaluated from both sides of the prostate was observed in only 79% of evaluated cases, consistent with the multifocal nature of prostate cancer and supporting previous FISH and IHC based studies demonstrating heterogeneous ERG status in different cancer foci. Thus, future efforts correlating ERG status in cancer on biopsy, index and secondary lesions in prostatectomy samples, and metastatic cancer can likely be used to track lesion progression. TMPRSS2 and ERG are located ~3Mb apart on chr. 21, and TMPRSS2:ERG gene fusions can develop either through insertion or deletion of the intervening region7. Hence, FISH, which can differentiate these subtypes of TMPRSS2:ERG gene fusions, may have increased utility compared to IHC concerning issues of clonality or lesion tracking.
In our current study, ERG was expressed in 18% of HGPIN foci, consistent with prior FISH studies from independent groups on prostatectomy specimens, which showed that ~15% of HGPIN lesions harbor ERG rearrangements, invariably adjacent to ERG rearranged PCa16-18. Similarly, Zhang et al. showed that HGPIN lesions from 10 of 60 (17%) patients harbored TMPRSS2 rearrangements, invariably associated with TMPRSS2 rearranged PCa28. Furstato et al., using a different ERG monoclonal antibody, showed similar concordance of ERG expressing HGPIN with adjacent ERG expressing PCa10. Finally, in their study of limited cancer (77 needle biopsies), Yaskiv et al. identified ERG staining in 5 of 17 (29%) cores with HGPIN, with all ERG+ HGPIN adjacent to ERG+ PCa25.
van Lenders et al. reported ERG staining in 11 of 21 foci of HGPIN (52%), attributing this higher frequency to difficulties in identifying HGPIN on slides used for previous FISH based studies23. Based on this higher frequency of ERG positive HGPIN, they conclude that ERG is not involved in the transition of HGPIN to invasive carcinoma, and instead drives the development of HGPIN from benign glands23. However, all HGPIN foci evaluated by van Lenders et al. were selected from cores that contained cancer. In the FISH based study by Han et al., 11/15 foci (73%) of HGPIN adjacent to carcinoma had ERG rearrangements (all 11 adjacent to ERG rearranged carcinoma), while 0/10 foci of HGPIN distant to carcinoma had ERG rearrangements (even though 8/10 carcinomas were ERG rearranged)16. If ERG was instrumental in the transition of benign glands to HGPIN, ERG rearrangements and protein expression should be equally prevalent in HGPIN lesions adjacent and distal to carcinoma, which has not been observed. Hence, we feel the 18% prevalence of ERG staining in HGPIN in our study, which included cores with HGPIN from both benign and PCa cases, more accurately represents the true prevalence.
Presently, the risk of cancer on rebiopsy after a diagnosis of isolated HGPIN is ~25%, and clinicopathological parameters are unable to reliably identify men with increased risk of cancer on rebiopsy2. Based on the association of ERG (or TMPRSS2) rearranged or expressing HGPIN and similarly rearranged or expressing PCa, we hypothesize that ERG positive HGPIN indicates unsampled PCa, or HGPIN that will inevitably progress to invasive disease. Thus, we predict that ERG staining may be useful for risk stratification of isolated HGPIN, with ERG positive isolated HGPIN having an increased risk of cancer on rebiopsy.
Also supporting previous IHC results10, 11, 23-25, we confirm here that ERG staining in benign glands, including foci requiring diagnostic IHC, is exceedingly rare (2 foci of ~5 glands in 397 cores). In our opinion, since morphologically benign glands (or foci consistent with what was previously termed low-grade PIN) rarely express ERG, those that do are molecularly neoplastic. Unlike AMACR, which can be negative in ~20% of unequivocal PCa, is positive in a subset of benign mimics of PCa including adenosis and partial atrophy, and may show focal staining in up to 20% of morphologically benign glands29-31, our results here confirm that ERG staining is highly specific for PCa and is exceedingly rare in benign glands (including mimickers of PCa). Hence, we advocate that in an atypical focus composed of atypical acini with small acinar architecture (ASAP) where HGPIN or PINATYP can be excluded and basal cell markers are negative, ERG staining strongly supports a diagnosis of PCa, regardless of AMACR staining.
In our study, ERG staining was noted in 3/28 (11%) cores with atypical foci (all 3 diagnosed as ASAP). Similarly, He et al. identified ERG staining in 16 of 103 (15.5%) atypical biopsies24. However, all cores in both studies were diagnosed prior to evaluation of ERG staining. Hence, these studies do not directly address the ability of ERG staining to add to current diagnostic IHC in the workup of challenging cases. Additionally, individual’s thresholds for calling lesions atypical or PCa (both with and without diagnostic IHC) complicate assessment of the usefulness of a novel biomarker. However, the consistency of our results compared to previous IHC and FISH based studies, which demonstrate exceptionally high specificity of ERG rearrangements and staining for PCa (or adjacent HGPIN), in combination with the ease of staining interpretation, suggests immediate diagnostic utility.
He et al. did not find significantly different rates of cancer in follow-up biopsies from patients with ERG staining positive or negative atypical biopsies24. However, our results, and previous FISH and IHC based studies, suggest that ERG positive atypical or HGPIN foci only indicate risk for developing/harboring unsampled cancer immediately adjacent to that ERG positive focus, and hence prospective studies with targeted re-biopsy may be required to assess the utility of ERG staining for risk stratification. Similar studies will likely be required to determine the significance of isolated morphologically benign glands that are ERG positive.
In summary, our study evaluating ERG staining by IHC in a large cohort of prostate biopsies demonstrates positivity in 44% of PCa, 18% of HGPIN and 11% of atypical foci. In positive cancer foci, ERG is expressed uniformly in almost all cases, and ERG staining is exceedingly rare in benign glands. Overall, ERG appears to be more specific than AMACR for PCa, hence ERG staining in an atypical focus (where HGPIN or PINATYP can be excluded) supports a diagnosis of PCa, irrespective of AMACR staining. We recommend adding ERG to standard diagnostic IHC (basal markers and AMACR) in the work-up of atypical lesions in prostate core biopsies as well as for molecular profiling of PCa. Large multi-institutional studies will be required to characterize the risk-stratification of ERG positive isolated HGPIN and better define rebiopsy strategy and clinical management.
Acknowledgements
The authors thank Gary Pestano (Ventana Medical Systems) for providing the ERG antibody and IHC reagents. Supported in part by the Early Detection Research Network (U01 CA111275 and U01 CA113913), NIH S.P.O.R.E. (P50 CA69568).
Funding: Supported in part by the Early Detection Research Network (U01 CA111275 and U01 CA113913) and NIH S.P.O.R.E. (P50 CA69568).
Footnotes
Conflict of interest: The University of Michigan has been issued a patent on the detection of ETS gene fusions in prostate cancer, on which S.A.T. and A.M.C. are listed as co-inventors. The University of Michigan licensed the diagnostic field of use to Gen-Probe, Inc, which sublicensed rights to Ventana Medical Systems, Inc. Neither company played a role in data collection, interpretation or analysis, and did not participate in the study design, drafting or revision of the manuscript, or the decision to submit for publication. S.A.T. has received honoraria from Ventana Medical Systems and has served as a consultant to Cougar Biotechnology, AstraZeneca and Compendia Biosciences. N.P. has served as a consultant for Ventana Medical Systems. A.M.C. has served as consultant to Gen-Probe, Inc. and Ventana Medical Systems. J.S. and L.P.K. have no conflicts of interest to disclose.
References
- 1.Van der Kwast TH, Evans A, Lockwood G, et al. Variability in diagnostic opinion among pathologists for single small atypical foci in prostate biopsies. Am J Surg Pathol. 2010;34(2):169–177. doi: 10.1097/PAS.0b013e3181c7997b. [DOI] [PubMed] [Google Scholar]
- 2.Epstein JI, Herawi M. Prostate needle biopsies containing prostatic intraepithelial neoplasia or atypical foci suspicious for carcinoma: implications for patient care. J Urol. 2006;175(3 Pt 1):820–834. doi: 10.1016/S0022-5347(05)00337-X. [DOI] [PubMed] [Google Scholar]
- 3.Epstein JI. Precursor lesions to prostatic adenocarcinoma. Virchows Arch. 2009;454(1):1–16. doi: 10.1007/s00428-008-0707-5. [DOI] [PubMed] [Google Scholar]
- 4.Kunju LP, Chinnaiyan AM, Shah RB. Comparison of monoclonal antibody (P504S) and polyclonal antibody to alpha methylacyl-CoA racemase (AMACR) in the work-up of prostate cancer. Histopathology. 2005;47(6):587–596. doi: 10.1111/j.1365-2559.2005.02281.x. [DOI] [PubMed] [Google Scholar]
- 5.Tomlins SA, Rhodes DR, Perner S, et al. Recurrent fusion of TMPRSS2 and ETS transcription factor genes in prostate cancer. Science. 2005;310(5748):644–648. doi: 10.1126/science.1117679. [DOI] [PubMed] [Google Scholar]
- 6.Kumar-Sinha C, Tomlins SA, Chinnaiyan AM. Recurrent gene fusions in prostate cancer. Nat Rev Cancer. 2008;8(7):497–511. doi: 10.1038/nrc2402. [DOI] [PMC free article] [PubMed] [Google Scholar]
- 7.Tomlins SA, Bjartell A, Chinnaiyan AM, et al. ETS Gene Fusions in Prostate Cancer: From Discovery to Daily Clinical Practice. Eur Urol. 2009;56(2):275–286. doi: 10.1016/j.eururo.2009.04.036. [DOI] [PubMed] [Google Scholar]
- 8.Han B, Mehra R, Dhanasekaran SM, et al. A fluorescence in situ hybridization screen for E26 transformation-specific aberrations: identification of DDX5-ETV4 fusion protein in prostate cancer. Cancer Res. 2008;68(18):7629–7637. doi: 10.1158/0008-5472.CAN-08-2014. [DOI] [PMC free article] [PubMed] [Google Scholar]
- 9.Pflueger D, Rickman DS, Sboner A, et al. N-myc downstream regulated gene 1 (NDRG1) is fused to ERG in prostate cancer. Neoplasia. 2009;11(8):804–811. doi: 10.1593/neo.09572. [DOI] [PMC free article] [PubMed] [Google Scholar]
- 10.Furusato B, Tan SH, Young D, et al. ERG oncoprotein expression in prostate cancer: clonal progression of ERG-positive tumor cells and potential for ERG-based stratification. Prostate Cancer Prostatic Dis. 2010;13(3):228–237. doi: 10.1038/pcan.2010.23. [DOI] [PMC free article] [PubMed] [Google Scholar]
- 11.Park K, Tomlins SA, Mudaliar KM, et al. Antibody-Based Detection of ERG Rearrangement-Positive Prostate Cancer. Neoplasia. 2010;12(7):590–598. doi: 10.1593/neo.10726. [DOI] [PMC free article] [PubMed] [Google Scholar]
- 12.Barry M, Perner S, Demichelis F, Rubin MA. TMPRSS2-ERG fusion heterogeneity in multifocal prostate cancer: clinical and biologic implications. Urology. 2007;70(4):630–633. doi: 10.1016/j.urology.2007.08.032. [DOI] [PMC free article] [PubMed] [Google Scholar]
- 13.Furusato B, Gao CL, Ravindranath L, et al. Mapping of TMPRSS2-ERG fusions in the context of multi-focal prostate cancer. Mod Pathol. 2008;21(2):67–75. doi: 10.1038/modpathol.3800981. [DOI] [PubMed] [Google Scholar]
- 14.Mehra R, Han B, Tomlins SA, et al. Heterogeneity of TMPRSS2 gene rearrangements in multifocal prostate adenocarcinoma: molecular evidence for an independent group of diseases. Cancer Res. 2007;67(17):7991–7995. doi: 10.1158/0008-5472.CAN-07-2043. [DOI] [PubMed] [Google Scholar]
- 15.Svensson MA, LaFargue CJ, MacDonald TY, et al. Testing mutual exclusivity of ETS rearranged prostate cancer. Lab Invest. 2011;91(3):404–412. doi: 10.1038/labinvest.2010.179. [DOI] [PMC free article] [PubMed] [Google Scholar]
- 16.Han B, Mehra R, Lonigro RJ, et al. Fluorescence in situ hybridization study shows association of PTEN deletion with ERG rearrangement during prostate cancer progression. Mod Pathol. 2009;22(8):1083–1093. doi: 10.1038/modpathol.2009.69. [DOI] [PMC free article] [PubMed] [Google Scholar]
- 17.Carver BS, Tran J, Gopalan A, et al. Aberrant ERG expression cooperates with loss of PTEN to promote cancer progression in the prostate. Nat Genet. 2009;41(5):619–624. doi: 10.1038/ng.370. [DOI] [PMC free article] [PubMed] [Google Scholar]
- 18.Mosquera JM, Perner S, Genega EM, et al. Characterization of TMPRSS2-ERG fusion high-grade prostatic intraepithelial neoplasia and potential clinical implications. Clin Cancer Res. 2008;14(11):3380–3385. doi: 10.1158/1078-0432.CCR-07-5194. [DOI] [PMC free article] [PubMed] [Google Scholar]
- 19.King JC, Xu J, Wongvipat J, et al. Cooperativity of TMPRSS2-ERG with PI3-kinase pathway activation in prostate oncogenesis. Nat Genet. 2009;41(5):524–526. doi: 10.1038/ng.371. [DOI] [PMC free article] [PubMed] [Google Scholar]
- 20.Zong Y, Xin L, Goldstein AS, Lawson DA, Teitell MA, Witte ON. ETS family transcription factors collaborate with alternative signaling pathways to induce carcinoma from adult murine prostate cells. Proc Natl Acad Sci U S A. 2009;106(30):12465–12470. doi: 10.1073/pnas.0905931106. [DOI] [PMC free article] [PubMed] [Google Scholar]
- 21.Setlur SR, Mertz KD, Hoshida Y, et al. Estrogen-dependent signaling in a molecularly distinct subclass of aggressive prostate cancer. J Natl Cancer Inst. 2008;100(11):815–825. doi: 10.1093/jnci/djn150. [DOI] [PMC free article] [PubMed] [Google Scholar]
- 22.Tomlins SA, Mehra R, Rhodes DR, et al. Integrative molecular concept modeling of prostate cancer progression. Nat Genet. 2007;39(1):41–51. doi: 10.1038/ng1935. [DOI] [PubMed] [Google Scholar]
- 23.van Leenders GJ, Boormans JL, Vissers CJ, et al. Antibody EPR3864 is specific for ERG genomic fusions in prostate cancer: implications for pathological practice. Mod Pathol. 2011;24(8):1128–1138. doi: 10.1038/modpathol.2011.65. [DOI] [PubMed] [Google Scholar]
- 24.He H, Magi-Galluzzi C, Li J, et al. The diagnostic utility of novel immunohistochemical marker ERG in the workup of prostate biopsies with “atypical glands suspicious for cancer”. Am J Surg Pathol. 2011;35(4):608–614. doi: 10.1097/PAS.0b013e31820bcd2d. [DOI] [PubMed] [Google Scholar]
- 25.Yaskiv O, Zhang X, Simmerman K, et al. The utility of ERG/P63 double immunohistochemical staining in the diagnosis of limited cancer in prostate needle biopsies. Am J Surg Pathol. 2011;35(7):1062–1068. doi: 10.1097/PAS.0b013e318215cc03. [DOI] [PubMed] [Google Scholar]
- 26.Sato Y. Role of ETS family transcription factors in vascular development and angiogenesis. Cell Struct Funct. 2001;26(1):19–24. doi: 10.1247/csf.26.19. [DOI] [PubMed] [Google Scholar]
- 27.Albadine R, Latour M, Toubaji A, et al. TMPRSS2-ERG gene fusion status in minute (minimal) prostatic adenocarcinoma. Mod Pathol. 2009;22(11):1415–1422. doi: 10.1038/modpathol.2009.121. [DOI] [PMC free article] [PubMed] [Google Scholar]
- 28.Zhang S, Pavlovitz B, Tull J, Wang Y, Deng FM, Fuller C. Detection of TMPRSS2 gene deletions and translocations in carcinoma, intraepithelial neoplasia, and normal epithelium of the prostate by direct fluorescence in situ hybridization. Diagn Mol Pathol. 2010;19(3):151–156. doi: 10.1097/PDM.0b013e3181bb216a. [DOI] [PubMed] [Google Scholar]
- 29.Beach R, Gown AM, De Peralta-Venturina MN, et al. P504S immunohistochemical detection in 405 prostatic specimens including 376 18-gauge needle biopsies. Am J Surg Pathol. 2002;26(12):1588–1596. doi: 10.1097/00000478-200212000-00006. [DOI] [PubMed] [Google Scholar]
- 30.Kunju LP, Rubin MA, Chinnaiyan AM, Shah RB. Diagnostic usefulness of monoclonal antibody P504S in the workup of atypical prostatic glandular proliferations. Am J Clin Pathol. 2003;120(5):737–745. doi: 10.1309/3T3Y-0K0T-UMYH-3WY2. [DOI] [PubMed] [Google Scholar]
- 31.Przybycin CG, Kunju LP, Wu AJ, Shah RB. Partial atrophy in prostate needle biopsies: a detailed analysis of its morphology, immunophenotype, and cellular kinetics. Am J Surg Pathol. 2008;32(1):58–64. doi: 10.1097/PAS.0b013e318093e3f6. [DOI] [PubMed] [Google Scholar]


