Abstract
Titania is the dominant white pigment and photocatalytic material, a key component of sunscreens and has promising applications in photovoltaics and sensors of organic vapors. The growth of TiO2 nanoparticles by sintering, the critical step during their large scale manufacture and processing, is elucidated and quantified by molecular dynamics. Highly mobile ions from the particle surface fill in the initially concave space between nanoparticles (surface diffusion) forming the final, fully-coalesced, spherical-like particle with minimal displacement of inner Ti and O ions (grain boundary diffusion) revealing also the significance and sequence of these two sintering mechanisms of TiO2. A sintering rate for TiO2 nanoparticles is extracted that is much faster than that in the literature but nicely converges to it for increasing particle size.
Keywords: nanotechnology, aerosol science, solid state, surface diffusion
1. Introduction
Titania (TiO2) nanoparticles have many attractive applications in photovoltaic1 and photocatalytic2 processes as well as chemo-resistive gas sensors3 and sunscreens4, while possible health effects of these nanoparticles are investigated5. The performance of TiO2 nanoparticles depends considerably on their size and composition which are determined by their sintering rate during synthesis and/or post-processing. The sintering rate determines the growth rate of nanoparticles and is crucial for design of their gas-phase synthesis with controlled size, structure, composition and eventual performance in a number of applications6.
Most studies of sintering during synthesis of nanoparticles extract effective rather than intrinsic sintering rates of TiO27-11. In contrast, Seto et al.12 have proposed a sintering rate for TiO2 and validated it by accounting for the detailed fluid mechanics of their hot wall reactor forming rather large TiO2 nanoparticles (dp = 10 – 100 nm). Little is known, however, for the sintering rate of small TiO2 nanoparticles (dp < 10 nm) as it is difficult to reliably measure it.
On the other hand molecular dynamics (MD) simulations have been used to study the sintering to full coalescence of metallic and metalloid nanoparticles13,14 though much less has been done for ceramic ones as their force fields and potentials are difficult to determine. Nevertheless Collins et al.15 identified three stages of TiO2 sintering (contact, locking and fusion) using the force field of Matsui and Akaogi16. Similarly, Koparde and Cummings17 investigated the sintering of two TiO2 nanoparticles up to t = 0.5 ns by tracking the shrinkage of the center-to-center distance and the growth of the sintering neck. They compared MD with phenomenological sintering models, investigated the melting of TiO2 nanoparticles18 and found that the transformation size of anatase to rutile titania was only 1.65 nm at T = 1473 K which was further decreased for increasing T19.
The above MD simulations for TiO2 sintering have reached up to no more than 1 ns residence time, a duration that is not sufficient for complete coalescence of the considered particles. So most of the surface area reduction of such small particles has taken place by adhesion (contact) and neck growth (locking) that limited the detailed understanding of sintering mechanisms and, most importantly, the extraction of quantitative sintering rates that are needed in systematic process design for manufacturing nanoparticles.
Here, the complete sintering of rutile TiO2 nanoparticles is investigated by accelerated MD20 from adhesion and neck growth to finally full coalescence up to several hundred nanoseconds. This allows determining the sintering rate of very small TiO2 nanoparticles (dp < 5 nm) by monitoring the evolution of their surface area and comparing it to that of larger particles12,21. Here the sintering mechanism of TiO2 is unraveled and its rate of sintering or coalescence is quantified, bridging the gap of knowledge from a few molecules to several nanometers, the key size range for nanoparticle properties and performance.
2. Theory
2.1 Molecular Dynamics
The Buckingham-type potential, U, of Matsui and Akaogi16 is used here as it reproduces best the TiO2 crystal structures of rutile, anatase and brookite22:
| (1) |
where rij is the distance between the centers of ions i and j with their charges qi and qj, respectively. The constants Aij, Bij and Cij depend on the Ti or O ion combination. The performance of this force field was investigated for simulation of the (110) surface of rutile TiO2 and, even though it was developed for bulk TiO2, quite good agreement was found in terms of bond lengths23. This potential also gives similar results to computationally more demanding polarizable force fields24. Comparison of the above force field with density functional theory (DFT) showed good agreement for clusters larger than Ti9O1825.
Here, charge neutral, spherical particles with diameter dp,0 = 2 – 4 nm have been cut out from a perfect rutile TiO2 crystal made of multiples of its unit cell26. These particles were equilibrated by temperature rescaling for 100 ps with a timestep of 1 fs22. The quality of equilibration and energy conservation has been tested by integration in the microcanonical ensemble (NVE) for additional 100 ps. Two particles with different initial ion velocity distribution at each temperature and diameter have been prepared. These have been combined to one simulation with a minimum separation of 0.3 nm between the closest ion centers of the two particles. For each diameter and temperature, four simulations were carried out by initially turning the second particle by 0, 90, 180 and 270°. Sintering simulations have been carried out in the microcanonical (NVE, constant energy) and NVE combined with velocity scaling every 103 timesteps of 1 or 3 fs22 (conserved temperature) to minimize the influence of temperature control on the dynamics.
2.2 Surface Area Analysis
The particle surface area is determined using the MSMS 6.2.1 program27 which calculates the surface areas of overlapping spheres (here, corresponding to Ti or O ions) numerically and analytically. The radius of the probing sphere was 2.25 Å corresponding to that of a N2 molecule while the radii of the Ti and O ions are their van der Waals radii, 1.96 and 1.52 Å, respectively28. This corresponds to the standard measurement of particle surface area by N2 adsorption29.
2.3 GPU Acceleration
The simulations have been run on a common graphics card (NVIDIA GeForce GTX 295) and a desktop workstation (Dell Precision T3400, Ubuntu 9.10, CUDA Version 2.3). Some issues between central (CPU) and graphics processing unit (GPU) simulations have to be considered30, especially for single precision floating point operations to achieve quite good energy conservation31. The open source MD code HOOMD-blue 0.8.232 was modified to simulate the TiO2 pairwise potential of Matsui and Akaogi16. The original code running on one GPU attains a performance of around 34 CPUs in parallel on a distributed memory cluster for Lennard-Jones liquids with rcut = 3σ32. There, significant computational time was used on updating the neighbor lists of the ions, but here to account for the long range interactions of the TiO2 force field all ions have been included in the neighbor lists and therefore it was not updated during the simulations. The implemented TiO2 potentials have been optimized with single precision runtime math operations and benchmarking the code for different block sizes33. This resulted in a speedup of 114 compared to LAMMPS34 on a single CPU on the same machine for sintering of two TiO2 particles with dp,0 = 3 nm (2730 ions). The required memory for the real and “ghost” ions limited the sintering simulations to particles with initial diameters between 5 and 6 nm on the utilized GPU chip.
2.4 Characteristic sintering time
The characteristic sintering time, τ, is the time needed for the sinter neck diameter to reach 83 % of the initial primary particle diameter: lf/dp,0 = 0.8321. This corresponds to a 67 % reduction of excess surface area over that of a volume-equivalent fully coalesced sphere. This is close to the reduction of excess surface area of (1 - 1/e) = 63 % by exponential models35 with constant τ36 that are routinely used in process design for nanoparticle synthesis11.
The characteristic sintering time of Kobata et al.21 is based on a surface diffusion neck growth model37:
| (2) |
where dp is the primary particle diameter (m) and T the temperature (K). Using this equation, Kobata et al.21 predicted a final primary particle size of 50 nm in reasonable agreement with experimental data. Based on a grain boundary diffusion neck growth model37, Seto et al.12 proposed also:
| (3) |
and simulated the evolution of the particle surface area by accounting for the flow field in good agreement with the measured TiO2 primary particle diameters of TiO2 aggregates (dp = 10 – 100 nm) made in hot-wall aerosol reactors at T = 300 – 1673 K.
3. Results and Discussion
3.1 Evolution of nanoparticle surface area by sintering
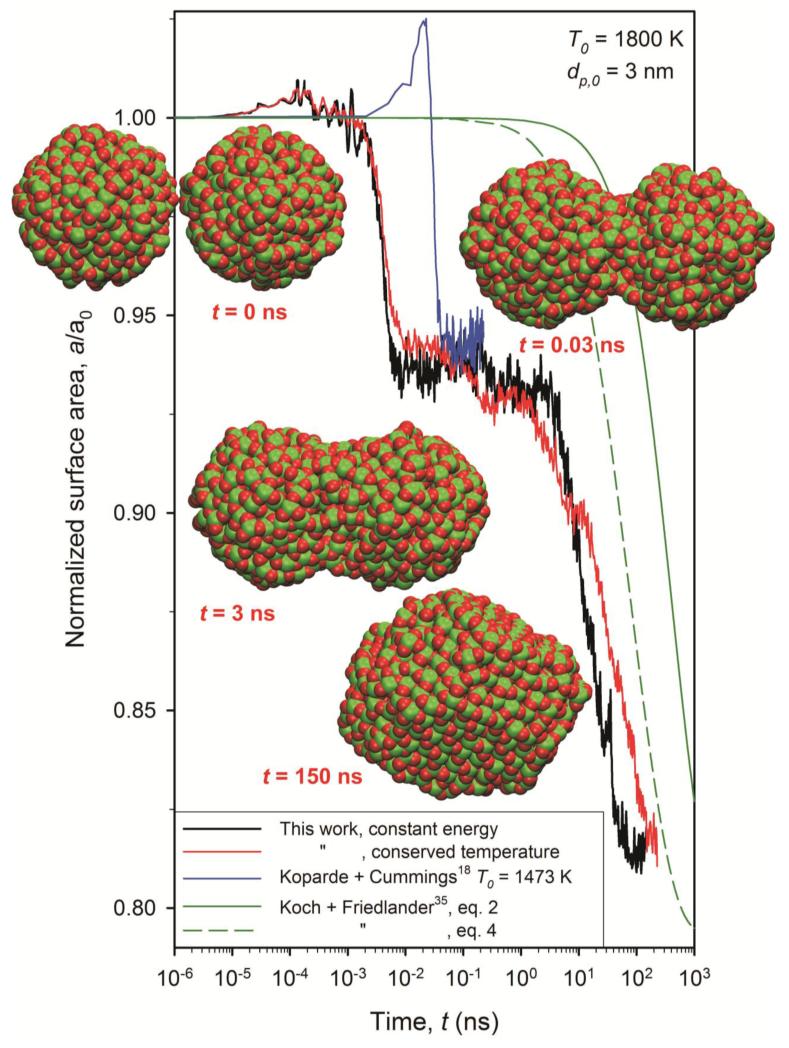
Figure 1 shows the evolution of the surface area, a, of two TiO2 nanoparticles (dp,0 = 3 nm) normalized by their initial surface area, a0, during sintering by MD in a microcanonical (NVE) ensemble (constant energy, black line) with a time step of 1 fs and conserved temperature (NVE with velocity rescaling, red line) with a time step of 3 fs at initial T0 = 1800 K where both simulations result in a similar surface area evolution. The insets in Fig. 1 show the two TiO2 nanoparticles (Ti: green and O: red) at t = 0, 0.03, 3 and 150 ns along with the predictions of a common phenomenological model35 (green line) for two characteristic sintering times, τ.
Figure 1.
Evolution of normalized surface area of two sintering TiO2 nanoparticles (dp,0 = 3 nm) by MD for constant energy (black line) and conserved temperature (red line) integration at T0 = 1800 K along with the MD simulations18 at 1473 K (blue line, constant energy) and the predictions of a phenomenological model35 with characteristic sintering times from equation 2 (green solid line) by Kobata et al.21 and equation 4 (green broken line) developed here.
At the beginning (10−5 – 10−3 ns), the two particles approach each other and slightly rotate to adjust their lattice planes which has also been observed for example for gold nanoparticles by MD14 and experimentally38 and might be an indication of an oriented attachment mechanism39 for TiO2 where highly mobile particles translate and rotate to find energetically favorable contact points. Then their total surface area might even increase slightly by deformation arising by their ion interactions. Shortly after, sintering starts reducing the surface area in three stages15: First by about ~6 – 7 % through adhesion and initial neck growth18 of the two particles at t = 10−3 – 0.01 ns. Second the area is reduced by another 1 – 2 % at 0.01 – 1 ns forming rather oval structures where the sinter neck becomes comparable to the particle diameter and, finally the third stage at about 1 – 100 ns, where the a/a0 decreases slowly by about 10 % to full coalescence by forming a compact, spherical-like particle.
This stage-wise evolution of sintering has been observed also for micron-sized Cu, Ag and UO2 particles40, by boundary integral simulations for viscous sintering of amorphous particles41 and for MD simulation of iron cluster coalescence42. It is consistent also with previous MD of TiO218 for two rutile (dp,0 = 3 nm) particles (Fig. 1: blue line) at T = 1473 K (NVE) where after the initial peak of surface area by particle deformation, the first stage of adhesion leads to a similar area reduction. This first stage by Koparde and Cummings18 occurs later than here because their initial particle separation was 1 nm instead of 0.3 nm here.
Figure 1 shows also that the slope of the final sintering stage is comparable to that (solid green line) of the phenomenological model35 with the characteristic sintering time of equation (2). Early deviations between the two simulations are caused by the surface area loss by contact and adhesion during the first sintering stage that is not accounted for by that model35 that underpredicts the surface area evolution by over an order of magnitude indicating that the employed sintering rate of equation (2) is too slow.
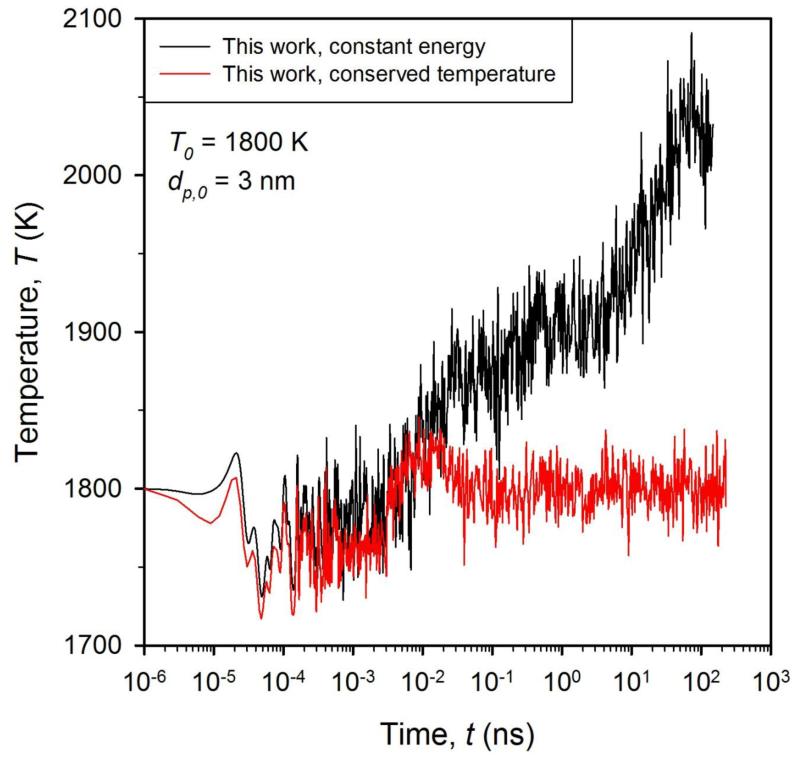
Figure 2 shows the evolution of the particle temperature for the simulation of Fig. 1 for constant energy integration (NVE, black line) and conserved temperature (red line). The temperature increases by ΔT = 300 K from 10−3 to 100 ns by the conversion of excess surface energy to kinetic energy (NVE) whereas it remains around T = 1800 K for the conserved temperature simulation (red line). Although temperature control can influence ion dynamics, there is little difference between the two calculations with respect to particle surface area dynamics (Fig. 1). To compare the present MD data with the literature and address realistic systems where in most cases the excess heat is removed by colliding gas molecules42, all subsequent simulations are carried out at conserved temperature.
Figure 2.
Evolution of temperature of two sintering TiO2 nanoparticles (dp,0 = 3 nm) for constant energy (black line) and conserved temperature (red line) integration at 1800 K.
3.2 Sintering mechanism of TiO2
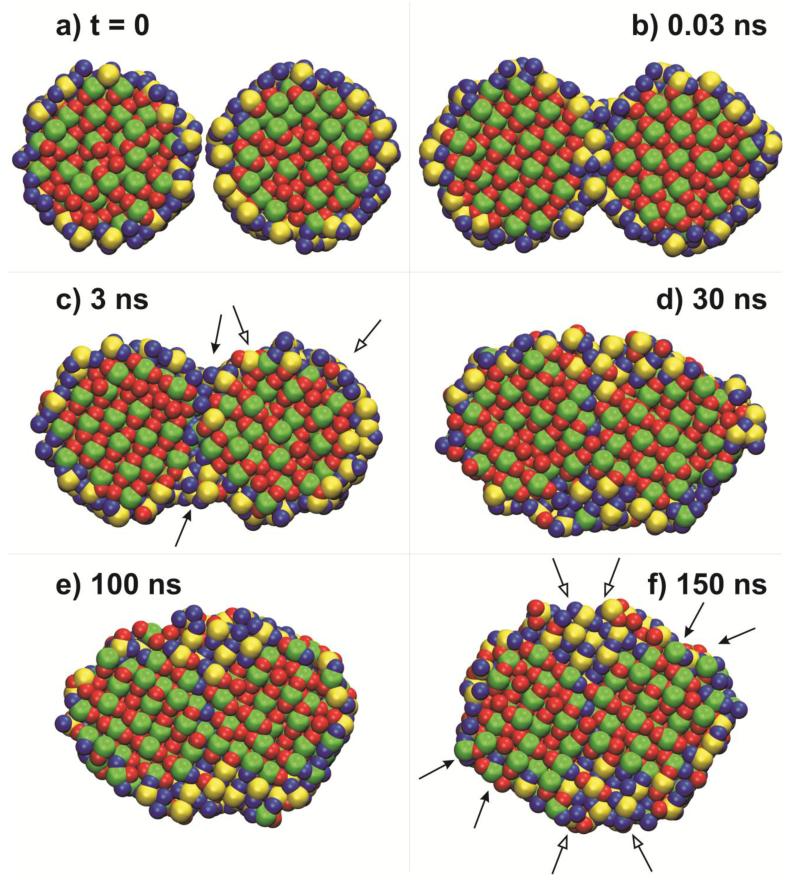
The ion mobility and the intrinsic mechanism of TiO2 nanoparticle sintering are elucidated by coloring the Ti and O ions initially on the particle surface yellow and blue, respectively, while the bulk ones, green and red, as in Fig. 1. Figure 3 shows snapshots of these nanoparticle cross-sections at a) t = 0, b) 0.03 ns, c) 3 ns, d) 30 ns, e) 100 ns and f) 150 ns. At t = 0.03 ns, the particles have formed a sinter neck mostly by adhesion without much ion relocation leading to the rather large area reduction of the first sintering stage (Fig. 1). Later on, close to the end of the second sintering stage (t = 3 ns), the sinter neck diameter has been increased mostly by surface ions (yellow and blue) that have moved over the particle surface and found energetically favorable positions that fit the local lattice (surface diffusion, filled arrows) filling the initially concave region between nanoparticles (Fig. 3c). This has led some of the previously bulk ions to emerge to the particle surface (open arrows) where they increase their mobility.
Figure 3.
Snapshots of cross-sections of the particles in Fig. 1 with Ti and O ions initially (t = 0 ns) colored green and red (bulk ions) or yellow and blue (surface ions), respectively, at a) t = 0, b) 0.03 ns, c) 3 ns, d) 30 ns, e) 100 ns and f)150 ns.
During the last sintering stage (t = 30 ns, Fig. 3d), the two particles have transformed into an oval structured particle. The concave region between nanoparticles has been filled completely by initial surface Ti/O ions during sintering by surface diffusion. In addition, the initial surface ions forming a yellow/blue boundary or zone between coalescing particles (Fig. 3b) have moved away into the initially concave region between particles (Fig. 3e), partially contributing to neck growth during sintering by grain boundary diffusion. Most of the Ti/O ions initially in the core of the nanoparticles are still recognizable and these cores have been deformed slightly by plastic flow43.
Finally at t = 150 ns (Fig. 3f), the particles have fully coalesced into a compact, spherical-like structure. The layer of yellow/blue surface ions at the initial outer edges of the 2-nanoparticles has become very thin or even disappeared at some places (filled arrows). In the core of the fully coalesced particle, there are still two regions of only green/red ions indicating that during sintering the core Ti/O ions experience little net movement. The surface ions in-between the original nanoparticles (Fig. 3b) have been “squeezed” out (no yellow Ti there) into the formerly concave space between the initial particles (open arrows). More green/red bulk ions have emerged to the surface (filled arrows) as the initial surface ions (yellow/blue) have diffused towards the neck region. These green/red ions have increased mobility upon reaching the surface and spread all over it and even on top of the neck region. It is worth noting, however, that mostly red (oxygen) ions are there rather than green (titanium) consistent with the higher mobility of O than Ti ions44.
These results reveal that sintering of TiO2 nanoparticles is caused mainly by mobile surface ions while bulk ones remain largely in their place. Surface diffusion appears to be the dominant mechanism during TiO2 sintering at these particle sizes and temperatures, in agreement with literature21,45,46. This is not unreasonable given the high mobility of nanoparticle surface ions, a signature property of nanomaterials. It should be noted, however, that part of sintering takes place also by grain boundary diffusion; a mechanism that should become more important with increasing particle size and number of grains especially in compacted nanoparticle structures with limited free surface.
3.3 Influence of initial primary particle diameter and process temperature
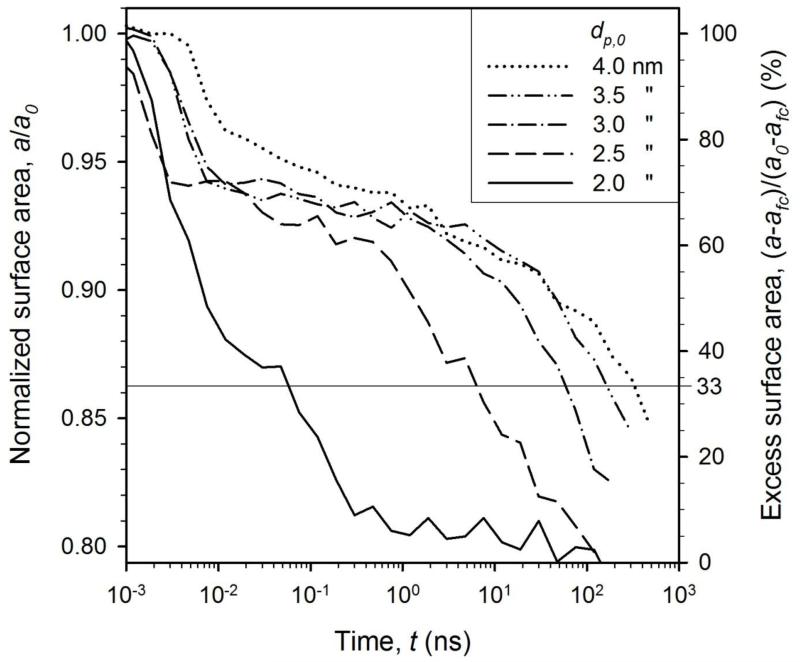
Figure 4 shows the evolution of normalized surface area of two particles at 1800 K with initial particle diameter of dp,0 = 2 (solid line), 2.5 (dashed), 3 (dash-dot), 3.5 (dash-double-dot) and 4 nm (dotted) as average of 4 simulations with different initial ion positions (supplementary Fig. SI2). For dp,0 = 2 nm (solid line) the surface area drops quickly by rapid coalescence as for two liquid droplets (supplementary Fig. SI1). Increasing the initial particle diameter leads to slower surface area reduction by neck growth (second sintering stage, Fig. 1) consistent with experimental observations12. The final coalescence stage seems to have a similar slope in the logarithmic time for particle diameters, in agreement with analytical models47. The characteristic sintering time, τ, is extracted after the excess surface area of the particles (over that of the fully coalesced ones, afc) has decreased by 67 % (right axis, horizontal line). This corresponds to a/a0 = 0.86 or a sintering neck diameter of 83 % of the initial primary particle diameter21.
Figure 4.
The evolution of total surface area of equally sized rutile particles with various initial diameters, dp,0, at 1800 K. The thin horizontal line where the excess surface area (right axis) has decreased by 67% defines the characteristic sintering time, τ, for each particle size.
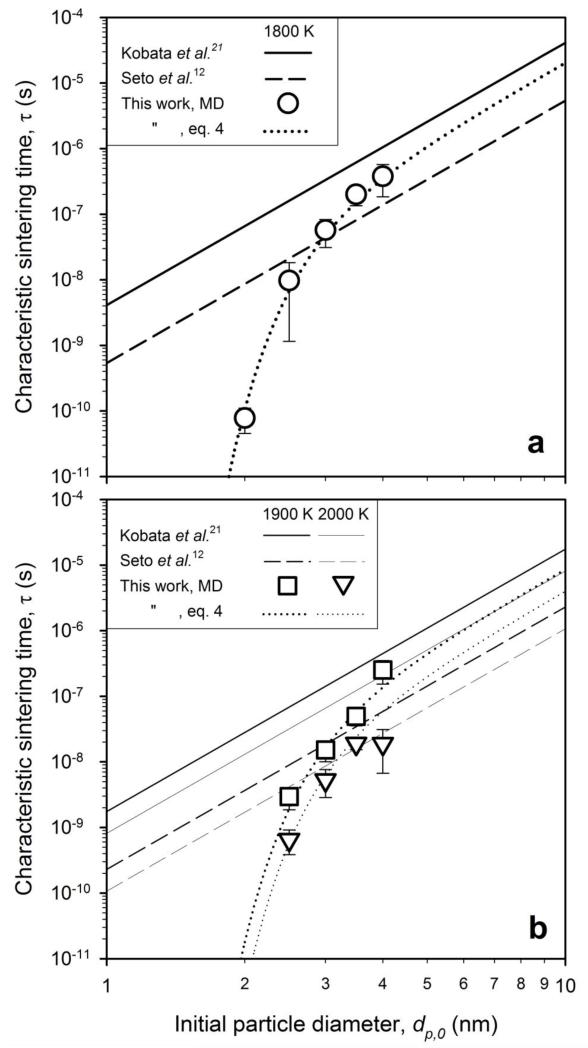
Figure 5 shows these τ (Fig. 4) obtained by MD simulations at a) 1800 K (circles) and b) 1900 K (squares) and 2000 K (triangles) along with that from equation (2) (solid lines) and equation (3) (dashed lines) as function of initial particle diameter dp,0 with decreasing line thickness for increasing temperature. For 1800 K and dp,0 < 3.5 nm (Fig. 5a), the τ calculated here by MD are significantly lower than those predicted by equations (2) and (3). Nevertheless with increasing initial size (dp,0 > 3.5 nm), the τ by MD asymptotically converge in-between those predicted by equations (2) and (3) that had been developed for larger particles (dp,0 > 10 nm) confirming that MD nicely reproduces these literature results. Higher temperatures (Fig. 5b) lead to faster sintering and shorter τ, again between those of equations (2) and (3). The dotted lines in Fig. 5 show a nonlinear fit to the MD data48:
| (4) |
with dp in (m), T in (K) and R in (J K−1 mol−1).
Figure 5.
The characteristic sintering time, τ, obtained from Fig. 4 along with that of Kobata et al.21 (solid lines) and Seto et al.12 (dashed lines) as function of initial primary particle diameter, dp,0, at a) T = 1800 K (circles) and b) 1900 K (squares) and 2000 K (triangles). The MD simulations are quantified by equation 4 (dotted line).
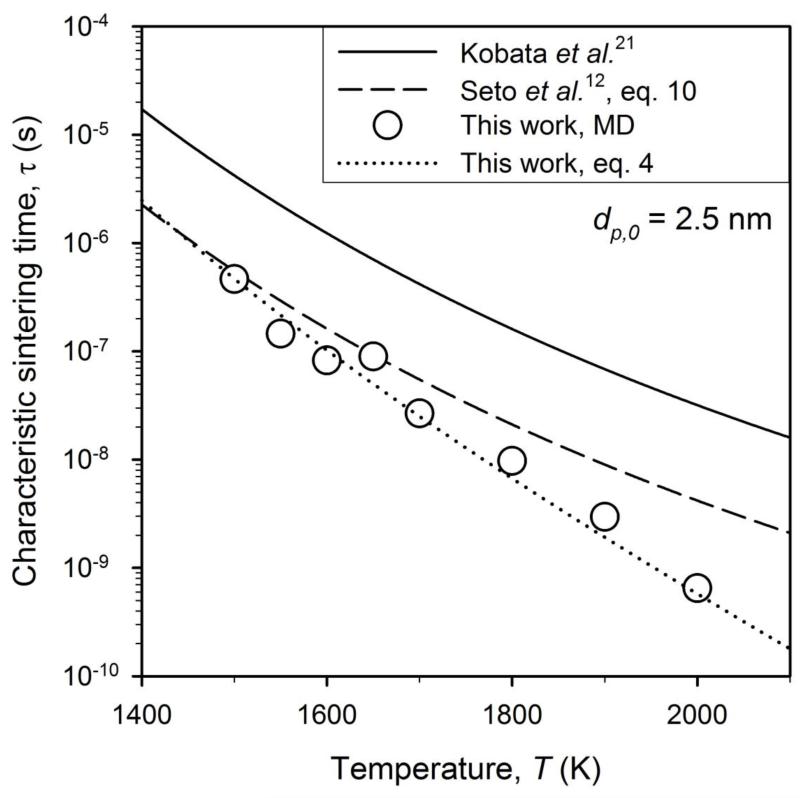
Figure 6 shows the τ (circles) obtained by MD (supplementary Fig. SI3) along with that of equations (2) (solid line) and (3) (dashed line) as function of temperature for dp,0 = 2.5 nm as well as the prediction of equations (4) (dotted line). The MD results, however, are for these conditions closer to those from equation (3) by Seto et al.12 and the deviation at higher temperatures is attributed to the approaching of the melting point of TiO2. The MD data in Fig. 6 (symbols) are matched well by equation (4) (dotted line). As the these data were not used to develop equation (4) as in Fig. 5, this indicates that this equation is able to predict the slower sintering rates (increasing τ) for decreasing temperature and could be used in design of processes for synthesis of small TiO2 nanoparticles. So when equation (4) is used in the common phenomenological model35 to describe the nanoparticle surface area during sintering with dp,0 = 3 nm and T=1800 K (Fig. 1: green broken line), this model comes much closer to the final MD predictions even though it does not closely follow the MD-evolution of surface area.
Figure 6.
The characteristic sintering time obtained by the present MD simulations (circles) along with those of equations 2 (solid line), 3 (dashed line) and 4 (dotted line) as function of temperature for dp,0 = 2.5 nm. Increasing the temperature leads to shorter characteristic sintering times and therefore faster sintering in agreement with experimental observations.
The shorter τ or faster sintering of smaller nanoparticles given by the MD-derived equation (4) is another manifestation of material properties being different in the nanoscale from the corresponding bulk ones. The higher percentage of surface ions in these particles from 10 nm down to 1 nm, is the most likely reason for their increased sintering rates shown in Fig. 5. This is in excellent agreement with Seto et al.12 who had concluded that nanoeffects on sintering must occur for dp smaller than 10 nm because no deviation was observed for larger particles. The present MD simulations reveal that indeed this happens for dp < 4 nm.
4. Conclusions
Molecular dynamics (MD) simulations elucidate the sintering of small (2 – 4 nm) rutile TiO2 nanoparticles to complete or full coalescence at 1500 – 2000 K. Ions on the particle surface exhibited higher net displacement than bulk ones revealing that surface diffusion is the dominant sintering mechanism of TiO2 nanoparticles. Sintering by grain boundary diffusion takes place to a lesser extent but should increase for larger nanoparticles or for compacted ones that limit the displacement of surface ions. This might explain conflicting literature on the dominance of surface or grain boundary diffusion during TiO2 sintering.
The sintering rate was determined quantitatively by monitoring the evolution of the surface area of two coalescing particles at various initial sizes. Lower temperatures or larger initial particle diameters led to longer sintering. For the smallest particle diameters, the MD-obtained sintering rates were smaller than that predicted by theory developed for larger particles. An expression for the sintering rate of rutile TiO2 nanoparticles has been extracted from MD. With increasing particle size and decreasing temperature, this expression converges nicely to the literature ones for sintering of larger particles. This MD-derived sintering rate facilitates the use of fundamentally-based phenomenological models in design of processes for large scale manufacture and processing of nanoparticles49.
Supplementary Material
Table 1.
The parameter of the classic pairwise potentials for TiO2 polymorphs16. The constant charges for titanium and oxygen are qTi = 2.196 and qO = −1.098.
| ion-ion | Aij [kcal/mol] | Bij [Å] | Cij [kcal Å6 mol−1] |
|---|---|---|---|
| Ti-Ti | 7.177×10⁵ | 0.154 | 1.210×10² |
| Ti-O | 3.911×10⁵ | 0.194 | 2.904×10² |
| O-O | 2.717×10⁵ | 0.234 | 6.969×10² |
Acknowledgements
Financial support from Swiss National Science Foundation (SNF) Grant # 200021-119946/1 and European Research Council is gratefully acknowledged.
Footnotes
Supporting Information Available: Surface area evolution for different initial particle orientations for dp,0 = 3 nm and T = 1800 K. Surface area evolution for dp,0 = 2.5 nm and T = 1500 – 1800 K. This material is available free of charge via the internet at http://pubs.acs.org.
References
- (1).Gratzel M. Nature. 2001;414:338. doi: 10.1038/35104607. [DOI] [PubMed] [Google Scholar]
- (2).Formenti M, Juillet F, Meriaudeau P, Teichner SJ, Vergnon P. J. Colloid Interface Sci. 1972;39:79. [Google Scholar]
- (3).Teleki A, Pratsinis SE, Kalyanasundaram K, Gouma PI. Sensor. Actuat. B-Chem. 2006;119:683. [Google Scholar]
- (4).Lademann J, Weigmann HJ, Schafer H, Muller G, Sterry W. Skin Pharmacol. Appl. 2000;13:258. doi: 10.1159/000029931. [DOI] [PubMed] [Google Scholar]
- (5).Yazdi AS, Guarda G, Riteau N, Drexler SK, Tardivel A, Couillin I, Tschopp J. Proc. Natl. Acad. Sci. 2010;107:19449. doi: 10.1073/pnas.1008155107. [DOI] [PMC free article] [PubMed] [Google Scholar]
- (6).Strobel R, Pratsinis SE. J. Mater. Chem. 2007;17:4743. [Google Scholar]
- (7).Xiong Y, Akhtar MK, Pratsinis SE. J. Aerosol Sci. 1993;24:301. [Google Scholar]
- (8).Johannessen T, Pratsinis SE, Livbjerg H. Powder Technol. 2001;118:242. [Google Scholar]
- (9).Xing Y, Rosner DE. J. Nanopart. Res. 1999;1:277. [Google Scholar]
- (10).Cho K, Biswas P. Aerosol Sci. Technol. 2006;40:309. [Google Scholar]
- (11).Muhlenweg H, Gutsch A, Schild A, Pratsinis SE. Chem. Eng. Sci. 2002;57:2305. [Google Scholar]
- (12).Seto T, Shimada M, Okuyama K. Aerosol Sci. Technol. 1995;23:183. [Google Scholar]
- (13).Zachariah MR, Carrier MJ. J. Aerosol Sci. 1999;30:1139. [Google Scholar]
- (14).Arcidiacono S, Bieri NR, Poulikakos D, Grigoropoulos CP. Int. J. Multiphas. Flow. 2004;30:979. [Google Scholar]
- (15).Collins DR, Smith W, Harrison NM, Forester TR. J. Mater. Chem. 1997;7:2543. [Google Scholar]
- (16).Matsui M, Akaogi M. Mol. Simulat. 1991;6:239. [Google Scholar]
- (17).Koparde VN, Cummings PT. J. Phys. Chem. B. 2005;109:24280. doi: 10.1021/jp054667p. [DOI] [PubMed] [Google Scholar]
- (18).Koparde VN, Cummings PT. J. Nanopart. Res. 2008;10:1169. [Google Scholar]
- (19).Koparde VN, Cummings PT. ACS Nano. 2008;2:1620. doi: 10.1021/nn800092m. [DOI] [PubMed] [Google Scholar]
- (20).Garland M, Le Grand S, Nickolls J, Anderson J, Hardwick J, Morton S, Phillips E, Yao Z, Volkov V. Micro IEEE. 2008;28:13. [Google Scholar]
- (21).Kobata A, Kusakabe K, Morooka S. AIChE J. 1991;37:347. [Google Scholar]
- (22).Collins DR, Smith W, Harrison NM, Forester TR. J. Mater. Chem. 1996;6:1385. [Google Scholar]
- (23).Bandura AV, Kubicki JD. J. Phys. Chem. B. 2003;107:11072. [Google Scholar]
- (24).Thomas BS, Marks NA, Begg BD. Phys. Rev. B. 2004;69:144122. [Google Scholar]
- (25).Hamad S, Catlow CRA, Woodley SM, Lago S, Mejías JA. J. Phys. Chem. B. 2005;109:15741. doi: 10.1021/jp0521914. [DOI] [PubMed] [Google Scholar]
- (26).Abrahams SC, Bernstein JL. J. Chem. Phys. 1971;55:3206. [Google Scholar]
- (27).Sanner MF, Olson AJ, Spehner JC. Biopolymers. 1996;38:305. doi: 10.1002/(SICI)1097-0282(199603)38:3%3C305::AID-BIP4%3E3.0.CO;2-Y. [DOI] [PubMed] [Google Scholar]
- (28).Bondi A. J. Am. Ceram. Soc. 1964;68:441. [Google Scholar]
- (29).Brunauer S, Emmett PH, Teller E. J. Am. Ceram. Soc. 1938;60:309. [Google Scholar]
- (30).Friedrichs MS, Eastman P, Vaidyanathan V, Houston M, Legrand S, Beberg AL, Ensign DL, Bruns CM, Pande VS. J. Comput. Chem. 2009;30:864. doi: 10.1002/jcc.21209. [DOI] [PMC free article] [PubMed] [Google Scholar]
- (31).Hess B, Kutzner C, van der Spoel D, Lindahl E. J. Chem. Theory Comput. 2008;4:435. doi: 10.1021/ct700301q. [DOI] [PubMed] [Google Scholar]
- (32).Anderson JA, Lorenz CD, Travesset A. J. Comput. Phys. 2008;227:5342. [Google Scholar]
- (33).CUDA. Version 2.3 Programming Guide. 2009 [Google Scholar]
- (34).Plimpton S. J. Comput. Phys. 1995;117:1. [Google Scholar]
- (35).Koch W, Friedlander SK. J. Colloid Interface Sci. 1990;140:419. [Google Scholar]
- (36).Xiong Y, Pratsinis SE. J. Aerosol Sci. 1993;24:283. [Google Scholar]
- (37).Nichols FA, Mullins WW. J. Appl. Phys. 1965;36:1826. [Google Scholar]
- (38).Iijima S, Ajayan PM. J. Appl. Phys. 1991;70:5138. [Google Scholar]
- (39).Barnard AS. Rep. Prog. Phys. 2010;73:086502. [Google Scholar]
- (40).Ashby MF. Acta Metall. 1974;22:275. [Google Scholar]
- (41).Garabedian RS, Helble JJ. J. Colloid Interf. Sci. 2001;234:248. doi: 10.1006/jcis.2000.7297. [DOI] [PubMed] [Google Scholar]
- (42).Lümmen N, Kraska T. Phys. Rev. B. 2005;71:205403. [Google Scholar]
- (43).Frenkel J. J. Phys. (Moscow) 1945;9:385. [Google Scholar]
- (44).Kingery WD, Bowen HK, Uhlmann DR. Introduction to ceramics. 2nd edition Chapman Wiley; New York, NY: 1976. [Google Scholar]
- (45).Bonevich JE, Marks LD. J. Mater. Res. 1992;7:1489. [Google Scholar]
- (46).Kusunoki M, Yonemitsu K, Sasaki Y, Kubo Y. J. Am. Ceram. Soc. 1993;76:763. [Google Scholar]
- (47).Friedlander SK, Wu MK. Phys. Rev. B. 1994;49:3622. doi: 10.1103/physrevb.49.3622. [DOI] [PubMed] [Google Scholar]
- (48).SAS . The nonlinear analysis for this paper was generated by the SAS software, Version 9.2 of the SAS System. Copyright © 2011 SAS Institute Inc. SAS and all other SAS Institute Inc. product or service names are registered trademarks or trademarks of SAS Institute Inc.; Cary, NC, USA: 2011. [Google Scholar]
- (49).Pratsinis SE. AIChE J. 2010;56:3028. [Google Scholar]
Associated Data
This section collects any data citations, data availability statements, or supplementary materials included in this article.


