Abstract
Core-shell particles preserve the bulk properties (e.g. magnetic, optical) of the core while its surface is modified by a shell material. Continuous aerosol coating of core TiO2 nanoparticles with nanothin silicon dioxide shells by jet injection of hexamethyldisiloxane precursor vapor downstream of titania particle formation is elucidated by combining computational fluid and aerosol dynamics. The effect of inlet coating vapor concentration and mixing intensity on product shell thickness distribution is presented. Rapid mixing of the core aerosol with the shell precursor vapor facilitates efficient synthesis of hermetically coated core-shell nanoparticles. The predicted extent of hermetic coating shells is compared to the measured photocatalytic oxidation of isopropanol by such particles as hermetic SiO2 shells prevent the photocatalytic activity of titania. Finally the performance of a simpler, plug-flow coating model is assessed by comparisons to the present detailed CFD model in terms of coating efficiency and silica average shell thickness and texture.
Keywords: silicon dioxide, encapsulation, layering, photodegradation, photooxidation
Introduction
Core-shell particles facilitate incorporation of functional particles into host (e.g. liquid or polymer) matrices: silica-coated TiO2 pigments1 and superparamagnetic2 Fe2O3, alumina-coated3 oxidation resistant Ni, non-toxic plasmonic4 Ag and carbon-coated Cu for sensors5. Typically core-shell particles are made in the liquid phase6 but there is keen interest to develop gas-phase or aerosol coating processes that do not generate liquid by-products, offer fewer process steps, easier particle collection and hermetic2 shells. Coating of particles in the gas phase, however, is challenging, as particle motion and growth are much faster than in liquids. As a result, it is difficult to control and develop a scalable gas phase coating process. So, even commercially produced particles made by aerosol routes (e.g. pigmentary TiO2 made by the “chloride” process1) are coated by wet processes.6
Coating of TiO2 nanoparticles with SiO2 shells in the gas phase has been investigated experimentally in laboratory aerosol reactors: counter-flow diffusion burner7, hot-wall8-10, quenched flames11, atomic layer deposition12, co-flow diffusion flame13 and spray flames14. Very little however has been done with respect to design aerosol processes for synthesis of coated nanoparticles. There are one-dimensional models for flame-aerosol coating of fibers by smooth and rough silica films15, titania nanoparticles by silica films in hot wall16 and flame aerosol reactors17. Almost nothing has been done for developing comprehensive aerosol reactor models combining fluid and particle dynamics for synthesis of coated aerosol particles even though there are plenty of CFD-aerosol models for uncoated Al2O318, SiO219, TiO220-25, and Al26 nanoparticles. Recently Teleki et al.27 showed that improving the mixing between core aerosol and coating precursor vapor increases the fraction of coated core particles and quality of coating, experimentally and by CFD, but without accounting for the ensuing particle dynamics.
Here, gas-phase (aerosol) coating is elucidated in considerable detail, for the first time to our knowledge, by computational fluid and particle dynamics for core particles (TiO2) and coating shells (SiO2). Emphasis is placed on understanding the influence of process variables (weight fraction of coating shells and jet intensity for mixing of core aerosol & shell precursor vapor) on core-shell product characteristics (coating efficiency, shell thickness and texture) by a trimodal aerosol model17 accounting for SiO2 monomer generation, coagulation and sintering. The predicted extent of complete (or hermetic) coating shells is compared to the measured photocatalytic oxidation of isopropanol by such particles14,27 and release of acetone. As hermetic SiO2 shells prevent the photocatalytic activity of TiO2, the performance of coated particles is explained by the spatial distribution of shell thickness on core particles by detailed reactor flow field analysis. Finally the performance of a simpler coating model17 is assessed by comparisons to the present detailed CFD model.
Theory
Computational Fluid Dynamics
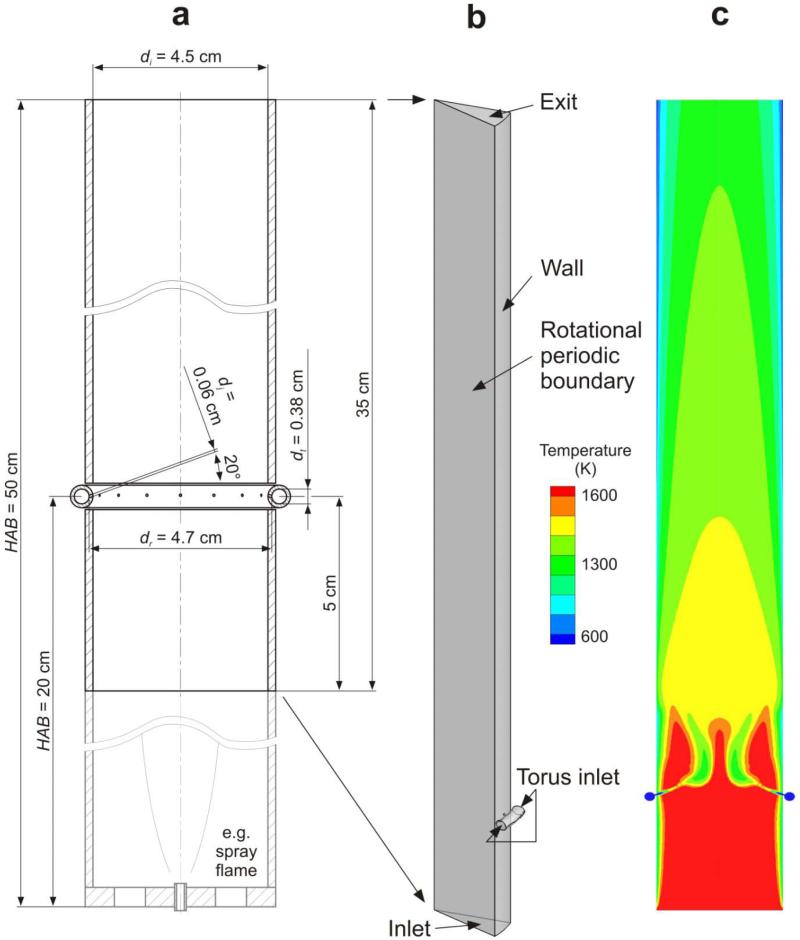
The aerosol coating reactor (Fig. 1a, black lines) simulated here consists of a vertical quartz glass tube with diameter di = 4.5 cm and length 35 cm. A torus tube (dt = 0.38 cm) ring (dr = 4.7 cm) is positioned at HAB = 20 cm corresponding to the reactor of Teleki et al.14 (Fig. 1a, black and grey lines) producing core-shell TiO2-SiO2 nanoparticles up to about 36 g/h. The coating section of the reactor (HAB = 15 – 50 cm) has been split axially into 1/16 of its perimeter (22.5°) to take advantage of its rotational periodicity and is shown magnified in Figure 1b. This volume was discretized with an unstructured mesh consisting mainly of tetrahedral elements. The mesh has been generated with the CFX-Mesh 12.0.1 algorithm with a maximum body spacing of 1 mm and minimum/maximum surface spacing of 0.1/1 mm, respectively. Two line controls have been incorporated to refine the mesh at the jet inlet and along the reactor axis. The mesh generation accounted for periodic boundary conditions and inflation layers have been included on all wall boundaries with an expansion factor of 1.2 on 5 layers and a maximum thickness of 2 mm. The final mesh contains 101′282 nodes.
Figure 1.
a) Schematic of aerosol coating reactor and torus inlet of the coating precursor (HMDSO) at height above the burner (HAB) of 20 cm. b) By accounting for periodicity, 1/16 (22.5° of the perimeter) of the reactor volume was discretized by the CFD grid. c) Temperature field on the plane across the reactor axis, showing the hot core TiO2 aerosol entering the reactor at the bottom (red) and the cool HMDSO/N2 vapor jet from the torus ring (blue).
The velocity inlet boundary “Inlet” is 5 cm below the torus ring where the core aerosol enters with parabolic velocity and concentration profiles (Fig. 1b). The maximum velocity is 7.1 m/s and the core aerosol concentrations corresponds to a production rate of 24 g/h with a primary particle diameter of 40 nm, consistent with experimental conditions.27 The inlet velocity boundary “Torus” has a velocity of 0.72 m/s and a coating precursor concentration of 0.046 mol/kg for total hexamethyldisiloxane (HMDSO)/N2 flow rate Q = 15.8 l/min and SiO2 coating weight fraction WF = 20 wt% of the product core-shell TiO2-SiO2 nanoparticles. The 15.8 l/min is the sum of 0.8 l/min N2 saturated with HMDSO vapor and 15 l/min N2 to increase the mixing intensity between HMDSO vapor core TiO2 aerosol.14 Both flows are mixed before entering the torus ring pipe at 20° C. The torus ring is connected with the reactor tube by 16 openings with dj = 0.06 cm for HMDSO/N2 jets pointing 10° away from the reactor tube axis and 20° in downstream direction. This configuration induces a swirling aerosol motion in the coating zone above the torus ring and helps to prevent stagnation in the core particle production zone upstream of the torus ring. The “Exit” boundary is defined as outflow type and all other surfaces of the reactor and torus tube are included to the wall type boundary “Wall”. The tube wall is made of quartz glass with a density of 2201 kg m−3, specific heat capacity 1150 J kg−1 K−1 and constant thermal conductivity of 2.5 W m−1 K−1.
The gas flows at the “Inlet” and “Torus” have the properties of oxygen and nitrogen, respectively. The thermal conductivity (a1 = −4.0056e-4, a2 = 1.0043e-4, a3 = −4.1646e-8, a4 = 1.9678e-11, a5 = −5.1112e-15 and a6 = 5.3313e-19) and viscosity (a1 = 1.8161e-6, a2 = 7.0697e-4, a3 = −3.1683e-11, a4 = 9.8833e-15 and a5 = −1.2194e-18) of the gas mixture in the reactor is described by polynomials based on the properties of oxygen28 which is the most abundant species in the reactor.27
The simulations have been done with the Ansys 12.1.4 software package29 in parallel on a PC with 8 cores. The equations were solved with second order discretization with the FLUENT pressure-based 3D solver and Green-Gauss Node based gradient option. The SIMPLEC method has been used for the Pressure-Velocity coupling with a skewness correction number of 1. Turbulence has been described with the Reynolds stress model with linear pressure-strain. Gravity has been included with g = 9.81 m s−2 in the axial direction.
Particle dynamics
The TiO2 core particle dynamics have been simulated with the monodisperse model of Kruis et al.30 resulting in core particle number, area and volume concentrations, Nc, Ac and Vc, respectively. Monodisperse particle dynamics are justified by the rapid attainment of self-preserving distributions by coagulation at the employed high aerosol concentrations. The coating particle and shell dynamics have been described in terms of HMDSO, SiO2 monomer number and particle number, area and volume concentrations, C, Ns1, Ns2, As2 and Vs2, respectively.17 The oxidation rate of HMDSO has been described with an Arrhenius reaction rate.31 These equations have been implemented as source terms for the user defined scalars29 (UDS) accounting for the influence of gas density. The wall boundary conditions for the UDS had a constant value of 0, which describes wall deposition of aerosols by Brownian diffusion. Sintering of SiO2 coating particles and shells and TiO2 core particles has been described with the characteristic sintering times of Tsantilis et al.32 and Kobata et al.33, respectively. The fractal dimension of the SiO2 and TiO2 agglomerates was set to34 Df = 1.8.
The efficiency of the coating process is defined as the fraction of HMDSO vapor ending on the surface of core particles. Coagulation of core TiO2 particles with SiO2 monomers and particles leads to smooth and rough coating shells, respectively. The volume ratio of them was defined as the fraction of smooth coating shells.17 Some of the initially rough shells were smoothed out by sintering to lamellae15,17 along the coating reactor.
Results and Discussion
Temperature field
Figure 1c shows the temperature field for 15.8 l/min total mixing flow rate through the torus ring consistent with experimental measurements.27 The core particle aerosol enters at high temperature (red) at the bottom of the reactor and is mixed with coating precursor gas mixture entering from the torus ring (HAB = 20 cm) in swirling flow at room temperature (blue). That way the core particle aerosol is cooled and the formation of “dead” volume or recirculation upstream of the torus ring is prevented.
Aerosol mixing and coating precursor reaction
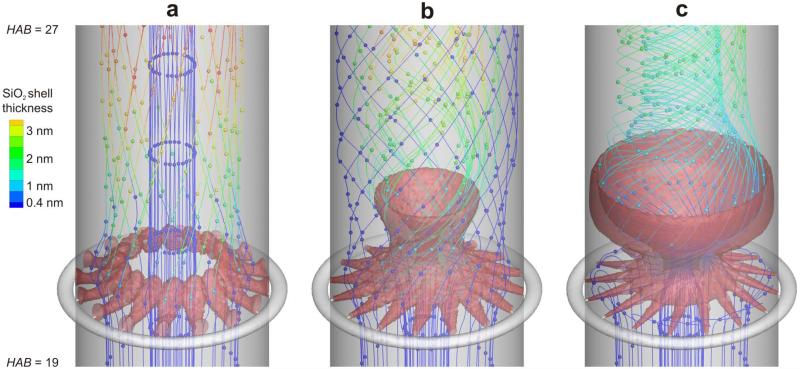
Figure 2 shows streamlines of the core particle aerosol flow at HAB = 19 – 27 cm for HMDSO/N2 total flow rate, Q, of a) 5.8, b) 15.8 and c) 30.8 l/min through the torus ring. The color of each streamline shows the SiO2 shell thickness evolution on the core particles where blue indicates uncoated TiO2 core particles. The red iso-surfaces (Fig. 2) correspond to 1% (a-b) and 10% (c) of the initial HMDSO concentration in the torus ring. One can see for example how blue streamlines below the torus ring change to green as they pass through the red HMDSO “cloud” so-to-speak. The distance between the beads on each streamline corresponds to a constant time interval Δt = 0.005 s. Beads on the same streamline which are close together indicate low flow velocities, larger bead distances indicate higher gas velocities. The grey shading represents the vertical tubular wall of the reactor and the torus ring with its 16 jet openings.
Figure 2.
Evolution of silica shell thickness on core TiO2 aerosol from oxidation of HMDSO vapor injected by the 16 jets (red) with total flow rate, Q, of a) 5.8, b) 15.8 and c) 30.8 l/min through the torus ring. The color of each streamline carrying TiO2 particles shows the shell thickness on these particles where dark blue indicates uncoated TiO2. The red iso-surfaces correspond to of 1% of the initial HMDSO concentration in the torus ring. The distance between the beads on each streamline corresponds to a time interval Δt = 0.005 s. Increasing the mixing intensity leads to better coating shells. In c) all streamlines go through the HMDSO (red) zones resulting in full-coating of TiO2 by SiO2 at thicknesses of 1 – 4 nm (no dark blue streamlines).
For low mixing intensity, Q = 5.8 l/min (Fig. 2a), the 16 HMDSO/N2 jets (red) do not penetrate the core aerosol at the reactor center axis and are even “bent” upwards in the downstream direction. Core particles are coated near the wall region where streamlines go through the “red” HMDSO jets and become “green”, indicating a shell thickness of around 3 nm. The blue streamlines in the center of the reactor pass without deposition of any shells, indicating a shell thickness below 0.4 nm. Adjacent streamlines start to turn to the right after passing the HMDSO/N2 jets but make only a quarter turn until the reactor exit as the swirl speed induced by the mixing jets is quite low.
For Q = 15.8 l/min (Fig. 2b), the HMDSO vapor reaches closer to the reactor center by the higher jet inlet velocity. Most of the core aerosol streamlines are focused to the center of the reactor by the swirling flow. These core particles get coated with an even shell thickness (2 nm, light green). There are few streamlines that bypass the torus ring by flowing in-between the jets near the reactor wall region without any coating shells on them (blue). The swirl is not strong or large enough to capture these streamlines after the torus ring before the entire coating SiO2 particles have been deposited onto the core particles or the reactor walls.
For high mixing intensity of Q = 30.8 l/min (Fig. 2c), however, the mixing jets reach the reactor center and even carry the shell precursor vapor (HMDSO) close to the wall on the opposite side of the reactor. The streamlines flowing in-between the jets are drawn to the center by the strong swirl that expands close to the reactor wall shortly after the torus ring. The still available HMDSO vapor and coating SiO2 particles lead to a relatively even shell thickness distribution (light blue to green) on all core aerosol streamlines.
Coating dynamics
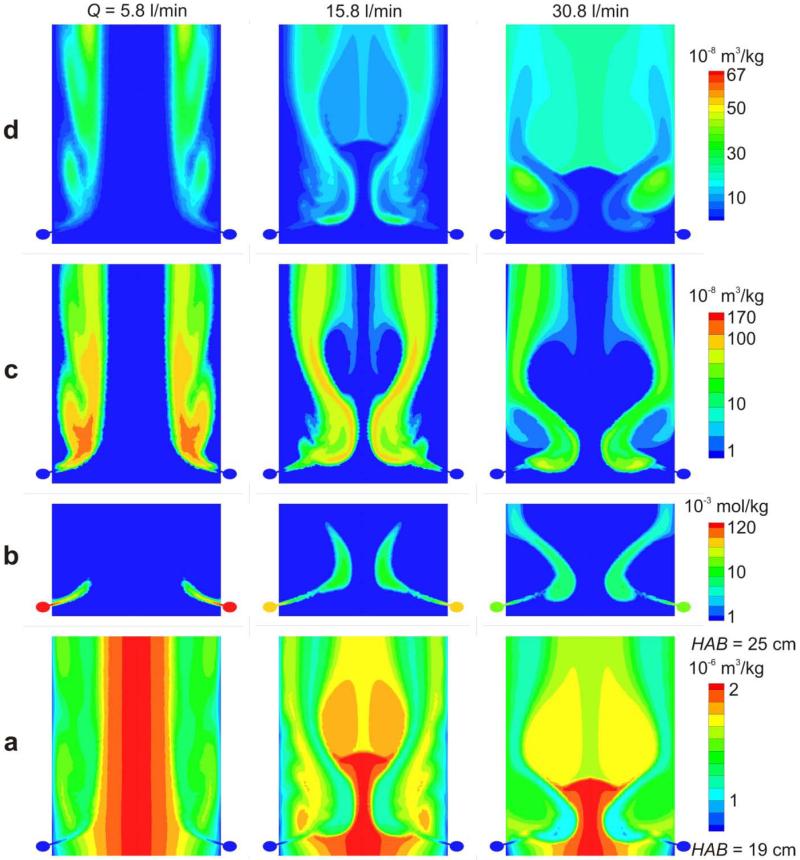
Figure 3 shows in rows from bottom to top the concentration of a) core particle volume (m3/kg), b) coating precursor (mol/kg), c) particle volume (m3/kg) and d) total shell (smooth and rough) volume (m3/kg) on the axial reactor plane passing through two opposite mixing jet inlets at HAB = 19 - 25 cm for Q = 5.8 (left column), 15.8 (middle column) and 30.8 l/min (right column) HMDSO/N2 through the ring at HAB = 20 cm. The core aerosol flow direction is from bottom to top. The legends connecting color with concentrations are shown at the right hand side for each row.
Figure 3.
Contour plots between HAB = 19 – 25 cm of the concentration of a) core (TiO2) particle volume, b) coating precursor vapor (HMDSO), c) coating SiO2 particle volume and d) coating (SiO2) shell volume per unit mass of gas on the plane through the inlet of two mixing jets and the reactor axis for HMDSO/N2 flow rate through the torus ring at HAB = 20 cm of Q = 5.8 (left column), 15.8 (middle column) and 30.8 l/min (right column).
The core particle volume concentration, Vc, (Fig. 3a) reaches the torus ring with the highest concentration (red) on the reactor axis with the same distribution for all mixing flow rates as the mixing jets do not influence their upstream dynamics. For low intensity mixing (5.8 l/min, left column) the HMDSO/N2 jets are not able to penetrate the core particle aerosol far enough. As a result, a large fraction of the core particles passes through the torus ring without mixing with the HMDSO vapor or product SiO2 particles. For 15.8 l/min (middle column) the core particle concentration profile changes quite strongly at the torus ring as the jets reach close to the reactor axis. For high intensity mixing (30.8 l/min, right column), the mixing jets are strong enough to tear apart the core particle concentration profile and lead to a more uniform core-shell particle distribution along the reactor cross section soon after the torus ring (HAB = 25 cm).
Figure 3b shows the concentration of the coating precursor, C. The mixing jets are carrying the HMDSO vapor which forms two SiO2-monomers by oxidation per HMDSO molecule. The HMDSO concentration is highest inside the torus ring where no oxidation takes place as only nitrogen is present. After injection into the reactor, the concentration decreases by oxidation and dilution by mixing with the core aerosol. The initial concentration is the highest for 5.8 l/min (red) and the lowest for 30.8 l/min (light blue) as all cases have the same amount of SiO2 in the product particles (WF = 20 wt%) but different N2 flow rates. It can be seen that for 5.8 l/min the weak mixing jets are not reaching very far into the reactor and are even bent upwards (in the downstream direction) close to the wall region, because of their low inlet velocity (Fig. 2a). Also because of this low flow rate, the mixing jet is heated up faster and HMDSO oxidation takes place more rapidly leading to a quicker consumption of HMDSO. For 15.8 l/min the HMDSO reaches closer to the reactor axis. For 30.8 l/min, the HMDSO, transported by the faster jets crosses the reactor center, reaches nearly the wall on the other side of the reactor, and reacts slower by the increased cooling induced by the larger mixing N2 flow rate.
The volume concentration of coating SiO2 particles, Vs2, is shown in Figure 3c. Inside the reactor, the HMDSO is oxidized forming SiO2 coating monomers which grow by coagulation to SiO2 coating particles. At all flow rates, the concentration of SiO2 particles first increases by coagulation of the SiO2 monomers and later decreases by coagulation with TiO2 core particles forming SiO2 shells on their surface as well as by coagulation with other SiO2 particles and dilution by further mixing with the core aerosol. While for Q = 5.8 l/min the coating SiO2 particles appear mainly near the reactor wall where also the HMDSO oxidation mostly took place, they appear near the reactor axis for Q = 15.8 l/min. At high mixing intensity (30.8 l/min) the coating particles are distributed across the entire reactor cross-section indicating a good mixing of the coating vapor/particles and core (Fig. 3a) aerosols.
Figure 3d shows contours of the total coating shell concentration, which is the volume of SiO2 deposited on the surface of TiO2 core particles. Coating shells are formed in regions where core particles and coating monomers/particles are simultaneously present. For Q = 5.8 l/min the coating particles are mainly near the reactor wall leading to high coating shell concentrations on low core particle concentrations (Fig. 3a) which should result in quite non-uniformly coated product particles (Fig. 2a, dark blue to green streamlines). For 15.8 l/min, the coating shell concentration spreads across the reactor but uncoated core aerosol flows near the reactor wall indicating limited uniformity of core-shell particles. For Q = 30.8 l/min the high intensity mixing of core and coating aerosols leads to exposure of all core aerosol streamlines to HMDSO/SiO2 resulting in a rather uniform distribution of coating shells across the reactor cross section at about HAB = 23 cm (all green) and quite possibly to well-coated TiO2 particles.
Shell thickness distribution
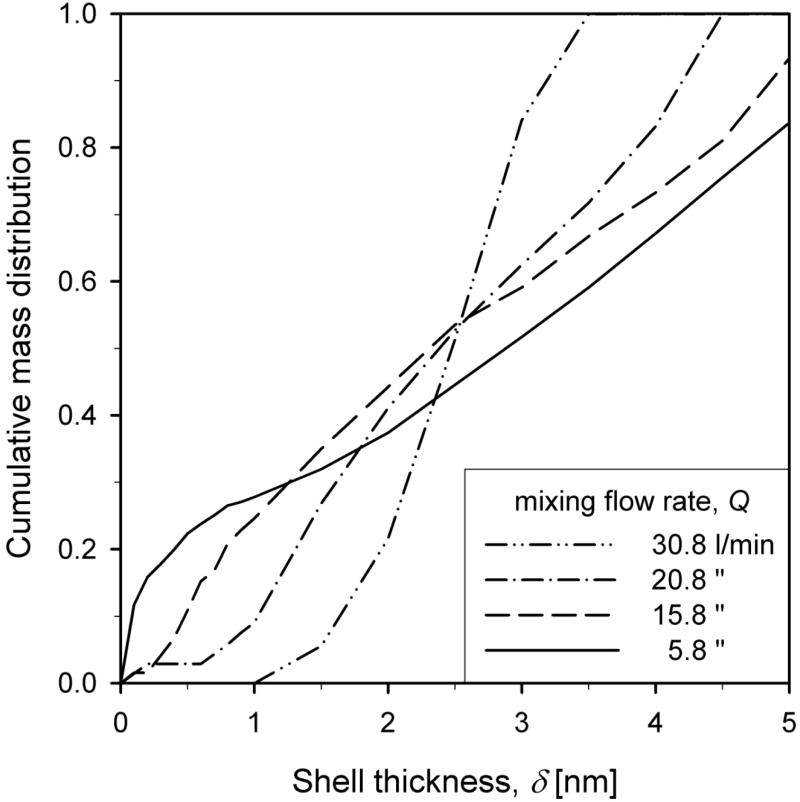
Figure 4 shows the cumulative shell thickness distribution for different total mixing flow rates Q = 5.8 (solid line), 15.8 (dashed line), 20.8 (dash-dot line) and 30.8 l/min (dash-double-dot line) at HAB = 50 cm for WF = 20 wt%. In this graph a vertical line would indicate that all core particles are coated with the same shell thickness. The lowest jet-aerosol mixing intensity (5.8 l/min) results in the broadest shell thickness, and even bi- or trimodal, distribution between 0 and 5 nm. Increasing the mixing intensity leads to a narrower shell thickness distribution on the core particles and more homogeneous coating characteristics in the product particles.
Figure 4.
The cumulative shell thickness distribution of product core-shell TiO2-SiO2 nanoparticles for total HMDSO/N2 flow rate Q = 5.8 (solid line), 15.8 (dashed line), 20.8 (dash-dot line) and 30.8 l/min (dash-double-dot line) for WF = 20 wt%. The lowest flow rate (5.8 l/min) results in the broadest shell thickness distribution (Fig. 2a). Increasing Q leads to a narrower and more uniform shell thickness distribution on the core particles and, as a result, a more homogeneous product.
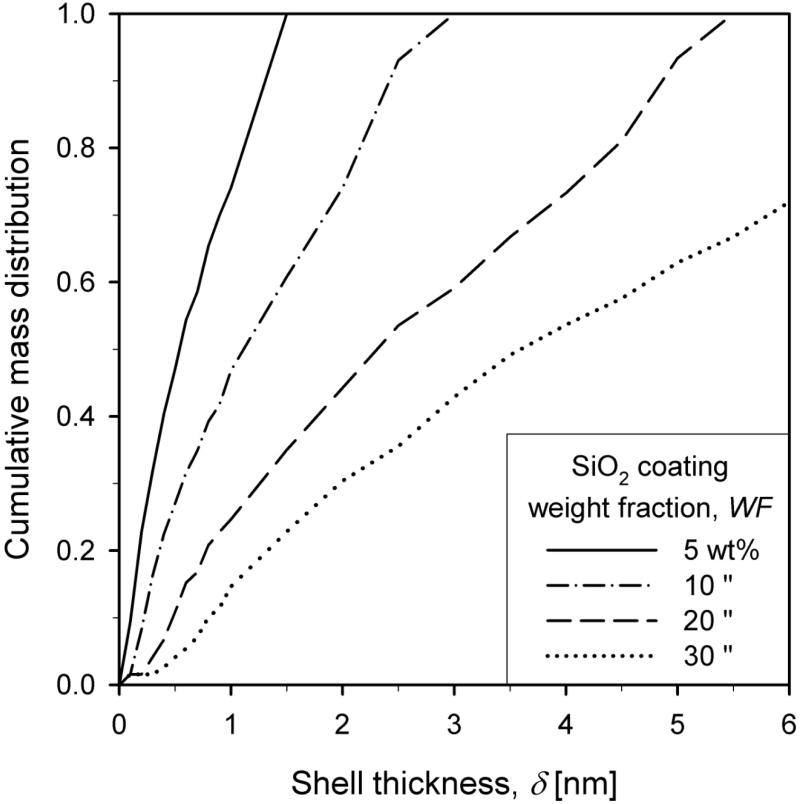
Figure 5 shows the cumulative mass thickness distribution for SiO2 coating weight fractions WF = 5 (solid line), 10 (dash-dot line), 20 (dashed line) and 30 wt% (dotted line) of the core-shell particles at HAB = 50 cm and Q = 15.8 l/min. Increasing the coating weight fraction leads to broader shell thickness distributions. For WF = 5 wt% the shell thickness distribution is the narrowest with values between 0 and 1 nm indicating a significant fraction of uncoated TiO2 particles (δ < 0.6 nm) in agreement with electron microscopy data.14 At WF = 20 wt% less than 10% of TiO2 particles is uncoated in good agreement with Teleki et al.14 Increasing WF leads to higher concentrations and larger primary particle diameters of SiO2 particles. This leads to a broader shell thickness distribution between 0 and 8 nm for WF = 30 wt%. This is in agreement with the experimental observations also by Hung and Katz7 or Powell et al.9,35 who found that higher coating precursor loadings led to broader distributions of shell thickness on the core particles.
Figure 5.
The cumulative shell thickness distribution for SiO2 coating weight fraction, WF, of 5 (solid line), 10 (dash-dot line), 20 (dashed line) and 30 wt% (dotted line) for Q = 15.8 l/min. Increasing WF leads to larger coating particles and subsequently to broader shell thickness distributions in the product core-shell TiO2-SiO2 particles.
Comparison with experimental data on photochemical activity
Silica coating of TiO2 is applied to prevent its photocatalytic activity in paints and polymer composites. So the photooxidation of isopropanol by TiO2 can be used as a quantitative measure of how complete or hermetic are the SiO2 shell on TiO2 particles. Assuming uniform TiO2 particle surfaces, their overall catalytic activity is proportional to their uncoated surface area. This can be quantified, for example, by measuring the acetone concentration formed by the photooxidation of isopropanol in aqueous suspensions of these particles.27
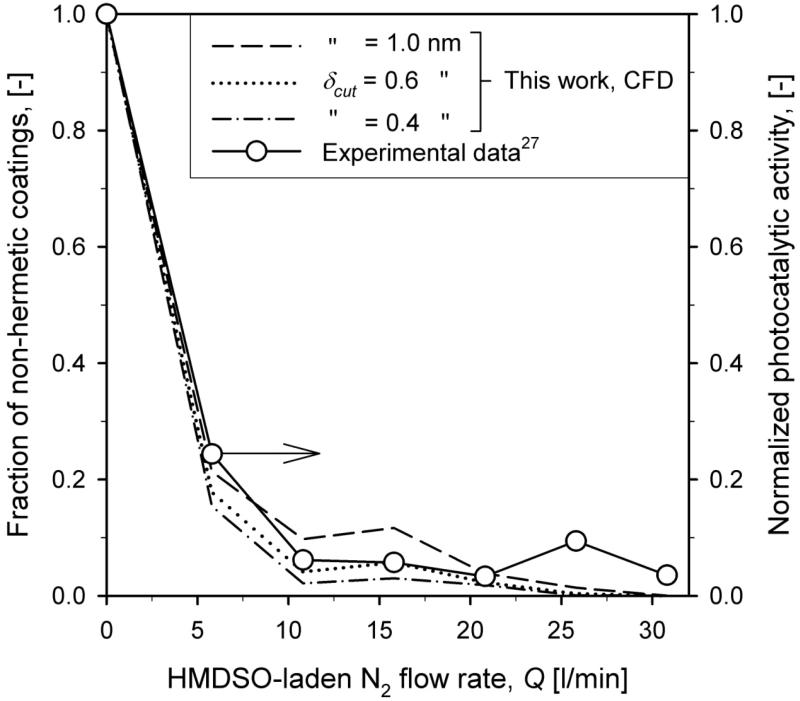
Figure 6 shows this normalized photocatalytic activity of SiO2-coated TiO2 particles (circles) of Teleki et al.27 as function of total N2 flow rate, Q, at the reactor exit at HAB = 50 cm for WF = 20 wt%. The simulated results are shown as the fraction of surface area of particles having a shell thickness less than a cut-off thickness δcut = 1.0 (dashed line), 0.6 (dotted line) and 0.4 nm (dash-dot line) corresponding to a bit more than a monomer layer of SiO2. For particles with a shell thickness less than δcut the uncoated surface area was accounted for proportionally with the ratio of its deposited coating volume to the coating volume it would need for δcut. The values of δcut might have to be adapted for different shell morphology (smooth vs. rough). Uncoated core TiO2 particles have a normalized photocatalytic activity of 1. Increasing Q decreases the fraction of non-hermetically coated particles in good agreement with experimental data.27 This sensitivity on δcut decreases for higher mixing flow rates and lower fraction non-hermetic coating shells. For Q = 5.8 l/min around 20% of the core particle surface is uncoated. These are core TiO2 particles that have flown through the center of the coating reactor (Fig. 2a). For Q = 15.8 l/min the fraction of uncoated particles is decreased by the stronger mixing jets, but still around 8% of the core particle surface is uncoated. Most of these uncoated particles have flown in-between the HMDSO/N2 jets (Fig. 2b). A higher HMDSO/N2 flow rate (30.8 l/min) leads to completely hermetic SiO2 shells on all particles and rather uniform shell thickness for all TiO2 particles (Fig. 4).
Figure 6.
Fraction of non-hermetically coated core particles predicted by the present model for various cut-off shell thicknesses of δcut = 1.0 (dashed line), 0.6 (dotted line) and 0.4 nm (dash-dot line) along with the measured normalized photocatalytic activity (circles) of isopropanol (IPA) slurries containing such particles as function of total HMDSO/N2 flow rate, Q at HAB = 50 cm for WF = 20 wt%. Increasing Q decreases the fraction of non-hermetically coated particles that could participate in the photooxidation of IPA and release of acetone in agreement with experimental data.27
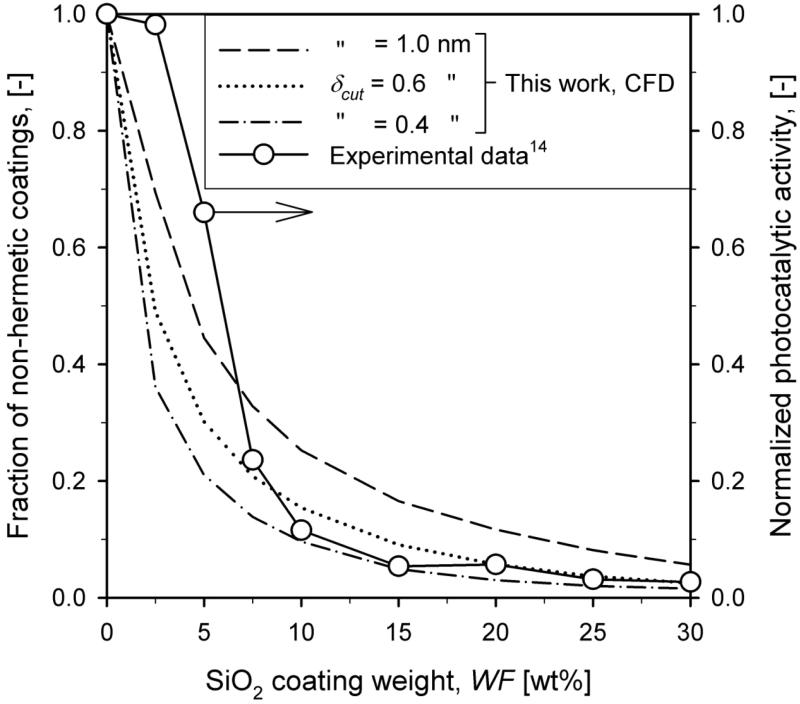
Figure 7 shows the fraction of non-hermetically coated core particles for δcut = 1.0 (dashed line), 0.6 (dotted line) and 0.4 nm (dash-dot line) and the measured normalized photocatalytic activity14 (circles) as function of SiO2 coating weight fraction at HAB = 50 cm for Q = 15.8 l/min. Increasing the coating weight fraction leads to thicker coating shells (Fig. 5), and decreases the fraction of non-hermetic coating shells. This trend is in agreement with experimental data14 especially for WF > 5 wt%. For 2.5 and 5 wt% there is some difference between simulations and experimental data which might be attributed to uncertainty on the HMDSO oxidation rate31 and/or early stage sintering of silica32 in the presence of titania particles.
Figure 7.
Fraction of non-hermetically coated core particles and the normalized photocatalytic activity (circles) as function of SiO2 coating weight fraction, WF, of the core-shell TiO2-SiO2 particles at HAB = 50 cm for Q = 15.8 l/min. Increasing WF leads to thicker coating shells, decreasing the fraction of non-hermetically coated particles. The sensitivity on δcut decreases for increasing WF.
Comparison of 1D and present CFD-interfaced coating model
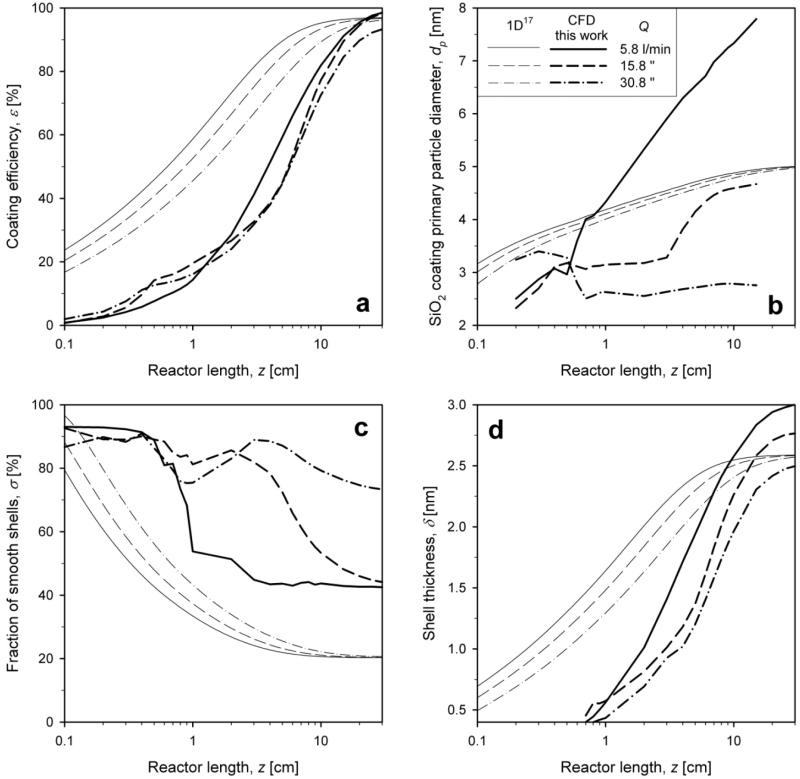
Figure 8 shows the axial evolution of a) coating efficiency and mixing-cup averages of b) coating primary particle diameter, c) fraction of smooth coatings and d) shell thickness along the reactor axis for 1D (thin lines)17 and present CFD-interfaced (bold lines) coating models for Q = 5.8 (solid line), 15.8 (dashed line) and 30.8 l/min (dash-dot line) for WF = 20 wt%. The dependence of all four variables on the mixing flow rate is in agreement between 1D and CFD. The simple (plug flow) 1D model predicts faster attainment of the final coating efficiency than the CFD model (Fig. 8a) as it assumes instantaneous perfect mixing of core aerosol and coating precursor vapor and therefore the deposition of coating shells starts earlier. Higher mixing flow rates lead to an increase of the coating efficiency further downstream as the mean axial gas velocity is higher and particle residence time shorter.
Figure 8.
Evolution of a) coating efficiency and mixing-cup averages of b) coating primary particle (SiO2) diameter, c) fraction of smooth shells and d) shell thickness as function of reactor length from the 1D (thin lines)17 and CFD (bold lines, this work) coating models for total HMDSO/N2 flow rate of Q = 5.8 (solid line), 15.8 (dashed line) and 30.8 l/min (dash-dot line) for WF = 20 wt%.
The SiO2 coating primary particle diameter increases steadily along the reactor length (Fig. 8b). Lower mixing flow rates lead to higher mixing-cup averages of the SiO2 primary particle diameter (Fig. 8a) as poor mixing with core aerosol leads to slower coating deposition rates and more time for SiO2 coating particle growth at higher temperatures. This spatial difference in SiO2 particle dynamics is lost by the 1D model resulting in no difference in particle dynamics among all mixing flow rates in stark contrast with the CFD model. This may not be, however, important as the emphasis of this process is hardly on SiO2 primary particle diameter but rather on the shell characteristics.
The fraction of smooth shells, σ, starts at initially 100% and decreases faster for lower Q because of the larger SiO2 particles formed at these conditions (Fig. 8c) as discussed in Fig. 2a. This is agreement with experimental observations8-9,27 of smoother and more hermetic shells at higher mixing intensities. The shell thickness (Fig. 8d) increases along the reactor axis, corresponding to the coating efficiency, at all flow rates with final values between 2 and 2.5 nm. For both of these coating characteristics the prediction of the 1D and CFD coating models are consistent though the 1D model underpredicts by 50% the final σ as it cannot account for the spatial inhomogeneity of temperature and HMDSO/SiO2 composition.
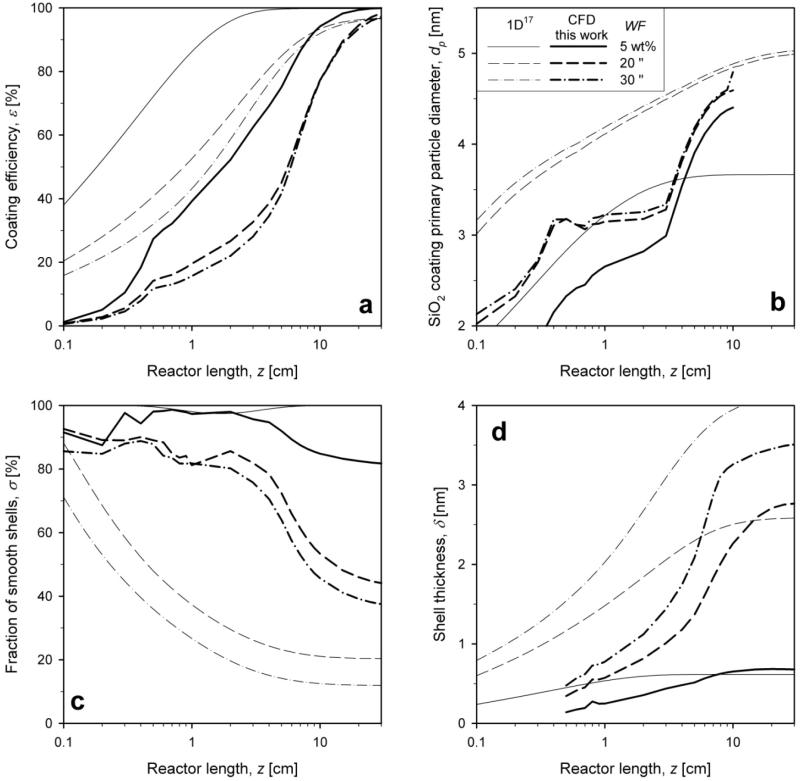
Figure 9 shows the evolution of coating characteristics as in Fig. 8 for SiO2 WF = 5 (solid line), 20 (dashed line) and 30 wt% (dash-dot line) at Q = 15.8 l/min. Increasing WF delays the attainment of the final coating efficiency (Fig. 9a), as higher concentrations of coating particles have to be deposited, but they converge to similar (nearly perfect) final values.
Figure 9.
Evolution of a) coating efficiency and mixing-cup averages of b) coating primary particle (SiO2) diameter, c) fraction of smooth shells and d) shell thickness as function of reactor length from the 1D (thin lines)17 and CFD (bold lines, this work) coating models for WF = 5 (solid line), 20 (dashed line) and 30 wt% (dash-dot line) for Q = 15.8 l/min.
Higher WF lead to faster SiO2 coating particle growth (Fig. 9b) by coagulation and sintering with mixing-cup averages of primary particle sizes between 4 and 5 nm for the CFD interfaced simulations that are finally quite close to the ones from the 1D model. Larger coating particles lead to rougher coating shells and therefore to lower fractions, σ, of smooth coating shells (Fig. 9c) for higher WF in agreement with pertinent experimental data.7,9,35 For the lowest WF = 5 wt% the present CFD-interfaced simulations also predict very smooth coating shells, in agreement with 1D simulations. At higher WF the 1D model underestimates the σ. The shell thickness increases accordingly to the coating efficiency (Fig. 9d) where higher WF leads to thicker coating shells.
The 1D and CFD-interfaced coating models show similar dependence on mixing flow rate and coating weight fraction. The difference between these two models is mainly the time needed for the calculations and the level of detail of the results especially at the early stages of the coating process. While the 1D simulations need seconds to minutes of calculation time, only weakly depending on reactor size, the CFD interfaced simulations require hours to days, strongly depending on reactor size and CFD mesh quality. The 1D coating model simulations are able to predict coating efficiency, shell thickness, coating particles sizes and to some extent fraction of smooth shells with mean values17 whereas the CFD interfaced coating model simulations presented here are able to give detailed insight into the escaping of uncoated core particles caused by reactor geometry and flow field. Furthermore it gives a measure of homogeneity of the product core-shell particles with distributions of shell thickness and the fraction of smooth shells that cannot be offered by the 1D model.
Conclusions
The dynamics of gas-phase coating of nanoparticles have been investigated by interfacing an aerosol coating model with computational fluid dynamics, for the first time to our knowledge. The model has elucidated deposition of nanothin SiO2 shells on TiO2 core particles by oxidation of hexamethyldisiloxane (HMDSO) vapor. As a result, the origin of non-hermetically coated or uncoated core particles for varying mixing intensities has been identified. For low mixing intensity (5.8 l/min) the mixing jets are not able to penetrate the core particle aerosol far enough and a large part of the core particle aerosol flows uncoated through the center of the coating zone in the reactor. For intermediate mixing intensity (15.8 l/min) a small part of the core particle aerosol is able to flow in-between the HMDSO/N2 mixing jets without being coated. For the high mixing intensity (30.8 l/min), however, the swirl in the coating zone is strong enough to capture also the core aerosol flow passing in-between the above jets leading to a uniform distribution of hermetic coating shells on the core particles with rather narrow thickness distribution.
The simulated silica shell thickness on titania particles was consistent with data from microscopic measurements at various inlet HMDSO concentrations. Most notably, increasing the SiO2 weight fraction or the jet mixing intensity leads to thicker and more hermetic shells as well as broader distributions of silica shell thickness. This progressively limits or blocks the photocatalytic activity of such core-shell titania-silica particles, in excellent agreement with experimental data of photooxidation of isopropanol with slurries of such particles.14,27
The comparison between 1D and CFD interfaced coating model simulations showed good agreement especially for coating efficiency and shell thickness and less for the fraction of smooth coating shells and SiO2 primary particle diameters at low HMDSO/N2 flow rates. The short simulation time from seconds up to few minutes for the 1D model makes it suitable for quick estimation of the behavior of aerosol coating reactors. The interface with CFD increases the calculation time but results in a higher level of detail of the aerosol coating process inside the reactor and the product properties.
The trimodal aerosol coating model17 is useful for the optimization and scale-up of aerosol coating reactors for the production of particles coated with nanometer thin shells. Furthermore interfacing it with CFD here allows reducing the gas consumption for the mixing flow by optimizing the number of torus rings and mixing jets, reactor size and geometry and leads to identification of dead-zones and recirculation inside of the reactor, which leads to better control of product uniformity and quality. Finally, optimized aerosol coating reactors produce hermetically coated core particles, avoiding post processing steps to remove the non-hermetically coated core and the not deposited coating particles, leading to possibly more economic manufacturing of coated nanoparticles.
Acknowledgements
Financial support from Swiss National Science Foundation (SNF) Grant # 200021-119946/1 and European Research Council are gratefully acknowledged.
References
- 1.Subramanian NS, Diemer RB, Gai PL, E. I. du Pont de Nemours and Company (Wilmington, DE, US) Process for making durable rutile titanium dioxide pigment by vapor phase deposition of surface treatment. US patent 200627303(A1) 2006
- 2.Teleki A, Suter M, Kidambi PR, Ergeneman O, Krumeich F, Nelson BJ, Pratsinis SE. Hermetically Coated Superparamagnetic Fe2O3 Particles with SiO2 Nanofilms. Chem. Mater. 2009;21(10):2094–2100. [Google Scholar]
- 3.Wank JR, George SM, Weimer AW. Coating Fine Nickel Particles with Al2O3 Utilizing an Atomic Layer Deposition-Fluidized Bed Reactor (ALD–FBR) J. Am. Ceram. Soc. 2004;87(4):762–765. [Google Scholar]
- 4.Sotiriou GA, Sannomiya T, Teleki A, Krumeich F, Vörös J, Pratsinis SE. Non-Toxic Dry-Coated Nanosilver for Plasmonic Biosensors. Adv. Funct. Mater. 2010 doi: 10.1002/adfm.201000985. n/a. doi: 10.1002/adfm.201000985. [DOI] [PMC free article] [PubMed] [Google Scholar]
- 5.Athanassiou EK, Grass RN, Stark WJ. Large-scale production of carbon-coated copper nanoparticles for sensor applications. Nanotechnology. 2006;17(6):1668–1673. doi: 10.1088/0957-4484/17/6/022. [DOI] [PubMed] [Google Scholar]
- 6.Egerton TA. The Modification of Fine Powders by Inorganic Coatings. KONA. 1998;16:46–59. [Google Scholar]
- 7.Hung CH, Katz JL. Formation of mixed-oxide powders in flames: Part I. TiO2-SiO2. J. Mater. Res. 1992;7(7):1861–1869. [Google Scholar]
- 8.Powell QH, Fotou GP, Kodas TT, Anderson BM. Synthesis of alumina- and alumina/silica-coated titania particles in an aerosol flow reactor. Chem. Mater. 1997;9(3):685–693. [Google Scholar]
- 9.Powell QH, Fotou GP, Kodas TT, Anderson BM, Guo YX. Gas-phase coating of TiO2 with SiO2 in a continuous flow hot-wall aerosol reactor. J. Mater. Res. 1997;12(2):552–559. [Google Scholar]
- 10.Akhtar MK, Pratsinis SE, Mastrangelo SVR. Dopants in Vapor-Phase Synthesis of Titania Powders. J. Am. Ceram. Soc. 1992;75(12):3408–3416. [Google Scholar]
- 11.Teleki A, Pratsinis SE, Wegner K, Jossen R, Krumeich F. Flame-coating of titania particles with silica. J. Mater. Res. 2005;20(5):1336–1347. [Google Scholar]
- 12.King DM, Liang X, Burton BB, Akhtar MK, Weimer AW. Passivation of pigment-grade TiO2 particles by nanothick atomic layer deposited SiO2 films. Nanotechnology. 2008;19(25):255604. doi: 10.1088/0957-4484/19/25/255604. [DOI] [PubMed] [Google Scholar]
- 13.Sheen S, Yang S, Jun K, Choi M. One-step flame method for the synthesis of coated composite nanoparticles. J. Nanopart. Res. 2009;11(7):1767–1775. [Google Scholar]
- 14.Teleki A, Heine MC, Krumeich F, Akhtar MK, Pratsinis SE. In-situ coating of flame-made TiO2 particles by nanothin SiO2 films. Langmuir. 2008;24(21):12553–12558. doi: 10.1021/la801630z. [DOI] [PubMed] [Google Scholar]
- 15.Fotou GP, Pratsinis SE, Baron PA. Coating of silica fibers by ultrafine particles in a flame reactor. Chem. Eng. Sci. 1994;49(10):1651–1662. [Google Scholar]
- 16.Jain S, Fotou GP, Kodas TT. A theoretical study on gas-phase coating of aerosol particles. J. Colloid Interf. Sci. 1997;185(1):26–38. doi: 10.1006/jcis.1996.4558. [DOI] [PubMed] [Google Scholar]
- 17.Buesser B, Pratsinis SE. Design of Aerosol Particle Coating: Thickness, Texture and Efficiency. Chem. Eng. Sci. 2010 doi: 10.1016/j.ces.2010.07.011. in Press, doi: 10.1016/j.ces.2010.07.011. [DOI] [PMC free article] [PubMed] [Google Scholar]
- 18.Johannessen T, Pratsinis SE, Livbjerg H. Computational fluid-particle dynamics for the flame synthesis of alumina particles. Chem. Eng. Sci. 2000;55(1):177–191. [Google Scholar]
- 19.Widiyastuti W, Purwanto A, Wang W-N, Iskandar F, Setyawan H, Okuyama K. Nanoparticle formation through solid-fed flame synthesis: Experiment and modeling. AIChE J. 2009;55(4):885–895. [Google Scholar]
- 20.Schild A, Gutsch A, Mühlenweg H, Pratsinis SE. Simulation of Nanoparticle Production in Premixed Aerosol Flow Reactors by Interfacing Fluid Mechanics and Particle Dynamics. 1999;1(2):305–315. [Google Scholar]
- 21.Johannessen T, Pratsinis SE, Livbjerg H. Computational analysis of coagulation and coalescence in the flame synthesis of titania particles. Powder Technol. 2001;118(3):242–250. [Google Scholar]
- 22.Wang G, Garrick SC. Modeling and simulation of titania formation and growth in temporal mixing layers. J. Aerosol Sci. 2006;37(4):431–451. [Google Scholar]
- 23.Yu M, Lin J, Chan T. Numerical simulation of nanoparticle synthesis in diffusion flame reactor. Powder Technol. 2008;181(1):9–20. [Google Scholar]
- 24.Zhao H, Liu X, Tse SD. Effects of pressure and precursor loading in the flame synthesis of titania nanoparticles. J. Aerosol Sci. 2009;40(11):919–937. [Google Scholar]
- 25.Manenti G, Masi M. Numerical investigation on new configurations for vapor-phase aerosol reactors. Chem. Eng. Sci. 2009;64(15):3525–3535. [Google Scholar]
- 26.Sohn HY, Perez-Fontes S, Choi JW. Computational fluid dynamic modeling of a chemical vapor synthesis process for aluminum nanopowder as a hydrogen storage precursor. Chem. Eng. J. 2010;156(1):215–225. [Google Scholar]
- 27.Teleki A, Buesser B, Heine MC, Krumeich F, Akhtar MK, Pratsinis SE. Role of Gas-Aerosol Mixing during in Situ Coating of Flame-Made Titania Particles. Ind. Eng. Chem. Res. 2009;48(1):85–92. [Google Scholar]
- 28.Design Institute for Physical Properties SbA. DIPPR Project 801 - Full Version: Design Institute for Physical Property Research/AIChE.
- 29.ANSYS . FLUENT 12.0 User’s Guide. 2009. [Google Scholar]
- 30.Kruis FE, Kusters KA, Pratsinis SE, Scarlett B. A simple-model for the evolution of the characteristics of aggregate particles undergoing coagulation and sintering. Aerosol Sci. Technol. 1993;19(4):514–526. [Google Scholar]
- 31.Ehrman SH, Friedlander SK, Zachariah MR. Characteristics of SiO2/TiO2 nanocomposite particles formed in a premixed flat flame. J. Aerosol Sci. 1998;29(5-6):687–706. [Google Scholar]
- 32.Tsantilis S, Briesen H, Pratsinis SE. Sintering time for silica particle growth. Aerosol Sci. Technol. 2001;34(3):237–246. [Google Scholar]
- 33.Kobata A, Kusakabe K, Morooka S. Growth and transformation of TiO2 crystallites in aerosol reactor. AIChE J. 1991;37(3):347–359. [Google Scholar]
- 34.Schaefer DW, Hurd AJ. Growth and Structure of Combustion Aerosols: Fumed Silica. Aerosol Sci. Technol. 1990;12(4):876–890. [Google Scholar]
- 35.Powell QH, Kodas TT, Anderson BM. Coating of TiO2 particles by chemical vapor deposition of SiO2. Chem. Vapor. Depos. 1996;2(5):179–181. [Google Scholar]


