Abstract
The plasmonic properties of noble metals facilitate their use for in-vivo bio-applications such as targeted drug delivery and cancer cell therapy. Nanosilver is best suited for such applications as it has the lowest plasmonic losses among all such materials in the UV-visible spectrum. Its toxicity, however, can destroy surrounding healthy tissues and thus, hinders its safe use. Here, that toxicity against a model biological system (Escherichia coli) is “cured” or blocked by coating nanosilver hermetically with a about 2 nm thin SiO2 layer in one-step by a scalable flame aerosol method followed by swirl injection of a silica precursor vapor (hexamethyldisiloxane) without reducing the plasmonic performance of the enclosed or encapsulated silver nanoparticles (20 – 40 nm in diameter as determined by X-ray diffraction and microscopy). This creates the opportunity to safely use powerful nanosilver for intracellular bio-applications. The label-free biosensing and surface bio-functionalization of these ready-to-use, non-toxic (benign) Ag nanoparticles is presented by measuring the adsorption of bovine serum albumin (BSA) in a model sensing experiment. Furthermore, the silica coating around nanosilver prevents its agglomeration or flocculation (as determined by thermal annealing, optical absorption spectroscopy and microscopy) and thus, enhances its biosensitivity, including bioimaging as determined by dark field illumination.
Keywords: Core/Shell Nanoparticles, Functional Coatings, Sensors/Biosensors, Silver, Surface Plasmon Resonance, Label-free biosensing, nanosilver, silica coating, flame aerosol synthesis
1. Introduction
Noble metal (e.g. gold or silver) nanoparticles possess plasmonic properties that are attractive in novel biological sensing applications.[1] These unique optical properties originate from collective oscillations of conduction electrons, the so-called localized surface plasmons.[2] These properties do not degrade over time and depend on nanoparticle shape and size as well as on the refractive index of their surroundings.[3] For label-free biosensing, protein molecules which have a higher refractive index than aqueous solutions cause a red shift of the plasmon absorption band.[2] The latter dependency can be exploited to detect biomolecules such as proteins.[4,5]
Certain diseases such as bacterial infections or cancer are accompanied by a higher concentration of specific analytes. Such target analytes are known to bind specifically to the corresponding capture biomolecules (e.g. antibodies).[2] Thus, by anchoring the latter on the surface of plasmonic biosensors (bio-functionalization), their detection is possible by the local change in the refractive index. In fact, this has been exploited by multi-step synthesis of plasmonic sensors including rods[6] or disks[7] that exhibit promising ultra-sensitive biodetection performance, bringing plasmonic biosensors close to detection limits achieved by other techniques.[8] Moreover, plasmonic nanoparticles strongly scatter and absorb light[9] enabling their detection under dark field illumination.[9] So they have been used as intracellular in-vivo biomarkers[10,11] and as diagnostic or even therapeutic tools[12] for targeted drug delivery or cancer cell treatment.[13]
Among noble metal nanoparticles, nanosilver is ideal as it has the lowest plasmonic losses in the UV-visible spectrum.[14] There is, however, concern regarding toxicity and environmental impact of nanosilver[15] that blocks its use in bio-applications. In fact, nanosilver is the first nanomaterial to draw the attention of the U.S. Environmental Protection Agency (EPA).[16] Nanosilver is toxic to biological systems by its direct contact with cells[17] and/or release of toxic Ag+ ions from its surface.[18] Such toxicity remains even after modification of the nanosilver surface with a biocompatible layer of polysaccharides.[19] If the toxicity of nanosilver would be controlled and essentially “cured”, new opportunities would be created in biosensing and bio-imaging.[9]
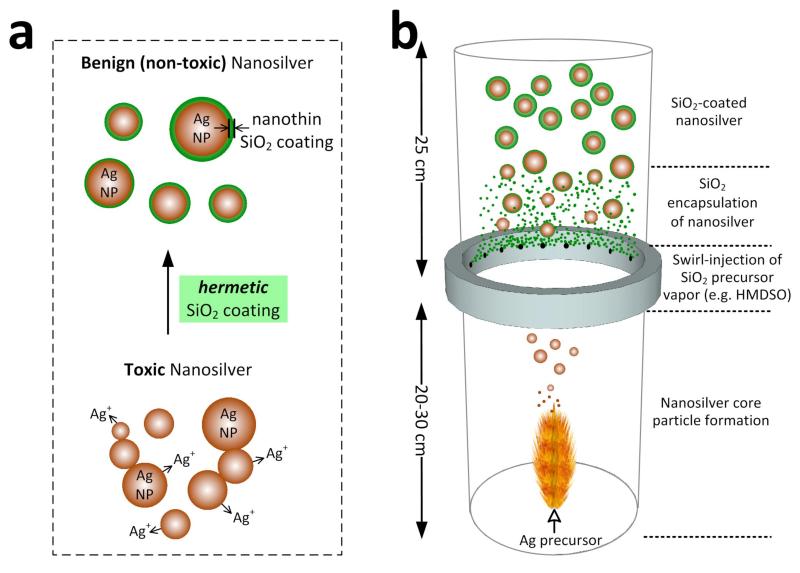
A potent way to achieve this is by applying hermetically a thin, transparent and inert silica-coating around the nanosilver surface. The role of such silica shell is triple (Figure 1a): a) inhibits the toxicity of nanosilver by preventing the direct contact of cells with its surface, b) blocks the release of toxic Ag+ ions and c) facilitates the colloidal dispersion of nanosilver particles that otherwise flocculate and exhibit limited biosensitivity.[3] Additionally, it facilitates surface functionalization of nanosilver with bio-molecules since the surface chemistry of silica is reasonably well understood.[20] Such nanosilver-silica core-shell particles have been made already by employing silane coupling agents,[20] sol-gel[21] and reverse microemulsion.[22] Silica coating by such wet-methods has been applied also to quantum dot core nanoparticles resulting in fluorescent materials with reduced toxicity.[23] Such wet-coated nanosilver, however, retains its toxicity, most probably because such SiO2 shells tend to be porous[24] enabling toxic Ag+ ion transport, and thus hindering the use of nanosilver as in-vivo biomarker.[19]
Figure 1.
(a) Bare nanosilver particles are toxic and tend to flocculate. By applying on them a hermetic SiO2 coating, both flocculation and toxicity of nanosilver are prevented enabling synthesis of powerful and non-toxic nanosilver biosensors. (b) Schematic of the enclosed flame aerosol reactor process for synthesis of hermetically SiO2-coated nanosilver.
Here, encapsulation of nanosilver with silica is made in one-step by a dry, scalable[25] flame aerosol method.[26] Figure 1b illustrates the in-flight SiO2-coating on freshly-formed nanosilver core particles similar to hermetic coating of photocatalytic[26] TiO2 and superparamagnetic[27] Fe2O3 nanoparticles. The influence of this coating on nanosilver toxicity is investigated here against a model biological system, the Gram-negative bacterium Escherichia coli (E. coli). The effect of SiO2 coating on the plasmonic properties of nanosilver is measured and finally, the feasibility of these core-shell particles as biosensors is demonstrated in the presence of adsorbed bovine serum albumin (BSA) which serves as a model protein.
2. Results and Discussion
2.1 Hermetic SiO2 coating: ‘Curing’ nanosilver’s toxicity
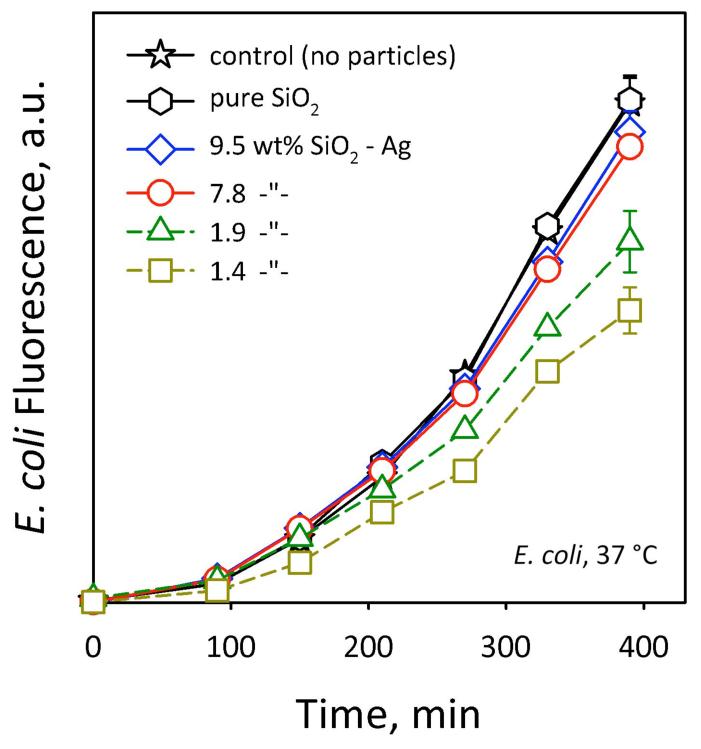
Figure 2 shows the E. coli growth at 37 °C in the absence (control, stars) and presence of pure SiO2 (hexagons) as well as various SiO2-coated nanosilver samples for up to 390 minutes. The error bars correspond to the standard deviation of 4 measurements and are similar for all data. The E. coli growth in the presence of SiO2 is identical with the control, therefore SiO2 does not influence the process. Most importantly, the nanosilver samples coated at higher SiO2-contents, 7.8 (circles) and 9.5 wt% SiO2 (diamonds) do not influence E. coli growth that nearly overlaps with that in the absence of nanosilver (stars, hexagons). At lower SiO2-contents (triangles, squares), however, E. coli growth decreases, pointing out the toxic activity of nanosilver. This indicates that the higher SiO2-content nanosilver is non-toxic and fully-coated by SiO2 as with similarly coated TiO2 and Fe2O3 nanoparticles.[26,27] In contrast, the lower SiO2-content nanosilver particles are partially-coated, and thus a fraction of the bare nanosilver surface is exposed, reducing the E. coli growth. It should be noted that the nanosilver particles employed here are rather large and their Ag+ ion release is minimal (<1 % of the total Ag mass)[28] as determined electrochemically. Therefore, the observed toxicity against E. coli of by the uncoated nanosilver here might be attributed mostly to the direct bacterial contact with the nanosilver surface rather than its ions.
Figure 2.
The E. coli fluorescence monitored at 37 °C in the absence (stars) and presence of pure SiO2 (hexagons) and nanosilver coated by 1.4 (squares), 1.9 (triangles), 7.8 (circles) and 9.5 wt% SiO2 (diamonds). The SiO2-coating does not inhibit E. coli growth. For a decreasing SiO2-content, however, significant E. coli growth inhibition is observed indicating the exposure of nanosilver surface to E. coli. Coating nanosilver, however, with 7.8 and 9.5 wt% SiO2 blocks its toxicity resulting in nanosilver that can be used as plasmonic biosensor.
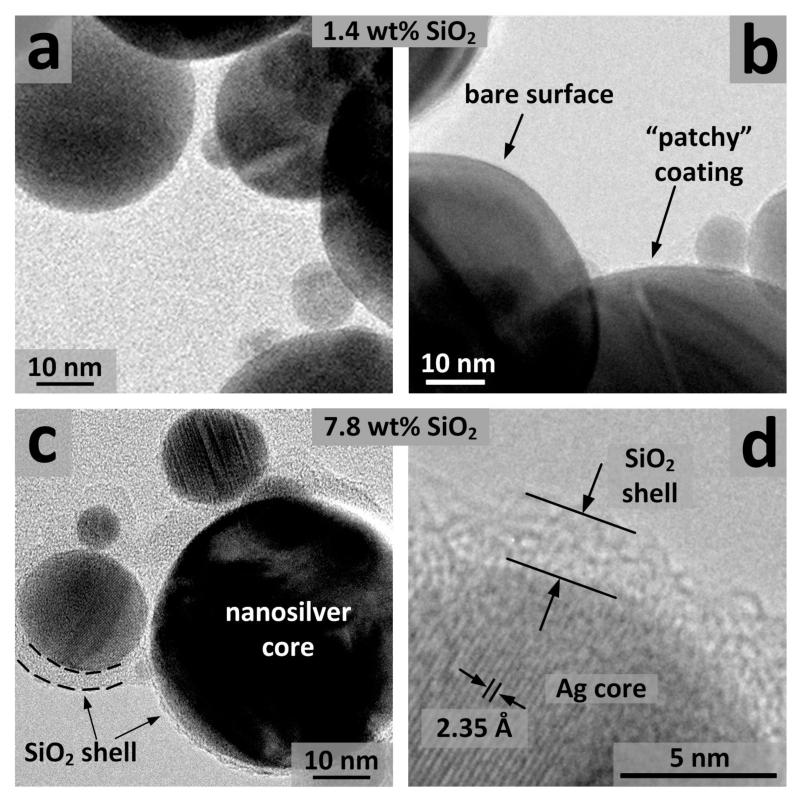
Figure 3 shows TEM images of the 1.4 (a,b) and 7.8 wt% (c,d) SiO2-coated nanosilver. The surface of the low SiO2-content nanosilver particles (Figures 3a,b) is indeed bare or coated with a very thin, non-continuous, amorphous, “patchy” SiO2 layer (<1 nm).[26] The TEM images of the 7.8 wt% SiO2 sample (Figures 3c,d) show that a thin amorphous SiO2 layer surrounds the crystal core nanosilver particles, which largely prevents the toxic action of the latter and thus may have “cured” their toxicity. The amorphous SiO2 shell is approximately 2 nm thick, while crystal planes of the nanosilver core can be distinguished. The distance between crystal planes (ca. 2.35 Å) corresponds to the (111) plane of Ag metal. Furthermore, a close observation of high silica-content nanosilver particles shows that these particles are partially aggregated as the silica coating bridges 5-6 particles there (Figure 3c).
Figure 3.
TEM images of the 1.4 wt% (a,b) and 7.8 wt% (c,d) SiO2 coated nanosilver. Patchy coatings of nanosilver with bare surface as well as with very thin (<1 nm), non-continuous amorphous SiO2-coating are observable (b). The nanosilver core can be distinguished from its amorphous silica coating (c). The distance of the crystal planes (ca. 2.35 Å) corresponds to the (111) plane of Ag metal (d).
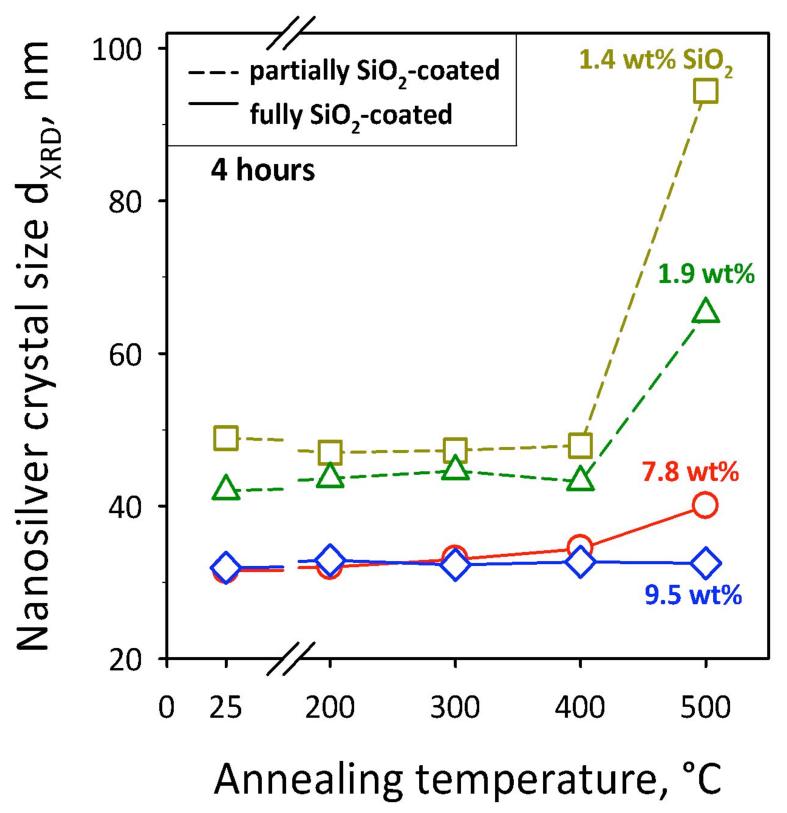
The SiO2 coating achieved here hermetically encapsulates the nanosilver core particles diminishing, if not eliminating, their toxicity and making them safe biomaterials to be used as diagnostic and therapeutic tools.[1,12] To further evaluate the extent of coating of nanosilver, its sintering behavior is investigated. Figure 4 shows the average nanosilver core crystal size as a function of annealing temperature. Initial nanosilver crystal sizes differ as SiO2 on its surface hinders Ag particle coalescence or sintering as seen with TiO2 or Fe2O3 core nanoparticles.[27] All SiO2-containing nanosilver particles are stable till 400 °C. At 500 °C, however, the crystal size of partially-coated nanosilver (broken lines) increases substantially, while for fully-coated nanosilver it remains constant. This indicates that, partially-coated nanosilver undergoes further sintering during annealing at 500 °C. In contrast, no sintering or crystal growth takes place with nanosilver fully-coated by a thin SiO2 layer.
Figure 4.
Sintering of nanosilver: Its core crystal size as a function of annealing temperature for 4 hours. Partially-coated nanosilver particles grow above 400 °C while fully-coated ones (9.5 wt% SiO2) keep their size up to 500 °C.
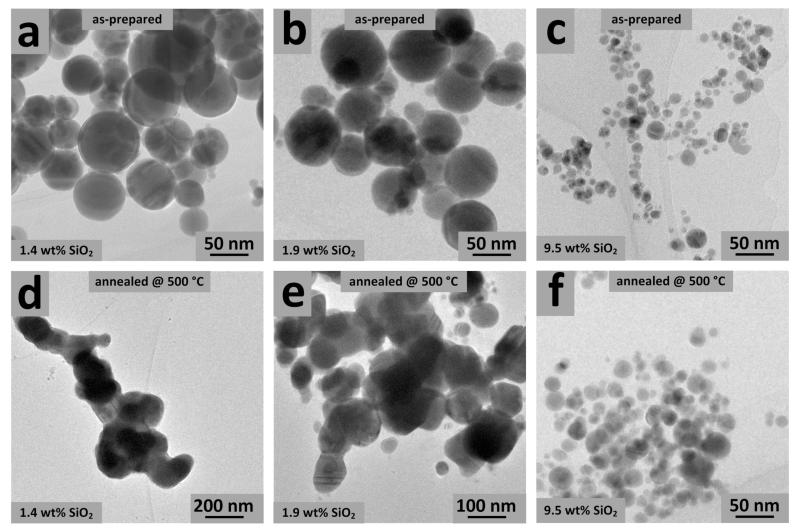
This is further verified by electron microscopy. Figure 5 shows TEM images of the partially-coated 1.4, 1.8 wt% SiO2 (a,b and d,e, respectively) and fully-coated 9.5 wt% SiO2 (c,f), as-prepared (a,b,c) and after their sintering for 4 hours at 500 °C (d,e,f). Sinter necks cannot be distinguished in all as-prepared, fully- or partially-coated nanosilver (a,b,c). The fully-coated nanosilver annealed at 500 °C also does not show significant growth (f), indicating that the SiO2 coating prevents its crystal or particle growth. In contrast, in the images of the partially-coated nanosilver after annealing (d,e), large sinter necks appear[29] verifying the crystal growth of nanosilver particles (note the different magnification in the images d,e). It should be noted that some slightly larger silver particles in Figure 5f might arise from the few escaping the coating process as has been determined by computational fluid dynamic analysis of these reactors.[30] These particles probably are responsible for the limited antibacterial activity of the 7.8 and 9.5 wt% SiO2-coated nanosilver that result in slightly lower bacterial growth than that of the control in Figure 2 (stars, hexagons).
Figure 5.
TEM images of the 1.4, 1.9 and 9.5 wt% SiO2-coated nanosilver as-prepared (a,b,c) and after their sintering or annealing for 4 hours at 500 °C (d,e,f). Please note the difference in magnification (d,e). Partially-coated nanosilver with SiO2 (a,b) grows substantially (d,e). In contrast, fully-coated nanosilver (c) hardly grows upon annealing (f) consistent with Figure 4.
2.2 Optical properties of SiO2-coated nanosilver: Agglomeration
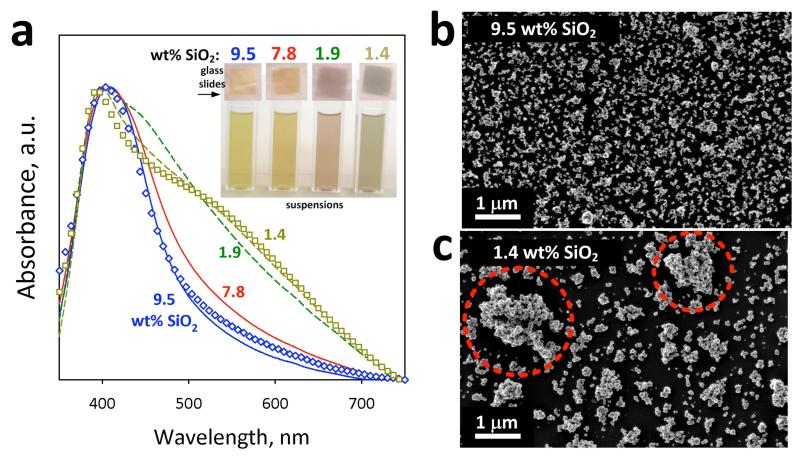
Figure 6a shows the optical absorption spectra of fully- (9.5 and 7.8 wt% SiO2) and partially-coated (1.9 and 1.4 wt% SiO2) nanosilver films on glass slides. All spectra have been normalized to the peak of the plasmon absorption band (~400 nm). Even though all samples have their peak around 400 nm in wavelength, the absorption bands of the fully-coated nanosilver are narrower than those of the partially-coated. This is attributed to agglomeration of nanosilver,[3] and can be visually detected by the color of their aqueous suspensions and films on glass slides (Figure 6a, inset). The fully-coated nanosilver suspensions are yellowish corresponding to the typical plasmonic color of spherical (~30 nm) Ag colloid particles (Figure 4). The color of the aqueous suspensions becomes redish-brown and the absorption band broadens as the SiO2 wt% on nanosilver particles decreases.
Figure 6.
(a) The optical absorption spectra of deposited nanosilver particles on glass slides. In the inset, pictures of the dispersed nanosilver in aqueous suspensions and on glass slides are shown. Partially-coated nanosilver particles (1.4 and 1.9 wt% SiO2) form agglomerates which broaden the plasmon absorption band (broken lines). The SiO2 layer, however, surrounding the fully-coated nanosilver particles (7.8 and 9.5 wt% SiO2) prevents their agglomeration or flocculation and narrows their plasmon absorption band (solid lines). This occurs in the suspensions, since their spectra are identical to the ones from the glass slides (symbols). SEM images of the (b) fully-coated (9.5 wt%) and (c) partially-coated (1.4 wt% SiO2) nanosilver verifying the absorption spectra. The partially-coated nanosilver results in bigger agglomerated or flocculated structures (highlighted in red circles) in suspensions.
The SiO2 shell surrounding the nanosilver core particles limits agglomeration of fully-coated nanosilver. In contrast, the surface of partially-coated nanosilver is exposed leading to agglomeration or flocculation resulting in broadening of the plasmon absorption band and change in the color of the suspensions (Figure 6a, inset).[3] This is further verified by scanning electron microscopy (SEM). Figure 6 also shows SEM images of b) fully- (9.5 wt% SiO2) and c) partially-coated (1.4 wt% SiO2) nanosilver films on glass slides. While the aggregates of the fully-coated nanosilver are rather homogeneously dispersed with a low degree of agglomeration, the partially-coated nanosilver exhibits much bigger agglomerates or flocs (~1-2 μm) that are highlighted in red circles. These agglomerates were formed within the aqueous suspensions and not during nanosilver deposition, since the optical absorption spectra of both aqueous suspensions (Figure 6a: lines) and those on glass slides (Figure 6a: symbols) are identical. Large agglomerates or flocs of the partially-coated nanosilver are undesirable as plasmonic bio-probes for bio-imaging since they have similar size to the examined cells. In contrast, the fully-coated nanosilver particles, apart from the reduced toxicity, are also much less agglomerated requiring no post-treatment. The smaller degree of agglomeration or flocculation of such particles facilitates further their employment in bio-imaging applications.
2.3 Label-free biosensor performance
The performance of plasmonic nanostructures for label-free biosensing is typically investigated by their response when biomolecules (e.g proteins) are adsorbed on their surface.[6,7] Besides label-free biosensing, such surface functionalization is also an essential process for employment of plasmonic nanostructures as optical agents in bio-imaging, as most often specific proteins are attached on the agent’s surface which bind selectively on the desired analyte.[9] Here, the feasibility of the label-free biosensing (also bio-functionalization) of silica-coated nanosilver biosensors is demonstrated by monitoring their spectral response on the adsorption of a model protein, bovine serum albumin (BSA), on their surface.
High concentration of BSA was employed to compare the response of various SiO2-coated nanosilver particles with full BSA coverage. The aqueous solution around the deposited nanosilver is controlled through a flow cell and its optical properties are monitored in-situ.[5] Thus, any change in the refractive index of the surroundings of nanosilver (e.g. by BSA adsorption) is reflected on its absorbance spectrum with a shift Δλ of the peak position of the Ag plasmon absorption band,[2] which is translated as the sensor response. Since BSA has a higher refractive index than the buffer solution, a red shift of the peak is expected.[2]
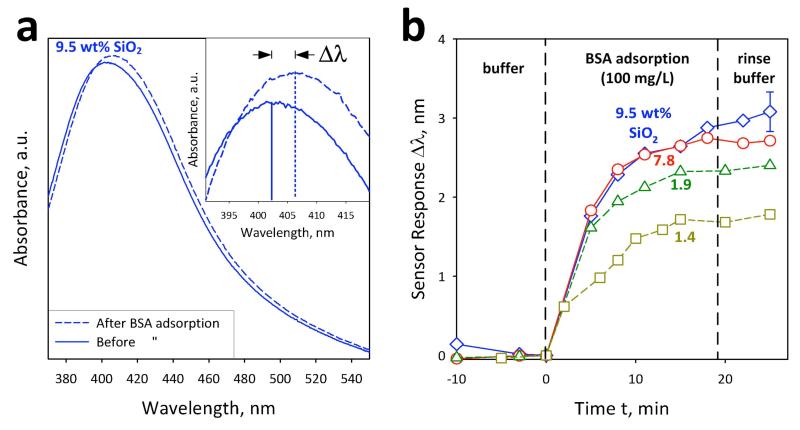
Figure 7a shows such a response, Δλ, from ~403 to ~406 nm by the 9.5 wt% SiO2-coated nanosilver biosensor before (solid line) and after (broken line) injection of 100 mg L−1 or 1.44 μm BSA into the flow cell. In the inset of Figure 7a, the same spectra are magnified at 390-420 nm. This shift remains after the rinsing of the flow cell with buffer solution indicating the presence of a stable physisorbed layer of BSA on nanosilver.
Figure 7.
(a) The optical absorption spectra before (solid line) and after (broken line) adsorption of bovine serum albumin (BSA, 100 mg L−1). The inset shows the shift of the peak position Δλ which corresponds to the sensor response. (b) The sensor response Δλ as a function of time for the fully-coated (circles, diamonds) and partially-coated (squares, triangles) nanosilver. The fully-coated nanosilver outperforms the partially-coated one, because of the less agglomeration of the former (Figures 6b,c).
Figure 7b presents the adsorption kinetics of nanosilver coated at various SiO2 contents (1.4-9.5 wt%). The error bars correspond to the standard deviation of 3 measurements and are similar for all data. As soon as the sensor response stabilizes in the buffer solution (t = 0 min), BSA is added. When the adsorption of BSA gives a saturated signal at about t = 20 min, the buffer solution is injected again for rinsing to exclude the effect of bulk medium change. In the adsorption kinetics, BSA uptake was observed, followed by the signal saturation for all nanosilver-SiO2 contents. The non-toxic, fully-coated biosensors, however, outperform the partially-coated ones, reaching a sensor response of ~3 nm, which is almost twice as large as the response of partially-coated (1.4 wt% SiO2) nanosilver. This is attributed to the reduced effective surface area of partially-coated nanosilver by flocculation or agglomeration, as seen in Figure 6a by the broader plasmon absorption band and the images in Figure 6b,c. This facilitates higher BSA adsorption on the nanosilver surface. Therefore, the SiO2 coating, apart from “curing” or blocking the toxicity of fully-coated nanosilver (Figure 2), also enhances its biosensor performance (Figure 7b) by preventing agglomeration or flocculation (Figure 6b,c) of nanosilver and facilitating its use in biosensing. The present synthesis and coating process results in a rather “eco-friendly” nanomaterial that offers its sought-out performance (e.g. plasmonics) with limited flocculation in suspensions and may minimize risks (e.g. toxicity) to human health and environment.
Apart from the obvious advantages of these particles as agents for bio-imaging, they can also be used as label-free biosensors, although the sensor response is lower than lithographically fabricated nanostructures.[31] Even though the present measurement system is not yet optimized, the wavelength shift as well as the peak sharpness is similar to the plasmonic gold nanostructures made by multiple-step nanofabrication techniques[6,7] (e.g. ~3 nm for 100 mg L−1 BSA[7]). While the advantage of lithography lies in the possibility to control the geometry, such nanofabrication and the use of gold are typically quite costly. Employment of silver as plasmonic material is practically more desired in terms of the fabrication cost and the optical loss, provided that silver can be chemically stabilized with proper coating by a simple fabrication method. The flame aerosol technology presented here allowed one-step synthesis of nanosilver for plasmonic biosensors having comparable response to the biosensors made by elaborate nanofabrication processes.
3. Conclusions
The toxicity of nanosilver can be effectively eliminated by a thin, hermetic coating on its surface. This results in a safe biomaterial ready to be employed as diagnostic and/or therapeutic agent, for example, in targeted cancer cell treatment,[12] without inducing any damage to the surrounding healthy tissue. The hermetic SiO2 layer prevents the direct contact of cells with the nanosilver surface and blocks the release of toxic Ag+ ions. This was demonstrated here by one-step, in-situ synthesis of SiO2-coated nanosilver by a dry scalable flame aerosol technology resulting in core-shell nanostructures.
For the first time, hermetically SiO2-coated nanosilver particles exhibited limited, if any, toxicity, while partially-coated ones partly inhibited E. coli bacterial growth indicating their toxicity. Partially-coated nanosilver particles formed large agglomerates or flocs when dispersed in aqueous suspensions while the SiO2 layer on the fully-coated nanosilver largely prevented its agglomeration or flocculation. The feasibility of the surface bio-functionalization and label-free biosensing of these silica-coated nanosilver was shown here by monitoring the shift of its plasmon absorption band in the presence of bovine serum albumin (BSA) on the SiO2-coated nanosilver surface.
The prevention of nanosilver agglomeration resulted in increased surface area for BSA adsorption, since the sensor response of the fully-coated nanosilver was higher than that of partially-coated or uncoated ones. The observed sensor response was comparable to that obtained by plasmonic biosensors manufactured by multiple-step nanofabrication techniques. The fast, one-step silica encapsulation of nanosilver here resulted in non-toxic plasmonic biosensors easy to disperse in aqueous suspensions and to bio-functionalize, enabling their use in bio-imaging.
4. Experimental
4.1 Nanosilver particle production and characterization
Nanosilver particle production and in-situ SiO2 coating was achieved in a modified flame aerosol reactor (Figure 1b) which is described in detail elsewhere.[26] In brief, a precursor solution containing Ag-benzoate (0.5 M, Sigma Aldrich, purity 99%) dissolved in 2-ethylhexanoic acid (Sigma Aldrich, purity ≥99%) and benzonitrile (Sigma Aldrich, purity ≥ 99%) (volume ratio 1:1) was fed through a capillary (feed rate 5 mL min−1) and dispersed by oxygen (PanGas, purity >99.9%, flow rate: 5 L min−1) and combusted forming the Ag nanoparticles. The freshly-formed core Ag nanoparticles were coated in-flight by swirl injection of hexamethyldisiloxane (HMDSO, Sigma Aldrich, purity ≥ 99%) vapor along with nitrogen (15 L min−1, PanGas, purity >99.9%) at room temperature through a metallic ring with 16 equidistant openings (Figure 1b). The ring was placed on top of a quartz glass tube (20-30 cm long). The reactor was terminated by a quartz glass tube (25 cm). The HMDSO vapor was supplied by bubbling nitrogen through approximately liquid HMDSO (350 mL) in a glass flask (max. 500 mL). The SiO2 content in the product particles was calculated at full saturation[26] and by varying the bubbler temperature (5-7 °C) and nitrogen flow rate (0.05-0.3 L min−1). The N2 stream carrying HMDSO vapor to the coating ring outlet is fully saturated with HMDSO up to 0.8 L min−1 N2 flow rate through the HMDSO bubbler.[26] The full conversion of HMDSO to SiO2 has been proven by DC plasma optical emission spectroscopy for SiO2-coated TiO2 nanoparticles,[26] produced with the same enclosed flame aerosol reactor.
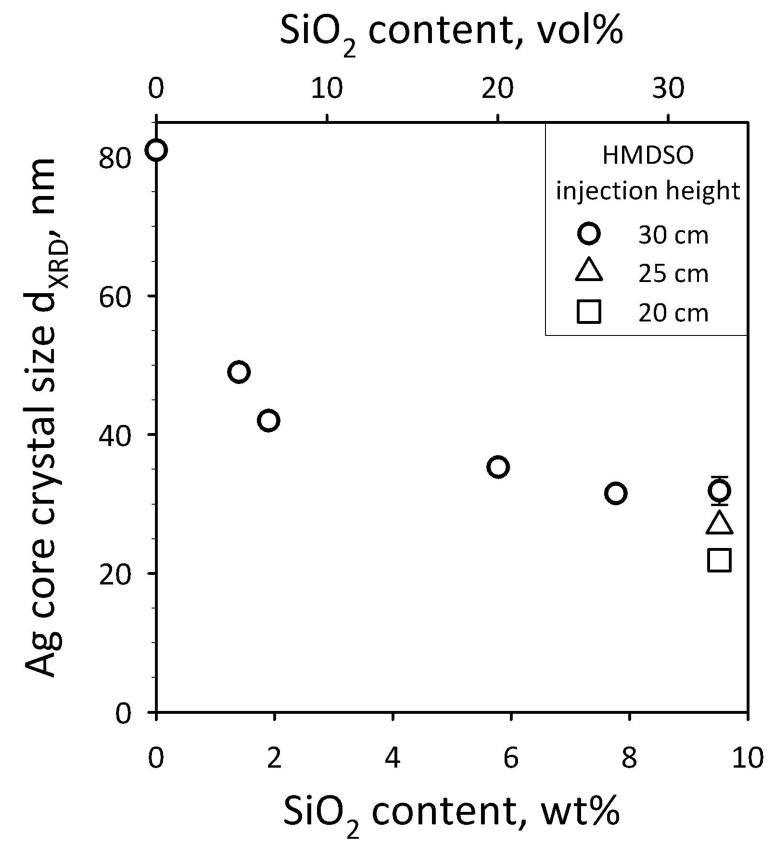
The nanosilver size can be tuned by varying the silica content and/or the distance between the flame spray burner and the metallic ring from which the SiO2 precursor (HMDSO) is injected. Figure 8 shows the nanosilver crystal size as a function of SiO2 content, for three different HMDSO injection heights. The error bars correspond to the standard deviation of 3 measurements and are similar for all data. Lowering the injection height and/or increasing the silica-content, reduces the nanosilver size. Additionally, increasing SiO2 content prevents also nanosilver agglomeration.[27] Therefore, precise control over the nanosilver core crystal size can be obtained by fine tuning the process parameters. Pure (0 wt% SiO2) nanosilver particles were sintered on the filter and their further processing was not possible, as their aggregate size was rather big (several microns) and they did not exhibit any plasmonic performance.
Figure 8.
Tuning the nanosilver crystallite size by a) the SiO2 content of the final product nanosilver particles and b) the injection height of the SiO2 precursor vapor at 30 (circles) 25 (triangles) and 20 cm (squares) above the flame spray burner. Increasing the SiO2-content prevents Ag-nanoparticle agglomeration and crystal growth. The injection of HMDSO (the SiO2 precursor) at lower heights cools the flame aerosol and prevents also further Ag crystal growth.[26]
High resolution transmission electron microscopy (HRTEM) was performed with a CM30ST microscope or a Tecnai F30 microscope (both: FEI; LaB6 cathode, operated at 300 kV, point resolution ~2 Å). Product particles were dispersed in ethanol and deposited onto a perforated carbon foil supported on a copper grid. X-ray diffraction (XRD) patterns were obtained with a Bruker AXS D8 Advance spectrometer (Cu Kα, 40 kV, 40 mA). The crystallite size of silver was determined using the TOPAS 3 software and fitting only the (111) main diffraction peak (2θ = 36°-40°) with the Inorganic Crystal Database [ICSD Coll. Code.: 064995]. The error bar for each data point was taken as the standard deviation of 3 measurements. The Ag+ ion concentrations were measured electrochemically with an ion selective electrode and an ion meter (Metrohm). Particles were dispersed in pure water at a concentration 20 mg L−1 of Ag.
4.2 Toxicity evaluation
A growth inhibition assay was performed to examine the toxicity of the nanosilver particles. Therefore, E. coli JM101 bacteria synthesizing green fluorescent protein (GFP) from a plasmid-encoded gene were grown in Luria-Bertani broth (LB)[32] at 37 °C overnight. The culture was subsequently diluted with LB by mixing 25 μL of the culture in 5 mL LB. The nanosilver particle concentration was normalized with respect to their surface area, calculated from the crystal size that is quite close (within 3%) to number average Ag particle diameter from TEM. All measurements have an equal Ag surface concentration of approximately 2.3·10−4 m2 mL−1 (corresponding to 20 mg L−1 of Ag of the 1.4 SiO2 wt% sample) The nanosilver particles were dispersed in de-ionized water by ultrasonication (Sonics vibra-cell) for 20 seconds at 75% amplitude, with a pulse configuration on/off of 0.5s/0.5s, at 200 mg L−1 of Ag. The corresponding measured concentrations were made by diluting these batch suspensions. After ultrasonication, the nanoparticles were homogeneously dispersed and stable in the aqueous suspension. For the assay, 50 μL of the aqueous solutions containing the dispersed nanosilver particles were added to 50 μL of the diluted cells. The growth of E. coli JM101 was investigated by monitoring the fluorescent signal of the GFP (Perkin Elmer 1420) corrected for background fluorescence. The growth percentages were calculated by assuming 100% growth for the control measurements (no silver). The error bars for each data point were obtained as the standard deviation of 4 measurements.
4.3 Biosensor Performance
The biosensing of nanosilver particles was assessed using bovine serum albumin (BSA) as model protein. Oxygen-plasma-cleaned (Harrick Plasma PDC32G, 18W, 2 min) glass slides were coated by poly(L-lysine), PLL, by incubating the substrate surface with PLL solution (100 mg L−1). Nanosilver particles were then deposited from the aqueous suspension onto the PLL-coated glass substrate. The positively charged PLL layer immobilizes the negatively charged nanoparticles by electrostatic force (both silver and silica are negatively charged at pH 7). The substrate was then set in a flow cell which was mounted on a UV/vis spectrometer (Cary Varian 500) and the Ag plasmon absorption peak positions were monitored during BSA adsorption. The measurement was started in a buffer solution consisting of 4-(2-hydroxyethyl) piperazine-1-ethanesulfonic acid (HEPES, 10 mm) with a pH adjusted to 7.4 using NaOH and supplemented with NaCl (150 mm). The BSA solution (100 mg L−1 in HEPES) was then injected followed by rinsing with HEPES buffer solution to confirm the adsorption signal. The peak position was determined by parabolic fitting of the absorption bands. Scanning electron microscope (SEM) images from the deposited particles on the glass substrates were taken by a Zeiss Supra 50 VP.
Acknowledgements
Financial support by the Swiss National Science Foundation (# 200020-126694) and European Research Council is gratefully acknowledged. The toxicity measurements were performed in Professor’s Sven Panke Bioprocess Laboratory, Department of Biosystems Science and Engineering, ETH Zurich and the help of Andreas Meyer is greatly appreciated. TEM work was performed at the Electron Microscopy Center of ETH Zurich (EMEZ).
References
- [1].Alivisatos P. Nat. Biotechnol. 2004;22:47–52. doi: 10.1038/nbt927. [DOI] [PubMed] [Google Scholar]
- [2].Willets KA, Van Duyne RP. Annu. Rev. Phys. Chem. 2007;58:267–297. doi: 10.1146/annurev.physchem.58.032806.104607. [DOI] [PubMed] [Google Scholar]
- [3].Evanoff DD, Chumanov G. ChemPhysChem. 2005;6:1221–1231. doi: 10.1002/cphc.200500113. [DOI] [PubMed] [Google Scholar]
- [4].McFarland AD, Van Duyne RP. Nano Lett. 2003;3:1057–1062. [Google Scholar]
- [5].Sannomiya T, Hafner C, Voros J. Nano Lett. 2008;8:3450–3455. doi: 10.1021/nl802317d. [DOI] [PubMed] [Google Scholar]
- [6].Kabashin AV, Evans P, Pastkovsky S, Hendren W, Wurtz GA, Atkinson R, Pollard R, Podolskiy VA, Zayats AV. Nat. Mater. 2009;8:867–871. doi: 10.1038/nmat2546. [DOI] [PubMed] [Google Scholar]
- [7].Chen S, Svedendahl M, Kall M, Gunnarsson L, Dmitriev A. Nanotechnology. 2009;20:434015–434024. doi: 10.1088/0957-4484/20/43/434015. [DOI] [PubMed] [Google Scholar]
- [8].Ohno Y, Maehashi K, Yamashiro Y, Matsumoto K. Nano Lett. 2009;9:3318–3322. doi: 10.1021/nl901596m. [DOI] [PubMed] [Google Scholar]
- [9].Wax A, Sokolov K. Laser Photon. Rev. 2009;3:146–158. [Google Scholar]
- [10].Lee KJ, Nallathamby PD, Browning LM, Osgood CJ, Xu XHN. ACS Nano. 2007;1:133–143. doi: 10.1021/nn700048y. [DOI] [PMC free article] [PubMed] [Google Scholar]
- [11].Kumar S, Harrison N, Richards-Kortum R, Sokolov K. Nano Lett. 2007;7:1338–1343. doi: 10.1021/nl070365i. [DOI] [PubMed] [Google Scholar]
- [12].Jain PK, Huang X, El-Sayed IH, El-Sayad MA. Plasmonics. 2007;2:107–118. [Google Scholar]
- [13].Loo C, Lowery A, Halas N, West J, Drezek R. Nano Lett. 2005;5:709–711. doi: 10.1021/nl050127s. [DOI] [PubMed] [Google Scholar]
- [14].Barnes WL, Dereux A, Ebbesen TW. Nature. 2003;424:824–830. doi: 10.1038/nature01937. [DOI] [PubMed] [Google Scholar]
- [15].Wijnhoven SWP, Peijnenburg WJGM, Herberts CA, Hagens WI, Oomen AG, Heugens EHW, Roszek B, Bisschops J, Gosens I, Van De Meent D, Dekkers S, De Jong WH, van Zijverden M, Sips A. n. J. A. M., Geertsma RE. Nanotoxicology. 2009;3:109–138. [Google Scholar]
- [16].Erickson BE. Chem. Eng. News. 2009;87:25–26. [Google Scholar]
- [17].Morones JR, Elechiguerra JL, Camacho A, Holt K, Kouri JB, Ramirez JT, Yacaman MJ. Nanotechnology. 2005;16:2346–2353. doi: 10.1088/0957-4484/16/10/059. [DOI] [PubMed] [Google Scholar]
- [18].Navarro E, Piccapietra F, Wagner B, Marconi F, Kaegi R, Odzak N, Sigg L, Behra R. Environ. Sci. Technol. 2008;42:8959–8964. doi: 10.1021/es801785m. [DOI] [PubMed] [Google Scholar]
- [19].Schrand AM, Braydich-Stolle LK, Schlager JJ, Dai LM, Hussain SM. Nanotechnology. 2008;19:235104–235117. doi: 10.1088/0957-4484/19/23/235104. [DOI] [PubMed] [Google Scholar]
- [20].Liz-Marzan LM, Giersig M, Mulvaney P. Langmuir. 1996;12:4329–4335. [Google Scholar]
- [21].Kobayashi Y, Katakami H, Mine E, Nagao D, Konno M, Liz-Marzan LM. J. Colloid Interface Sci. 2005;283:392–396. doi: 10.1016/j.jcis.2004.08.184. [DOI] [PubMed] [Google Scholar]
- [22].Han Y, Jiang J, Lee SS, Ying JY. Langmuir. 2008;24:5842–5848. doi: 10.1021/la703440p. [DOI] [PubMed] [Google Scholar]
- [23].Selvan ST, Tan TT, Ying JY. Adv. Mater. 2005;17:1620–1625. [Google Scholar]
- [24].Xu K, Wang JX, Kang XL, Chen JF. Mater. Lett. 2009;63:31–33. [Google Scholar]
- [25].Mueller R, Madler L, Pratsinis SE. Chem. Eng. Sci. 2003;58:1969–1976. [Google Scholar]
- [26].Teleki A, Heine MC, Krumeich F, Akhtar MK, Pratsinis SE. Langmuir. 2008;24:12553–12558. doi: 10.1021/la801630z. [DOI] [PubMed] [Google Scholar]
- [27].Teleki A, Suter M, Kidambi PR, Ergeneman O, Krumeich F, Nelson BJ, Pratsinis SE. Chem. Mat. 2009;21:2094–2100. [Google Scholar]
- [28].Sotiriou GA, Pratsinis SE. Environ. Sci. Technol. 2010;44:5649–5654. doi: 10.1021/es101072s. [DOI] [PubMed] [Google Scholar]
- [29].Teleki A, Wengeler R, Wengeler L, Nirschl H, Pratsinis SE. Powder Technol. 2008;181:292–300. [Google Scholar]
- [30].Teleki A, Buesser B, Heine MC, Krumeich F, Akhtar MK, Pratsinis SE. Ind. Eng. Chem. Res. 2009;48:85–92. [Google Scholar]
- [31].Haes AJ, Chang L, Klein WL, Van Duyne RP. J. Am. Chem. Soc. 2005;127:2264–2271. doi: 10.1021/ja044087q. [DOI] [PubMed] [Google Scholar]
- [32].Sambrook J, Russell DW. Molecular Cloning: A Laboratory Manual. 3 ed. NY Cold Spring Harbor Laboratory Press; Cold Spring Harbor: 2001. [Google Scholar]


