Abstract
Objectives:
During a cone beam CT scan, the patient is in an upright or supine position. This position depends on the brand and type of the scanner. The aims of this study are: (1) to investigate if the head position has an effect on cephalometric evaluation of the soft-tissue facial profile, comparing the recordings in natural head position (NHP) and supine head position (SHP) and (2) to investigate if age, gender and body mass index (BMI) are contributing factors to the effect of the head position.
Methods:
90 subjects were photographed in profile both in NHP and in SHP. 12 soft-tissue angular and linear cephalometric values were calculated. Two-way random intraclass correlation coefficients were calculated to determine observer reliability. Paired t-tests and linear regression analyses were performed to investigate the differences between the head positions and the influence of age, gender and BMI.
Results:
Intraobserver reliability was generally high. Paired t-tests showed significant changes as a result of head positioning (p < 0.0001) in 9 of the 12 measurements. These differences were small and clinically not relevant, except for the “lower face—throat angle”. Regression analysis revealed no relevant influence of age, gender and BMI.
Conclusions:
Cephalometric soft-tissue evaluation from a recording in SHP is generally reliable, except for the throat–chin area where a clinically relevant difference was found. The contour of the submandibular tissues in SHP causes the chin to appear more prominently. This can cause incorrect orthodontic diagnosis and treatment planning.
Keywords: cephalometry, cone beam CT, supine position, orthognathic surgery
Introduction
Cephalometric analysis plays an important role in orthodontic treatment planning. Cephalometric evaluation of the soft-tissue facial profile is used to determine which surgical modalities will lead to a favourable functional and aesthetic outcome, especially in more complex cases involving orthognathic surgery.1–3 It is recommended to record with the head in natural head position (NHP) for correct cephalometric evaluation.4 In complex cases, the use of a three-dimensional evaluation of the head using a cone beam CT (CBCT) scan can be justified as diagnostic means for treatment planning.5
These scans are made with the patient upright, standing or sitting, with the head in a vertical position or with the patient placed on a table in a supine position. If the head is in a vertical position, it should be stabilized to prevent motion during the scan. This is usually done with chinrests, headbands or other stabilizing devices. These stabilization measures lead to impingement of the soft tissues of the face, compromising treatment planning of facial aesthetics. This problem does not occur when using a CBCT scanner that records the patient in a supine position. NewTom 3G and 5G (NewTom Quantitative Radiology SLR, Verona, Italy) and the Myray Skyview machines (Cefla Dental Group, Imola, Italy) are examples of supine scanners. The head in these scanners is stabilized using a headrest, without impingement of stabilizing auxiliaries on the soft tissues of the face.
CBCT scans, vertically or horizontally taken, are not recorded in NHP. To perform cephalometric analysis, the volume can be reorientated to NHP using a photographic image taken in NHP.6 This reorientation and the subsequent cephalometric evaluation can only reliably be done when the soft-tissue facial profile is not changed as a consequence of recording in the supine head position (SHP). Some researchers claim that the drape of the soft tissues of the face is different when a patient is in a supine position.3 No proof was found for this statement.
The aim of this study is to investigate whether the soft-tissue facial profile, as evaluated with soft-tissue cephalometric analysis, is different for a subject when in NHP or when in SHP with a null hypothesis that there would be no difference. Should this hypothesis be falsified, one could anticipate that age might play a role, because with the years a change in structure of the face takes place. There also might be an effect influenced by gender because of differences in subcutaneous fat deposition between the sexes. Furthermore, the stoutness or slenderness of a person as expressed in the body mass index (BMI) is possibly also a factor to be considered because of a different composition of the subcutaneous tissues of the face. To study the effects on the facial tissues, it was not necessary to use X-ray exposure, instead photographs were used. This led to a study design where the paired soft-tissue cephalometric measurements in two modalities are compared (recording in two head positions: NHP and SHP). Subsequently, we engaged three independent covariables for a regression analysis being age, gender and BMI.
Materials and methods
90 adult subjects were asked to participate. For inclusion in the study, they had to be adults and have their natural teeth. As landmarks on the soft-tissue facial profile were to be analysed, subjects with beards and moustaches were not included in this study. The subjects were informed about the procedure and signed a consent form. Gender, age, length and weight of the participating subjects were all recorded according to their own statements. The BMI was calculated from the given length and weight. The group consisted of 46 males and 44 females. The characteristics of the subjects are specified in Table 1.
Table 1.
Characteristics of the subjects
| n = 90, ♂46, ♀44 | Mean |
SD |
Range |
|||
| ♂ | ♀ | ♂ | ♀ | ♂ | ♀ | |
| Age (in years) | 40.9 | 38.1 | 13.6 | 12.7 | 20.2–64.6 | 19.6–64.0 |
| BMI | 25.7 | 23.9 | 3.7 | 4.1 | 18.9–35.1 | 17.3–33.0 |
BMI, body mass index (weight in kilograms divided by height in square metres); SD, standard deviation.
Photographic recordings in profile were made of the subjects in SHP and in NHP. The order in which the two photographs were taken was randomized. To take the photograph in NHP, the subject was asked to stand straight and look in a vertical mirror at a distance of 2.20 m, with teeth in habitual occlusion and lips relaxed. Instruction was given to tilt the head upwards and downwards until the subject felt there was a balanced position of the head.7 To prevent the subject having the head tilted to the left or right, a standardization aid as described by Cooke8 was placed in front of the patient. It consisted of a plumb line hanging from the ceiling, which divided the head of the subject visually into two parts.
To take the photograph in SHP, the subject was placed on a table, with the head in a headrest of a NewTom CBCT scanner (NewTom Quantitative Radiology SLR, Verona, Italy). This photograph in SHP was taken after 2.5 min in this position, consistent with the average time that is needed to position the patient in a NewTom 5G CBCT machine. This was done to match the conditions with true scanning conditions. This time was based on the average time needed in 35 consecutive CBCT scans taken with the NewTom 5G at the Radiology Department of Academic Center for Dentistry Amsterdam, Amsterdam. The subject was asked to look up vertically at the ceiling, with lips relaxed and teeth in habitual occlusion.
The images were acquired with a Digital SLR camera (Canon EOS 350D Digital with a portrait lens Canon EF 100 mm F/2.8 L Macro IS USM, Canon Corp., Tokyo, Japan). The camera was mounted on a tripod at a fixed distance of 3.5 m to the subject. The height of the camera was adjusted to be at the same height as the facial profile of the subject to make sure the facial profile was recorded at a right angle to the transverse plane.
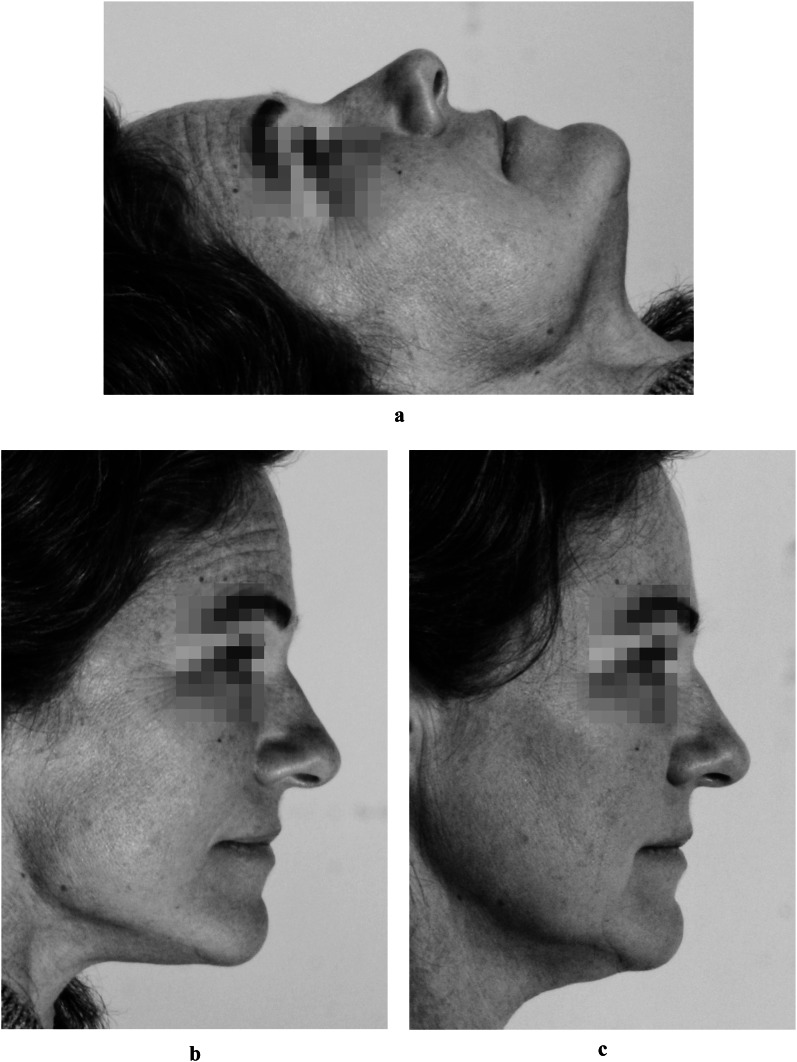
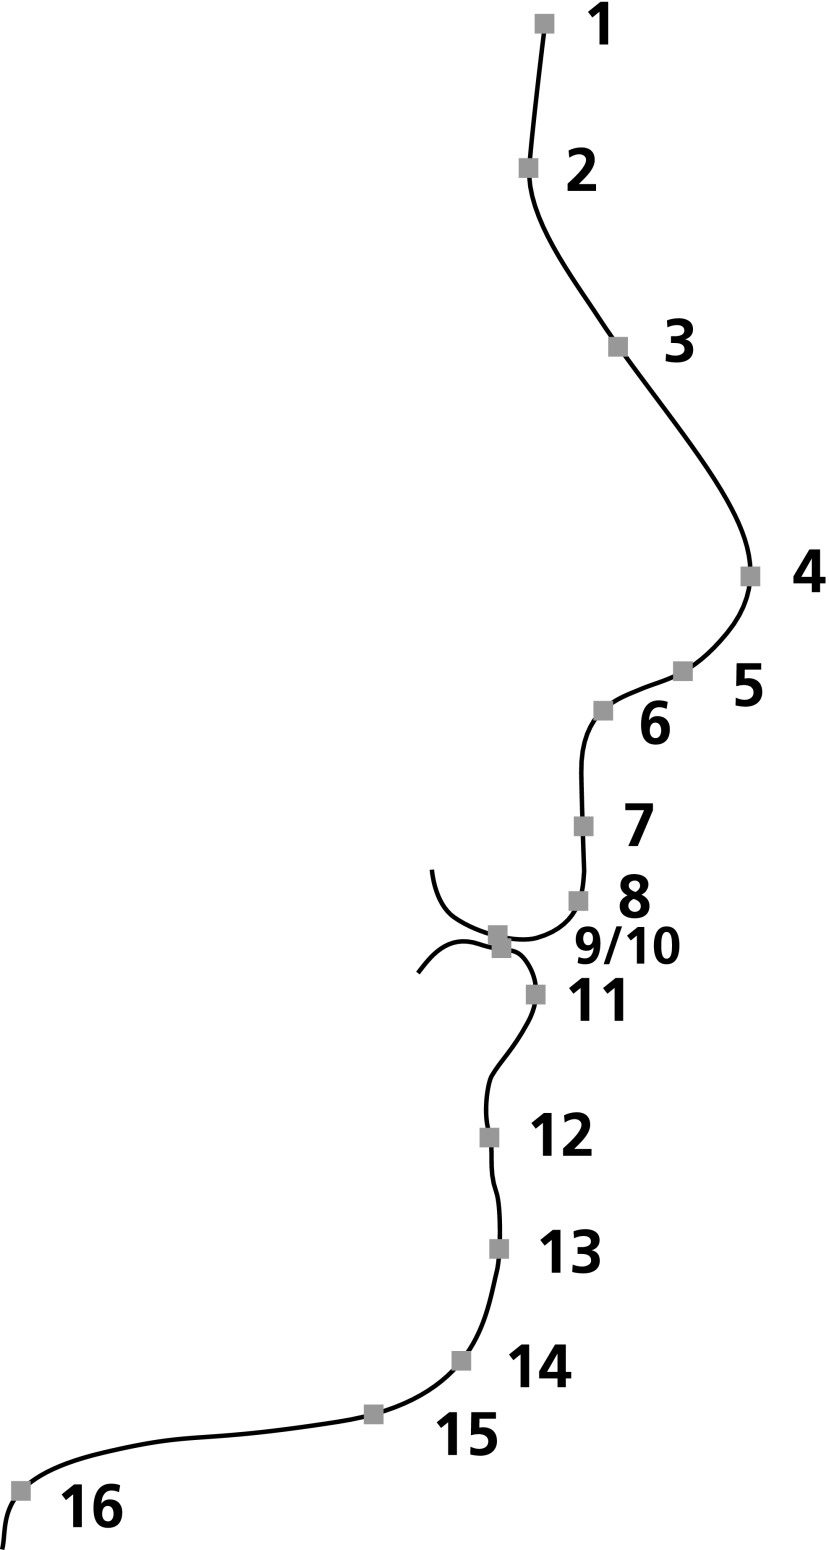
The acquired images were stored as Joint Photographic Experts Group (JPEG) image files and were cropped, and rotated using Microsoft Office Picture Manager SP3 (Microsoft, Seattle, WI) to make them all vertically oriented portraits (Figure 1). The images were then imported in cephalometric analysis software (Dolphin Imaging v. 10.5, Dolphin Imaging and Management Solutions, Los Angeles, CA), and the soft-tissue profile outline was traced with a computer mouse on screen defining 16 landmarks (Figure 2). 12 measurements based exclusively on these soft-tissue landmarks were generated (Figures 3 and 4).
Figure 1.
(a) Portrait of a subject in supine head position; (b) same portrait rotated 90°; (c) portrait of the same subject as in 1a,b taken in NHP
Figure 2.
Soft-tissue landmarks used in this study. Cephalometric landmarks used in this study starting cranially: 1, soft-tissue Glabella; 2, soft-tissue nasion; 3, bridge of nose; 4, tip of nose; 5, columella; 6, subnasale; 7, soft-tissue A point; 8, upper lip; 9, stomion superius; 10, stomion inferius; 11, lower lip; 12, soft-tissue B point; 13, soft-tissue pogonion; 14, soft-tissue gnathion; 15, soft-tissue menton; and 16, throat point
Figure 3.

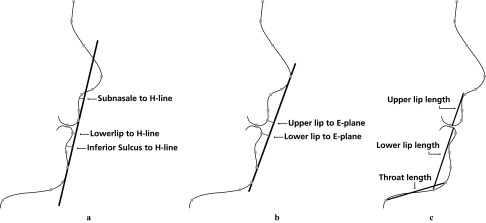
Linear cephalometric measurements used in this study. (a) Linear measurements of distances in mm of points “inferior sulcus”, “lower lip” and “subnasale” to the H-line (the line through “soft-tissue pogonion” and “upper lip”). (b) Linear measurements of distances in mm of points “lower lip” and “upper lip” to E-plane (the plane through points soft-tissue pogonion and “tip of nose”). (c) Linear measurements in mm of “throat length” (distance between “throat point” and “soft-tissue gnathion”), “upper lip length” (distance between “subnasale” and “stomion superius”) and “lower lip length” (distance between “stomion inferius” and “soft-tissue menton”
Figure 4.
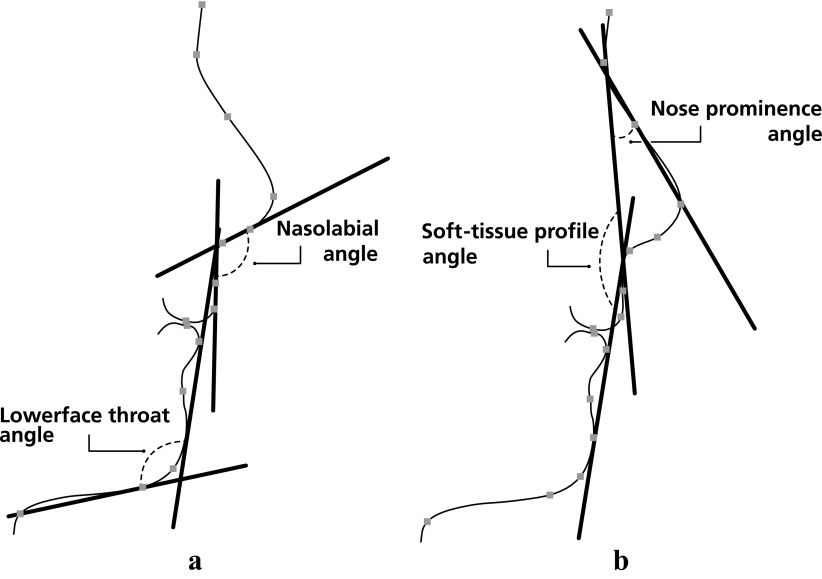
Angular cephalometric measurements used in this study. (a) Angular measurements of “nasolabial angle” (the angle between “columella”, “subnasale” and “upper lip”) and “lower face–throat angle” (the angle between the line through “subnasale” to “soft-tissue gnathion” and the line through “soft-tissue menton” to “throat point”). (b) Angular measurement of “nose prominence angle” (the angle between “tip of nose”, “soft-tissue nasion” and “subnasale”) and “soft-tissue profile angle” (the angle between “soft-tissue nasion”, “subnasale” and “pogonion”)
10 randomly selected images were remeasured twice with at least 24 h intervals. This, together with the original measurements, resulted in 3 sets of the 12 variables of 10 images. These data were used for the intraexaminer reliability by calculating a two-way random intraclass correlation coefficient (ICC). A value of 0.9 or higher was considered to signify reliability.
To test the null hypothesis (no difference in mean in the cephalometric evaluation of the soft-tissue facial profile between the two modalities, NHP and SHP) paired t-tests were performed. A linear regression analysis was performed to investigate the contribution of the independent variables: gender, age and BMI to the differences in measurement. Statistical analysis was performed using SPSS® v. 18.0 (SPSS Inc., Chicago, IL). Significance was assumed when p < 0.05.
Results
Intraclass correlation coefficients
Intraexaminer reliability was calculated by using a two-way random ICC. For 11 of the 12 variables, the ICC shows a high reliability of the measurements, as they were above 0.93. Only the variable “nose prominence angle” showed an ICC below 0.90 (being 0.863).
Paired t-test
In Table 2, the mean values of the paired statistics are presented. Considering the linear measurements, the absolute mean differences vary between 0.29 mm and 1.26 mm. The angular measurements show mean differences between 0.70° and 5.35°. In supine position, the upper lip is 0.73 mm more backward. There is also a vertical effect on the lips in supine position: the landmarks “stomion superius” and “stomion inferius” are allocated circa 1.2 mm more cranially. The largest angular difference is seen in the value “lower face–throat angle”, which diminishes more than 5° when changing from NHP to SHP.
Table 2.
Paired statistics
| Value of measurement in SHP minus value in NHP |
|||||
| Cephalometric soft-tissue variables |
Mean difference | SD | t | Significance (two-tailed) | |
| Distance in mm | Subnasale to H line | −0.7378 | 1.0543 | −6.639 | p < 0.001 |
| Lower lip to H line | 0.2922 | 0.7281 | 3.807 | p < 0.001 | |
| Inferior sulcus to H line | −0.5756 | 0.6935 | −7.873 | p < 0.001 | |
| Lower lip to E-plane | −0.1867 | 0.9220 | −1.921 | p = 0.058 | |
| Upper lip to E-plane | −0.7322 | 0.9046 | −7.679 | p < 0.001 | |
| Throat length | −0.8111 | 7.7672 | −0.991 | p = 0.325 | |
| Upper lip length | −1.1311 | 1.1328 | −9.472 | p < 0.001 | |
| Lower lip length | 1.2578 | 1.5295 | 7.802 | p < 0.001 | |
| Angle in degrees | Nasolabial angle | 1.0289 | 3.8190 | 2.556 | p = 0.012 |
| Nose prominence angle | 0.9556 | 1.2250 | 7.400 | p < 0.001 | |
| Soft-tissue profile angle | 0.6889 | 1.5693 | 4.165 | p < 0.001 | |
| Lower face–throat angle | −5.3478 | 5.5912 | −9.074 | p < 0.001 | |
These differences show a high significance of the mean differences for 9 of the 12 measurements (p < 0.001). Our hypothesis that head position has no influence on the cephalometric evaluation of the soft-tissue profile therefore must be rejected.
Regression analysis
Regression analyses were performed on the nine significantly changed variables. Two variables showed R2 around 11%. These were “subnasale to H-line” and “upper lip to E-plane”. They are significantly influenced by gender. The other seven variables showed a very small R2 (5% or lower), and there were no significances.
Discussion
9 of the 12 cephalometric soft-tissue variables showed statistically significant changes between the two head positions. The upper lip, although supported by the teeth, is 0.73 mm more posterior to the E-plane in SHP. The nasolabial angle increases by 1°, indicating a small but consistent effect of gravity. This can be seen in the vertical direction also, as “stomion inferius and superius” move upwards 1.2 mm when gravity stops pulling it down in SHP. The convexity of the profile is barely influenced (0.7°). The only substantial difference is seen for the lower face–throat angle, which changes over 5°. The angle between the submandibular contour and the lower face becomes more acute when a person is in a supine position compared with NHP.
The subjects were asked to assume their habitual occlusion during the photographic recording in the two head positions. It is possible that the habitual occlusion is different in NHP and SHP. The study design, without radiographic recording of the hard tissues, does not make it possible to verify if this is the case. The reported differences do not suggest a more posterior positioned chin, but it is possible that this effect plays a role.
To make a statement about the clinical relevance of these differences, they have to be compared with inherent errors in cephalometrics. Regarding hard-tissue landmarks, Baumrind and Frantz have reported median errors of 1.5 mm for linear measurements and of 1.5° for angular measurements.9,10 Wisth and Böe11 compared the reliability of hard- and soft-tissue landmarks and found them to be comparable. These reliability studies were done when tracing was executed with pencil and acetate foil. Yu et al12 investigated landmark identification on monitors that displayed cephalometric images (as was done in this study) and concluded that these were as reliable as the traditional tracing method.
This implies that the effects of head position on the soft-tissue facial profile are well within the margins of error of cephalometric evaluation, and thus cannot be regarded as clinically relevant, except for the change of 5.35° of the lower face–throat angle. Recording in SHP makes the chin appear more prominent. This is relevant when planning for orthognathic surgery. The decision of which jaw to advance or set back and by what distance is influenced by the evaluation of the chin position. This effect of head positioning during imaging might lead to an erroneous surgical planning and an unfavourable outcome for the patient. Such planning of treatment on compromised diagnostic data can be avoided by judging the chin–throat area with a recording of the facial profile made in NHP.
The regression analysis revealed no effect of age and BMI on the differences caused by head positioning. Gender was found to affect the paired statistics of two linear measurements, but these were small and without clinical relevance by themselves. This implies that age, gender and BMI do not play a relevant role in the effect of head position on the soft-tissue facial profile.
In conclusion, significant differences are found in cephalometric soft-tissue evaluation depending on the head position while recording. However, these differences are clinically irrelevant, except for the value of the chin–throat angle. This angle measures >5° more acute when recorded in supine position, suggesting a more prominent chin. This can influence the planning of orthognatic surgery and thereby compromise the result of the procedure for the patient. To avoid this, the authors advise to assess the chin–throat area with a complementary (photographic) recording in NHP.
References
- 1.Sarver D. Esthetic orthodontics and orthognathic surgery. St. Louis, MO: Mosby; 1998 [Google Scholar]
- 2.Arnett GW, Jelic JS, Kim J, Cummings DR, Beress A, Worley CM, Jr, et al. Soft tissue cephalometric analysis: diagnosis and treatment planning of dentofacial deformity. Am J Orthod Dentofacial Orthop 1999; 116: 239–253 [DOI] [PubMed] [Google Scholar]
- 3.McCollum AGH, Evans WG. Facial soft tissue: the alpha and omega of treatment planning in orthognathic surgery. Semin Orthod 2009; 15: 196–216 [Google Scholar]
- 4.Proffit WR, Ackerman RJ. Orthodontic diagnosis: the development of a problem list. In: Proffit WR, editor. Contemporary orthodontics. 3 edn St. Louis, MO: Mosby; 2000. pp. 147–176 [Google Scholar]
- 5.European Commission Cone beam CT for dental and maxillofacial radiology. Radiation protection no. 172. Evidence-Based Guidelines. Luxembourg: Office for Official Publications of the European Communities, 2012 [Google Scholar]
- 6.Dvortsin DP, Ye Q, Pruim GJ, Dijkstra PU, Ren Y. Reliability of the integrated radiograph-photograph method to obtain natural head position in cephalometric diagnosis. Angle Orthod 2011; 81: 889–894 doi: 10.2319/010411-2.1 [DOI] [PMC free article] [PubMed] [Google Scholar]
- 7.Solow B, Tallgren A. Natural head position in standing subjects. Acta Odontol Scand 1971; 29: 591–607 [DOI] [PubMed] [Google Scholar]
- 8.Cooke MS. Five-year reproducibility of natural head posture: a longitudinal study. Am J Orthod Dentofacial Orthop 1990; 97: 489–494 [DOI] [PubMed] [Google Scholar]
- 9.Baumrind S, Frantz RC. The reliability of head film measurements. 1. Landmark identification. Am J Orthod 1971; 60: 111–127 [DOI] [PubMed] [Google Scholar]
- 10.Baumrind S, Frantz RC. The reliability of head film measurements. 2. Conventional angular and linear measures. Am J Orthod 1971; 60: 505–517 [DOI] [PubMed] [Google Scholar]
- 11.Wisth PJ, Böe OE. The reliability of cephalometric soft tissue measurements. Arch Oral Biol 1975; 20: 595–599 [DOI] [PubMed] [Google Scholar]
- 12.Yu S-H, Nahm D-S, Baek S-H. Reliability of landmark identification on monitor-displayed lateral cephalometric images. Am J Orthod Dentofacial Orthop 2008; 133: 790.e1–790.e6 [DOI] [PubMed] [Google Scholar]


