Abstract
Objectives:
To investigate the custom and practice of private dental implant practitioners in the north-west of England when planning imaging methods prior to implant placement in the symphyseal region of the edentulous mandible. To gain an understanding of decision-making when prescribing imaging methods.
Methods:
A web-based questionnaire presented two realistic clinical scenarios. Both were of edentulous patients for whom implant-retained lower complete dentures were planned. A mixed mode survey methodology was employed.
Results:
169 dentists were surveyed with an 80% response rate. The results showed no agreement on prescription of imaging methods. Those in the 0–10 years qualified group were significantly associated with the prescription of three-dimensional (3D) imaging. Implant practitioners who place more than 100 implants per year were significantly associated with the non-use of imaging guides and prescription of the same view for both cases. The sample as a whole, however, changed their prescription according to the case difficulty. Those who have a cone beam CT machine available were more likely to use 3D imaging regardless of the difficulty of the case.
Conclusions:
Existing guidelines are open to interpretation and could be construed to support a range of imaging choices. Training in dental implantology may leave dentists to make their own judgements about selection criteria. The idiosyncratic nature of independent dental practice may be an important factor in the chaotic pattern of prescriptions. There is a need for widely disseminated, evidence-based selection criteria for imaging prior to dental implantology which are clear and specific.
Keywords: dental implants, radiography, dental, questionnaires, demography
Introduction
Implant-supported overdentures in the edentulous anterior mandible are considered the treatment of choice in many cases of severe or moderate alveolar resorption.1 For example, the provision of two implants in the lower canine regions with stud attachments can be a relatively simple way of addressing otherwise insoluble denture problems. The form of the anterior mandible varies greatly according to the degree and pattern of resorption. This can result in narrow, shallow or knife edge ridges which can complicate implant placement.2 Perforation of the lingual cortical plate during preparation for placement of dental implants has the potential to cause severe bleeding and a life-threatening upper airway obstruction.3 An appreciation of the form of the anterior mandible is required in order to avoid such complications.4
Guideline documents on selection criteria for imaging prior to implant placement have been issued by several authorities.5-9 Notwithstanding, guidelines on selection of images for dental implantology are often non-specific, stated in vague terms and open to wide interpretation. For example, available guidelines state, “Cross-sectional imaging is often beneficial”,5 “selection criteria … must be used in the light of each patient's individual needs”,6 “Clinical judgment as to need for and type of radiographic images for evaluation”,7 “The decision to proceed to cross-sectional imaging should be based on clearly identified needs and the clinical and surgical requirements of the clinicians involved”9 and “the information provided by cross-sectional imaging may be of more importance to some practitioners than to others”.8 Therefore, the available guidelines could be interpreted to support a wide range of prescriptions.
A review of the literature revealed no questionnaire studies which investigate custom and practice when planning imaging methods prior to implant placement in the symphyseal region of the edentulous mandible. The aim of this study was to investigate the custom and practice of private dental implant practitioners in the north-west of England when planning imaging methods prior to implant placement in the symphyseal region of the edentulous mandible and to gain an understanding of decision-making when prescribing imaging methods.
Materials and methods
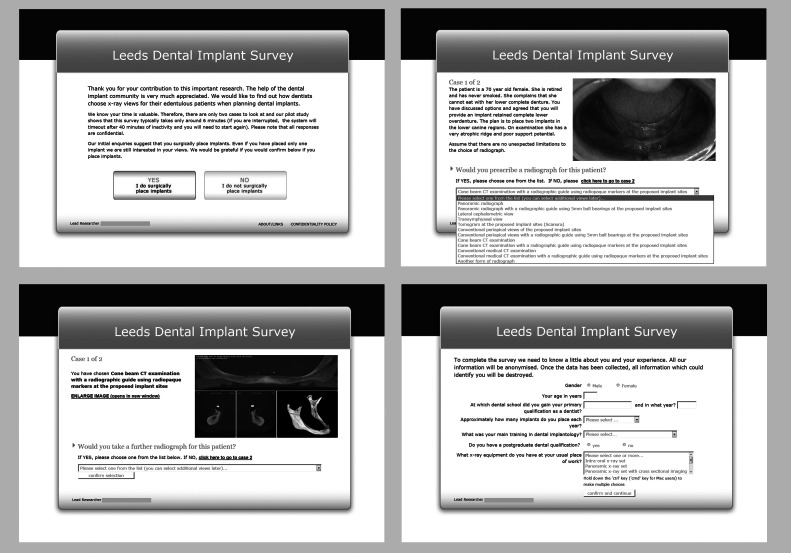
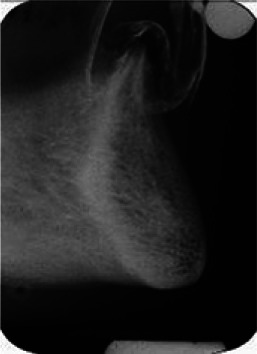
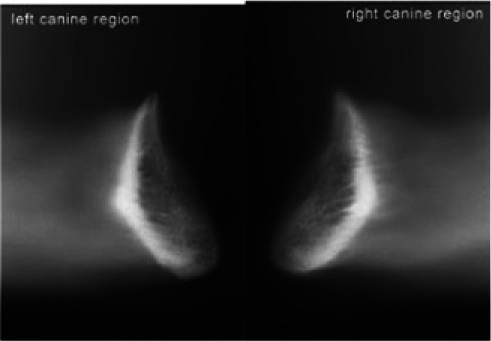
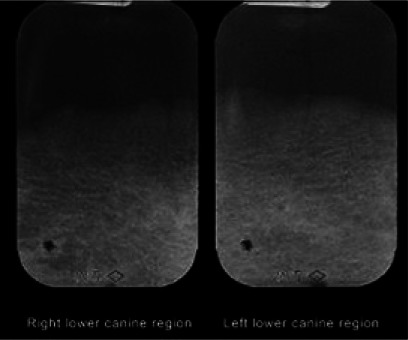
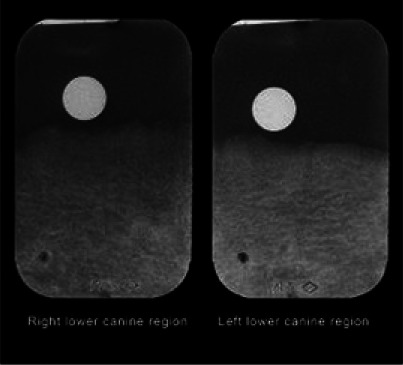
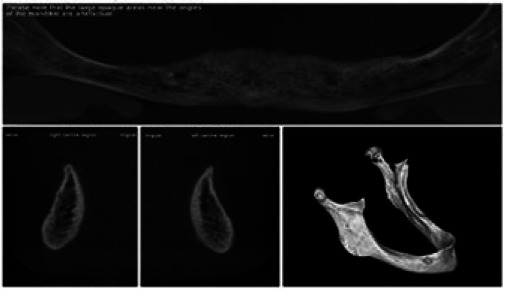
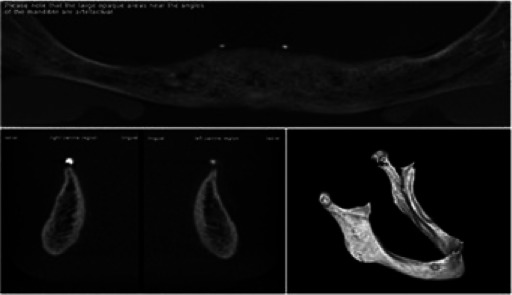
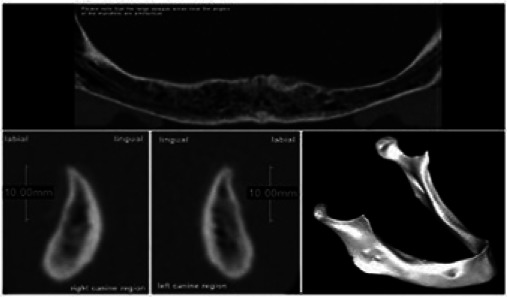
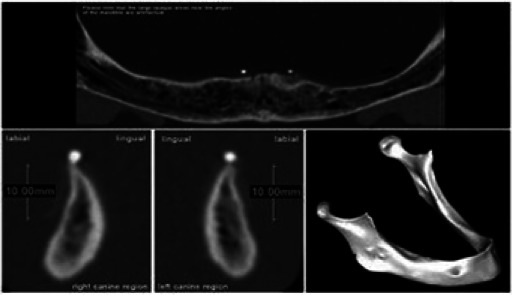
A questionnaire study was planned employing the principles described previously.10 A web-based questionnaire was developed to present two fictional, but realistic, clinical scenarios to respondents. Both scenarios were of edentulous patients for whom implant-retained lower complete dentures were planned. Implants were to be placed in both lower canine regions. One case had an atrophic lower edentulous alveolar ridge (Case 1). The other had a well-formed lower edentulous alveolar ridge (Case 2). For each scenario, there was a clinical description, a clinical photograph and a choice of 11 radiographic images. Table 1 lists the images available for selection, the equipment used to produce the images and the presentation in each case. The respondents would assess each scenario and make their first image selection. The image would then be shown to them. They were then asked if they would like to prescribe a further image. If so, the second choice of image would be shown and they would be asked again if they wished to prescribe a further image. This process was repeated until the respondent had completed their prescription. In this way, the sequence of imaging decisions could be recorded for each respondent. The respondents were also allowed a free text box to describe any imaging methods that were not offered. Pages from the web-based questionnaire are presented in Figure 1.
Table 1. The images available for selection, the equipment used to produce the images and the presentation in each case.
| Imaging technique | Machine | Presentation | Images Case 1 | Images Case 2 |
| Panoramic radiograph | CRANEX® 3 Ceph (Soredex, Tuusula, Finland) | Single, digital panoramic image |  |
 |
| Panoramic radiograph with an imaging guide using 5 mm ball bearings at the lower canine regions | CRANEX 3 Ceph | Single, digital panoramic image |  |
 |
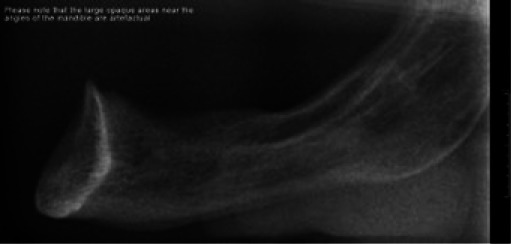
| Lateral cephalometric view | CRANEX 3 Ceph | Single digital image | 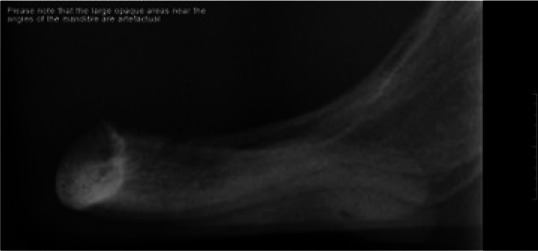 |
 |
| Transymphyseal view23 | Trophy Atlantis X-ray set | Digital scan of single conventional image | 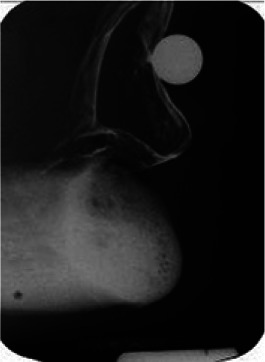 |
 |
| Conventional tomograms at the lower canine regions | Scanora (Soredex) | Digital scans of conventional cross-sectional images at the lower canine regions | 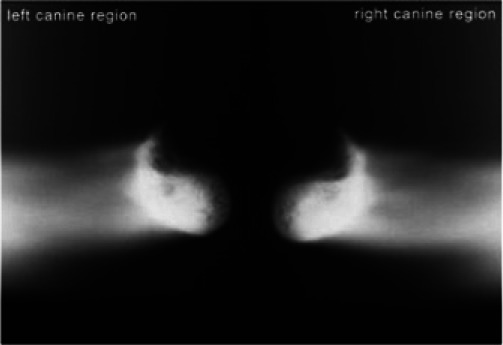 |
 |
| Conventional periapical views of the lower canine regions | Trophy Atlantis X-ray set [Trophy Radiologie (UK) Ltd, Kent, UK] | Digital scans of conventional periapical images at the lower canine regions | 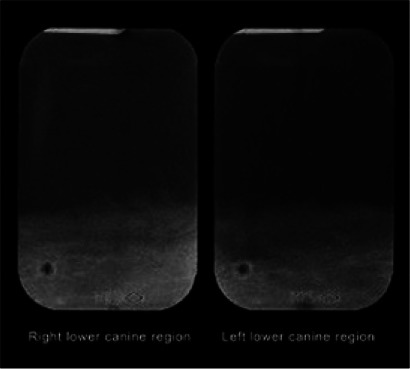 |
 |
| Conventional periapical views with an imaging guide using 5 mm ball bearings at the lower canine regions | Trophy Atlantis X-ray set | Digital scans of conventional periapical images at the lower canine regions | 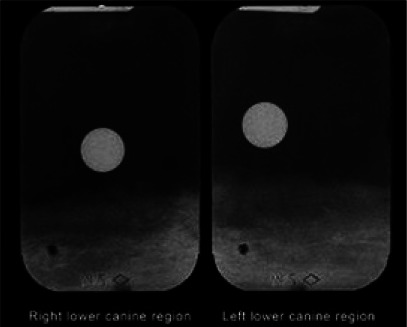 |
 |
| Cone beam CT examination | 3D Accuitomo (J. Morita Corporation, Tokyo, Japan) | Panoramic reconstruction, cross-sections at lower canine regions and 3D reconstruction of mandible | 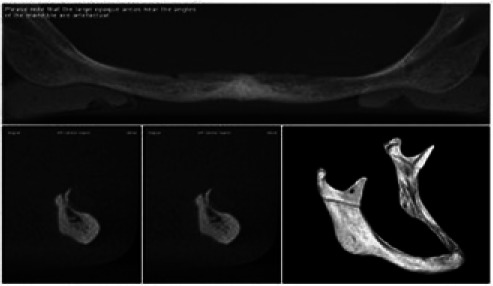 |
 |
| Cone beam CT examination with an imaging guide using radio-opaque markers at the lower canine regions | 3D Accuitomo | Panoramic reconstruction, cross-sections at lower canine regions and 3D reconstruction of mandible (Figure 1) | 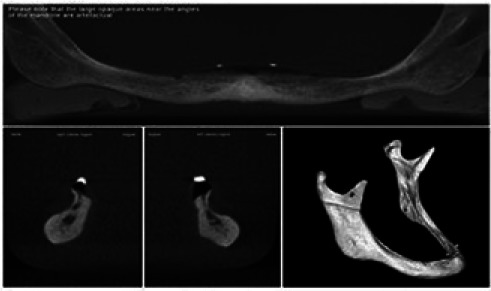 |
 |
| Medical (multislice) CT examination | GE LightSpeed (GE Healthcare, Waukesha, WI) | Panoramic reconstruction, cross-sections at lower canine regions and 3D reconstruction of mandible | 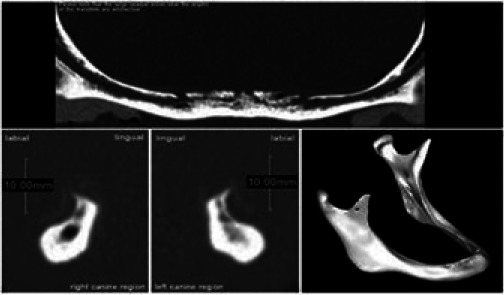 |
 |
| Medical (multislice) CT examination with an imaging guide using radio-opaque markers at the lower canine regions | GE LightSpeed | Panoramic reconstruction, cross-sections at lower canine regions and 3D reconstruction of mandible | 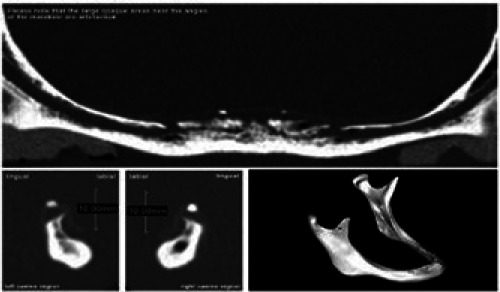 |
 |
3D, three dimensional.
Figure 1.
Pages from the web-based questionnaire
To acquire the images, two mandibles were obtained from private historical collections. These were used in X-ray phantoms to allow repeated exposures for the 11 different views. The patients for the clinical photographs were chosen so that their photographs represented a realistic match to the two mandibles. The X-ray phantoms consisted of containers in the stylized form of the lower half of the head and the neck and contained water as a soft-tissue equivalent. They allowed a human spine and mandible to be positioned within them. Details of the X-ray phantom have been previously published.11
Web developers were engaged to produce a web-based questionnaire. The questionnaire included presentation of the two clinical cases and requests for additional information as follows: “Male/female”, “Your age in years?”, “Where did you qualify?”, “What year did you qualify?”, “Approximately how many implants do you place each year?”, “What was your main training in dental implantology?”, “Do you have post-graduate qualifications?”, and “What X-ray equipment do you have at your usual place of work?”. A data file was compiled on a remote server as responses were received. The responses were recorded anonymously, using only access codes that had been allocated to the respondents. The data file was checked periodically for responses and finally downloaded onto a personal computer for analysis.
The population was defined as practice-based dental implant practitioners in the north-west of England. A strategy was devised to compile a sample frame which was as close as reasonably possible to the real population of practitioners who surgically place dental implants. This involved a number of overlapping searches from different sources such as business directories, web sites and published membership lists of dental societies. This process was repeated with different sources until no further additional implant practitioners were found and it was felt that the list was as complete as it could reasonably be. This method produced a sample frame size of 208.
The sample size was calculated using the equation of Dillman et al.12 Precision was selected as ±5% and the confidence level as 95%. The most conservative assumption for response distribution is 50% and this was also selected. This calculation yielded a sample size of 135. A previous study suggested that a realistic response rate for a sample of this size would be some 80%.10 Therefore, the target sample size was adjusted to allow for an 80% response rate giving a final sample size of 169. This sample was selected from the sample frame using a random number generator.
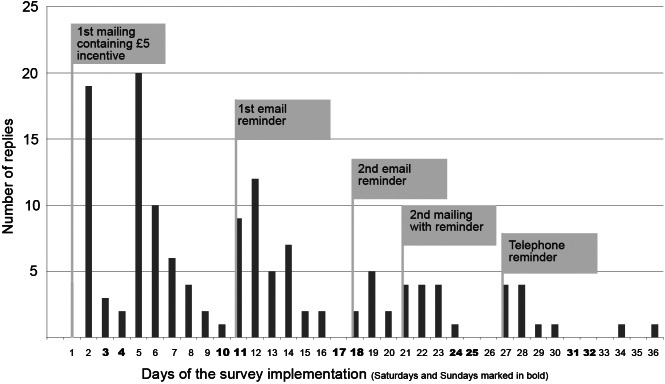
The survey was conducted using a mixed mode methodology. The survey was open for 36 days. On 10 November 2011 an initial letter was posted which contained a £5 incentive. Reminder e-mails followed on 20 November 2011 and 27 November 2011. A reminder letter was posted on 30 November 2011 and final telephone reminders were made on 6 December 2011. The survey was closed on 15 December 2011.
A post-survey telephone questionnaire of non-responders was carried out to assess the direction and magnitude of any non-response bias using a protocol described by Locker.13 An attempt was made to contact all of the non-responders. Those who responded were asked to describe their imaging protocol for an edentulous patient, with good alveolar ridges, prior to implant placement in the anterior edentulous mandible. This was the same question as that asked for the second case on the web-based questionnaire. This enabled a comparison of the responses by the “response” group and the “non-response” group and, therefore, an assessment of the direction and magnitude of non-response bias.
Prior to full implementation of the study, a pilot study was conducted to evaluate the online questionnaire and the associated questionnaire procedures. A convenience sample of 12 practitioners was drawn from parts of England other than the north-west in order to avoid possible future bias in the main study.
Ethics approval for this study was given by the University of Leeds Dental Research Ethics Committee. Written, informed consent was kindly given by the patients whose photographs were used in the questionnaire.
Data were inputted into Predictive Analytics Software (PASW) statistics v. 18.0 (formerly SPSS®; SPSS Inc., Chicago, IL). Descriptive statistics were prepared. Analysis was carried out using confidence intervals (CIs) for the differences between proportions. Association between variables was examined by cross-tabulations, and their significance determined by analysis with Pearson's χ2 test. Null hypotheses were tested as follows: there is no significant difference in the imaging strategy of dentists in relation to case difficulty, there are no significant differences in the use of three-dimensional (3D) imaging and conventional radiography in relation to the demographic variables, there is no significant difference in the use of initial conventional radiography prior to 3D imaging in relation to the demographic variables and, finally, there is no significant difference in the use of imaging guides in relation to the demographic variables. Statistical significance was set at a p-value less than 0.05. Where multiple variables were found to be significant, logistic regression was used as a secondary analysis to identify the strongest predictors.
Results
There were 138 responses from a total of 169 in the sample. There were, however, three ineligible responses. These members of the sample had been incorrectly identified as surgically placing dental implants. Response rate calculations are presented in Table 2. There were no instances of “item non-response”13 because the website would not allow the survey to be completed unless all questions were answered.
Table 2.
Response and response rate calculation
| Sample frame | 208 |
| Sample size calculation according to Dillman et al12 | 135 |
| Invitations to participate sent out to account for an 80% response rate | 169 |
| Responses received | 138 |
| Number of ineligible responses | 3 |
| Response rate according to Kviz24 | 81.3% |
| (Number of completed questionnaires/number of eligible sample members) | (138 – 3/169 – 3) |
| Completion rate according to Kviz24 | 79.9% |
| (Number of completed questionnaires/sample size) | (138 – 3/169) |
| Response rate according to Asch et al25 | 81.7% |
| (Number of surveys returned/number of surveys distributed) | 138/169 |
A graph of response over each of the 36 days of implementation of the survey is presented in Figure 2. It can be seen how each new contact was timed to coincide with declining response. The demographic data of the responders are presented in Table 3. Their image prescriptions are presented in Table 4 (Case 1, atrophic edentulous ridge) and Table 5 (Case 2, well-formed edentulous ridge).
Figure 2.
Bar chart to show daily response for the period of the survey
Table 3.
Demographic data
| Gender | ||
| Male | 89.6% | n = 121 |
| Female | 10.4% | n = 14 |
| Age | ||
| Mean age | 46.1 years | SD 9.2 |
| Range | 26–66 years | |
| Number of years qualified | ||
| Mean | 22.2 years | SD 9.7 |
| Range | 3–44 years | |
| Years qualified groups | ||
| 0–10 years | 14.8% | n = 20 |
| 11–20 years | 28.1% | n = 38 |
| 21–30 years | 36.3% | n = 49 |
| 31–40 years | 18.5% | n = 25 |
| 41–50 years | 2.2% | n = 3 |
| Dental school of first qualification as a dentist | ||
| Manchester | 30.4% | n = 41 |
| Liverpool | 23.0% | n = 31 |
| Sheffield | 6.7% | n = 9 |
| Leeds | 5.9% | n = 8 |
| Birmingham | 5.9% | n = 8 |
| Newcastle | 4.4% | n = 6 |
| London | 4.4% | n = 6 |
| Dundee | 4.4% | n = 6 |
| Other UK schools | 6.7% | n = 9 |
| Non-UK schools | 8.1% | n = 11 |
| Number of implants placed per year | ||
| 1–20 | 34.8% | n = 47 |
| 20–50 | 25.2% | n = 34 |
| 50–100 | 17.8% | n = 24 |
| >100 | 22.2% | n = 30 |
| Main training in dental implantology | ||
| Independently run course | 46.7% | n = 63 |
| University course | 33.3% | n = 45 |
| FGDP(UK) | 8.9% | n = 12 |
| Manufacturer's course | 5.2% | n = 7 |
| Mentoring by a colleague | 3.0% | n = 4 |
| Other | 3.0% | n = 4 |
| Imaging equipment available | ||
| Intraoral set | 79.3% | n = 107 |
| Panoramic machine | 67.4% | n = 91 |
| CBCT machine | 10.4% | n = 14 |
| Panoramic machine with | ||
| cross-sectional imaging | 7.4% | n = 10 |
| Lateral cephalostat | 6.7% | n = 9 |
| Medical CT machine | 1.5% | n = 2 |
| Has post-graduate qualifications | ||
| Yes | 63.0% | n = 85 |
| No | 37.0% | n = 50 |
CBCT, cone beam CT; FGDP(UK), Faculty of General Dental Practice of the Royal Collage of Surgeons of England; SD, standard deviation.
Table 4.
Image prescriptions for Case 1, the atrophic edentulous ridge
| 1st selection | 2nd selection | 3rd selection | 4th selection |
| PAN+ n = 45 | CBCT+ n = 9 | ||
| 33.33% | 6.7% | ||
| PA+ n = 8 | PA n = 1 | ||
| 6.0% | 0.7% | ||
| TS n = 1 | |||
| 0.7% | |||
| PA n = 2 | PA+ n1 | ||
| 1.5% | 0.7% | ||
| CBCT n = 2 | |||
| 1.5% | |||
| LCeph n = 1 | |||
| 0.7% | |||
| TS n = 1 | |||
| 0.7% | |||
| PAN n = 29 | PA+ n = 2 | TS n = 1 | CBCT n = 1 |
| 21.48% | 1.5% | 0.7% | 0.7% |
| PA n = 2 | CBCT+ n = 1 | ||
| 1.5% | 0.7% | ||
| PAN+ n = 3 | |||
| 2.2% | |||
| SCAN n = 1 | |||
| 0.7% | |||
| MCT+ n = 1 | |||
| 0.7% | |||
| CBCT n = 1 | |||
| 0.7% | |||
| CBCT+ n = 4 | |||
| 0.7% | |||
| CBCT+ n = 36 | PA+ n = 4 | Scanora n = 1 | OCC n = 1 |
| 26.7% | 3.0% | 0.7% | 0.7% |
| CBCT n = 12 | |||
| 8.9% | |||
| MCT+ n = 5 | |||
| 3.7% | |||
| NoRad n = 2 | |||
| 1.5% | |||
| PA+ n = 2 | PAN+ n = 2 | ||
| 1.5% | 1.5% | ||
| LCeph n = 1 | PAN n = 1 | ||
| 0.7% | 0.7% | ||
| MCT n = 1 | |||
| 0.7% | |||
| SCAN n = 1 | MCT+ n = 1 | ||
| 0.7% | 0.7% | ||
| TS n = 1 | PAN+ n = 1 | CBCT+ n = 1 | |
| 0.7% | 0.7% | 0.7% |
CBCT, cone beam CT examination; CBCT+, cone beam CT examination with a radiographic guide using radio-opaque markers at the proposed implant sites; LCeph, lateral cephalometric view; MCT, medical (multislice) CT examination; MCT+, medical CT examination with a radiographic guide using radio-opaque markers at the proposed implant sites; NoRad, no image was prescribed; OCC, an occlusal radiograph selected by respondents in the free text section; PA, conventional periapical views of the proposed implant sites; PA+, conventional periapical views with a radiographic guide using 5 mm ball bearings at the proposed implant sites; PAN, panoramic radiograph; PAN+, panoramic radiograph with a radiographic guide using 5 mm ball bearings at the proposed implant sites; SCAN, conventional tomograms at the proposed implant sites; TS, transymphyseal view.
Table 5.
Image prescriptions for Case 2, the well-formed edentulous ridge
| 1st selection | 2nd selection | 3rd selection |
| PAN+ n = 52 | PA+ n = 7 | TS n = 1 0.7% |
| 38.52% | 5.2% | |
| CBCT+ n = 3 | ||
| 2.2% | ||
| TS n = 2 | ||
| 1.5% | ||
| LCeph n = 1 | ||
| 0.7% | ||
| PA n = 1 | ||
| 0.7% | ||
| SCAN n = 1 | ||
| 0.7% | ||
| OCC n = 1 | ||
| 0.7% | ||
| MCT n = 1 | ||
| 0.7% | ||
| PAN n = 30 | CBCT+ n = 3 | |
| 22.22% | 2.2% | |
| PAN+ n = 3 | ||
| 2.2% | ||
| LCeph n = 1 | ||
| 0.7% | ||
| PA+ n = 1 | ||
| 0.7% | ||
| PA n = 1 | ||
| 0.7% | ||
| CBCT+ n = 29 | PA+ n = 2 | |
| 21.48% | 1.5% | |
| PAN n = 1 | ||
| 0.7% | ||
| CBCT n = 11 | ||
| 8.1% | ||
| MCT+ n = 5 | ||
| 3.7% | ||
| PA+ n = 3 | PAN+ n = 1 | |
| 2.2% | 0.7% | |
| NoRad n = 3 | ||
| 2.2% | ||
| MCT n = 1 | ||
| 0.7% | ||
| SCAN n = 1 | ||
| 0.7% |
CBCT, cone beam CT examination; CBCT+, cone beam CT examination with a radiographic guide using radio-opaque markers at the proposed implant sites; LCeph, lateral cephalometric view; MCT, medical (multislice) CT examination; MCT+, medical CT examination with a radiographic guide using radio-opaque markers at the proposed implant sites; NoRad, no image was prescribed; OCC, an occlusal radiograph selected by respondents in the free text section; PA, conventional periapical views of the proposed implant sites; PA+, conventional periapical views with a radiographic guide using 5 mm ball bearings at the proposed implant sites; PAN, panoramic radiograph; PAN+, panoramic radiograph with a radiographic guide using 5 mm ball bearings at the proposed implant sites; SCAN, conventional tomograms at the proposed implant sites; TS, transymphyseal view.
An analysis was carried out to compare the use of 3D imaging for Case 1, the atrophic edentulous ridge, and Case 2, the well-formed ridge. The use of 3D imaging was defined as the use of either cone beam CT (CBCT) or medical CT (multislice CT) at any stage of the prescription. 75 dentists prescribed 3D imaging for Case 1 (proportion of sample = 0.55, 95% CI 0.47–0.64). 53 dentists prescribed 3D imaging for Case 2 (proportion of sample = 0.39, 95% CI 0.31–0.48). The difference in proportion of those prescribing 3D imaging for Case 1 and Case 2 was 0.16 with a 95% CI from 0.04 to 0.28.14 This difference was significant at the level of the 95% CI and, therefore, these results favour rejection of the null hypothesis that there is no significant difference in the imaging strategy of dentists in relation to case difficulty.
74 respondents prescribed the same view, or a combination of views in the same sequence, for both cases. Further investigation was of interest. A χ2 analysis was carried out to identify the demographic variables which were associated with the prescription of the same view for both cases. Significant positive associations were found with the following demographic variables: placed more than 100 implants per year [χ2(1) = 9.878, p = 0.002], CBCT machine available [χ2(1) = 6.021, p = 0.014], training—FGDP(UK) course [χ2(1) = 4.325, p = 0.038]. FGDP(UK) is the Faculty of General Dental Practice of the Royal College of Surgeons of England. As a secondary analysis, a logistic regression suggested that placing more than 100 implants per year was the only significant predictor for making the same prescription for both cases [p = 0.016, odds ratio (OR) = 3.436, 95% CI 1.256–9.400].
A χ2 analysis was carried out to test for associations between the demographic variables listed in Table 6 and the use or non-use of 3D imaging. For Case 1, significant positive associations were found with the following demographic variables: 0–10 years since dental qualification [χ2(1) = 8.244, p = 0.004], CBCT machine available [χ2(1) = 5.754, p = 0.016], has a post-graduate qualification [χ2(1) = 5.910, p = 0.015]. A significant negative association was found between prescription of 3D imaging and training by an independently run course [χ2(1) = 9.763, p = 0.002]. For Case 2, significant positive associations were found with the same demographic variables: 0–10 years since dental qualification [χ2(1) = 6.524, p = 0.011], CBCT machine available [χ2(1) = 10.123, p = 0.001], has a post-graduate qualification [χ2(1) = 4.222, p = 0.040]. A significant negative association was found between prescription of 3D imaging and training by an independently run course [χ2(1) = 9.519, p = 0.002]. In addition, a significant positive association was found between the use of 3D imaging for Case 2 and training by the FGDP(UK) course (p = 0.012). In this last case, Fisher's exact test was used because the cross-tabulation contained one cell with a count less than five.15 These results favour rejection of the null hypothesis that there are no significant differences in the use of 3D and conventional radiography in relation to the demographic variables. As secondary analyses, logistic regressions showed that being qualified for 0–10 years was the only significant predictor for prescribing 3D imaging for Case 1 (p = 0.043, OR = 3.976, 95% CI 1.047–15.093). For Case 2, the only significant predictor was the availability of a CBCT machine (p = 0.024, OR = 5.131, 95% CI 1.246–21.136).
Table 6.
Demographic variables included in the statistical analysis
| Descriptive |
| 1. Male or female |
| 2. UK or non-UK qualified |
| Experience |
| 3. Qualified from 0 to 10 years or not |
| 4. Placed more than 100 implants per year or not |
| Training |
| 5. Independently run course or not |
| 6. University course or not |
| 7. FGDP(UK) course or not |
| 8. Manufacturer's course or not |
| Equipment available |
| 9. Intraoral set or not |
| 10. Panoramic machine or not |
| 11. Cone beam CT machine or not |
| 12. Medical CT machine or not |
| 13. Lateral cephalogram or not |
| Qualifications |
| 14. Has post-graduate qualifications or not |
FGDP(UK), Faculty of General Dental Practice of the Royal College of Surgeons of England.
Those respondents who had prescribed conventional radiographs prior to prescription of 3D imaging were selected. 21 dentists (15.5%) followed this protocol for Case 1, and 7 (5.2%) for Case 2. χ2 analyses were carried out to identify if the demographic variables listed in Table 6 were associated with the prescription of conventional radiography before 3D imaging. No significant associations were found. These results favour acceptance of the null hypothesis that there is no significant difference in the use of initial conventional radiography prior to 3D imaging in relation to the demographic variables.
χ2 analyses were carried out to test for associations between the demographic variables listed in Table 6 and the use or non-use of imaging guides. For Cases 1 and 2, a significant negative association was found between prescription of imaging guides and placing more than 100 implants per year [Case 1, χ2(1) = 9.446, p = 0.002; Case 2, χ2(1) = 5.934, p = 0.015]. That is, those who place more than 100 dental implants per year were less likely to use imaging guides. These results favour rejection of the null hypothesis that there is no significant difference in the use of imaging guides in relation to the demographic variables.
There were 31 non-responders. Of these, 12 responded to the post-survey questionnaire, a response of 38.7%. The data from these 12 individuals were assumed to represent all the non-responders. These were added to the data from the responders to create a nominal data set for the whole of the eligible sample. New percentage totals for each view were then calculated and compared with those for the responders alone. The greatest difference between the actual and the adjusted figures was 4.1%, which was for the use of periapical radiographs. Other differences were typically around 1% or less. The sample size was, a priori, calculated for a precision of ±5%. Because the difference between the actual and adjusted percentages was within the intended precision of the survey, it was concluded that non-response bias was not significant and that post-survey adjustment of data was not required.
Discussion
The overwhelming majority of research into dental implantology is carried out in the university or hospital environment. The intention of this study was to investigate the practices of dentists in the practice environment, where the majority of dental implants are placed. An attempt was made to reproduce realistic clinical decision-making as far as possible. A web-based questionnaire was chosen so that plausible clinical scenarios could easily be presented to respondents. The photographs were of real patients and the available images were of real mandibles in realistic radiographic phantoms. By being web based, the questionnaire could be interactive. Respondents were shown each image that they had chosen. In this way they would be able to make a decision on whether further images were necessary based on the results of the first and subsequent selections. This also enabled the progression of prescribed images to be recorded. Analysis of the sequence was therefore possible. For example, those respondents who prescribed conventional radiography before making a decision to prescribe 3D imaging could be identified.
The effectiveness of multiple contacts can clearly be seen in Figure 2. Every contact was different. For example, the letters and e-mails each had different wording and took a different approach. Several response enhancement measures were employed. Dillman et al12 view survey response as a social exchange and consider response enhancement under four headings: personalization, increasing the benefits of participation, decreasing the costs of participation and establishing trust. In this study, commercially available mail merge software was used to produce personalized letters and e-mails. Every letter was personally signed by hand by the lead researcher. The use of the internet allows a very visual approach. The intention was that a visually based questionnaire which presented realistic dental implant cases would be an interesting one to the population of implant practitioners, thereby increasing the benefit of participation. The approach of asking for help was also felt to be valuable. People feel a sense of reward in helping others and this approach was taken in the contacts with respondents. The costs of participation were decreased by developing a questionnaire which was easy to complete with simple navigation and clear instructions. The audiovisual capabilities of the internet were used minimally and only if they led to simpler operation. The survey was kept as short as reasonably practical and was restricted to two cases. It was felt that a well-formed ridge case and an atrophic case would be sufficient variation in order to investigate implant practitioners' normal image prescription for lower edentulous cases. In order to establish trust, it was made clear that this research project was carried out under the auspices of the University of Leeds and the names of supervisors were clearly shown. A further way of establishing trust was to give the respondents confidence in their anonymity. The initial approach to participants was by letter and this allowed a monetary incentive of £5 to be sent in advance of completion of the questionnaire. Inclusion of the monetary incentive with the initial approach was felt to be very important. It has been demonstrated that promises to pay respondents on condition that they respond has little or no effect.16,17 Further, the level of the incentive is not as important as the gesture of trust itself.12 Therefore, an incentive of £5 was chosen as the smallest value paper banknote that could easily be sent by post.
The practitioner who surgically places dental implants in the north-west of England is typically male, has a post-graduate qualification and is in the second half of his career. He qualified at the University of Manchester and trained for dental implantology by taking an independently run course. He has a panoramic machine at his practice where he places fewer than 50 implants per year. This profile represents a snapshot in time and would be expected to change in the future.
The results show no agreement on image prescription prior to implant placement in the edentulous anterior mandible. Most respondents based their prescription around either panoramic radiography or CBCT. Supplementary views were then sometimes prescribed. In some instances, both panoramic and CBCT views were used. These largely inconsistent results may represent the idiosyncratic nature of independent dental practice. It might also be speculated that training for dental implantology, although dealing with the availability and interpretation of imaging techniques, may not give sufficient weight to selection criteria. In 2008, the FGDP(UK) published Training standards in implant dentistry.18 These standards are supported by the UK's General Dental Council, which expects educational providers to refer to these as the authoritative source of training standards for implant dentistry in the UK. Imaging is mentioned only as follows, “the dentist should have detailed knowledge and understanding of radiology and radiography of the mandible and the maxilla, and how to interpret the findings from radiological examinations”. There is no specific mention of selection criteria.
The use of 3D imaging was defined as either CBCT or medical CT at any stage of the prescription. There was a statistically significant difference in the prescription of 3D imaging between Case 1 and Case 2, with more respondents choosing 3D imaging for the more surgically difficult Case 1. The explanation for this difference is likely to be that respondents were making a judgement about the difficulty of the case and prescribing pre-operative imaging accordingly. Notwithstanding, 54.8% of the respondents prescribed the same view for both cases. The strongest association with this finding was with those who place more than 100 implants per year. It may be conjectured that these practitioners have a well-established routine which they use for all lower edentulous cases.
For Case 1, the atrophic mandible, the strongest association with the use of 3D imaging was with those in the 0–10 years qualified group. These practitioners may, understandably, be seeking certainty that they are aware of potential anatomical difficulties in advance of surgery so avoiding surgical complications. Those with more experience are perhaps more likely to rely on their familiarity with the range of clinical circumstances that may be presented to them at the time of surgery.
Another factor that may be relevant is the relationship which younger dentists have with information and communications technology. Dentists in this group have been brought up with a familiarity and reliance on computers and communications devices. Their natural preference may, therefore, be for the computer-based solutions. Their easy proficiency may lead them to choose these views, perhaps in the belief that the more technological the method, the easier and more convenient it will be to use and the better it must be.
For Case 2, the well-formed mandible, the strongest association with the use of 3D imaging was the availability of a CBCT machine. A simple explanation for this is perhaps the financial pressure to make use of a very expensively bought or leased piece of equipment. Nevertheless, a more likely explanation might be that those who have bought an expensive CBCT machine have also committed themselves to ownership in psychological terms. They may therefore believe that they are prescribing the best possible image for their patients and that the quality of the image outweighs concerns about increased radiation dose regardless of the difficulty of the case.
Recently produced European guidelines on the use of CBCT state as a general principle, “CBCT should only be used when the question for which imaging is required cannot be answered adequately by lower dose conventional (traditional) radiography”.19 These, and other similar guidelines, could be interpreted as meaning that conventional radiography should always be carried out so that the decision to use higher dose 3D imaging can be made. An investigation of dentists' practice in this regard was, therefore, of interest. Those dentists in the sample who had prescribed conventional radiography prior to 3D imaging were identified. For Case 1, 15.6% (n = 21) prescribed conventional views prior to 3D imaging. For Case 2, 5.2% (n = 7) prescribed conventional views prior to 3D imaging. The larger number of dentists who followed this method for Case 1 is consistent with decision-making on conventional radiographs because this was the atrophic case. It is likely that they felt that more information was necessary based on the results of the conventional radiographs. Case 2 was the well-formed mandible, and the smaller number would again be consistent with this decision-making process since it is more likely that the dentists would feel that they had sufficient information from the conventional views. Nevertheless, these figures suggest that very few respondents follow this protocol and no associations were found with the demographic variables.
Imaging guides are considered good practice in maximizing the information obtained from imaging. In both cases, the use of guides was very high. Notwithstanding, χ2 analysis revealed a negative association with those who place more than 100 dental implants per year, being less likely to use an imaging guide. This group of more experienced surgical implant practitioners are also more likely to use the same view for both cases. It seems reasonable conjecture that the experience of this group of practitioners has led them to a simple, convenient, uncomplicated and consistent imaging strategy that provides enough information for planning their surgery given their experience of the range of clinical circumstances that may be presented to them.
14 demographic variables were included in the analysis as listed in Table 6. These were tested against each of four null hypotheses. It could be argued that these analyses encounter the problem of multiple comparisons. That is to say, one might expect that some of the findings may be significant simply by chance because of the large number of comparisons which were made. One solution to this problem is to use the Bonferroni correction. This sets significance at a more demanding level by dividing it by the number of explanatory variables.15 With 14 explanatory variables this leads to a new significance level of 0.05/14 = 0.004. If this correction were applied, it would lead to fewer significant findings. For the imaging strategy of dentists in relation to case difficulty, “placed more than 100 implants per year” would remain as the only significant relationship [χ2(1) = 9.878, p = 0.002]. For the use of 3D imaging and conventional radiography in relation to the demographic variables, two significant relationships would remain for Case 1. These would be the positive relationship, “0 to 10 years since dental qualification” [χ2(1) = 8.244, p = 0.004], and the negative relationship, “Training—Independently run course” [χ2(1) = 9.763, p = 0.002]. For Case 2, the remaining significant relationships would be the positive relationship, “CBCT machine available” [χ2(1) = 10.123, p = 0.001], and the negative relationship, “Training—Independently run course” [χ2(1) = 9.519, p = 0.002]. For the use of radiographic guides in relation to the demographic variables, one significant relationship, “Places more than 100 implants per year”, remains for Case 1 [χ2(1) = 9.446, p = 0.002]. Adjustment for multiple comparisons remains a matter of debate.20,21 Although this method decreases the risk of Type 1 errors, it simultaneously increases the risk of Type 2 errors.22
One limitation of this study is that respondents did not have to take into account the inconvenience of selection of some views. For example, in some cases, selection of a CBCT examination would require a referral letter to be written, inconvenience to the patient and delay before the view is received. Equally, the prescription of an imaging guide would often require an impression, laboratory costs and further delay. None of these inconveniences were encountered when simply clicking an option from a web page. Therefore, there was no discouragement to the selection of these views as there would be in reality.
It is possible that those who practice in the north-west of England, who are likely to have qualified at a north-west dental school, may prescribe differently from those in other areas. Nevertheless, dental implantology is a post-graduate subject, and training is carried out on a national and, sometimes, an international basis. Therefore, although the study was carried out in the north-west of England, the findings may have relevance to a wider population of implant practitioners.
In conclusion, this study investigated image prescription prior to dental implant placement in the anterior edentulous mandible in order to support an overdenture. The use of a radiographic phantom to produce a range of available images and the use of the interactive capabilities of the internet probably went further than any previous questionnaire studies in attempting to reproduce clinical decision-making. An 80% response rate and a favourable assessment of response bias suggest that these data are a reliable representation of the image prescription pattern of this population. Three groups of practitioners were identified that were associated with certain image choices. First, the 0–10 years qualified respondents were significantly associated with the prescription of 3D imaging. Second, the more experienced implant surgeons, who place more than 100 implants per year, were significantly associated with the non-use of imaging guides and prescription of the same view for both cases regardless of difficulty. The sample as a whole, however, changed their prescription according to the difficulty of the case. Third, those who have a CBCT machine available were more likely to use it, regardless of the difficulty of the case. The results show no agreement on image prescription, and the idiosyncratic nature of independent dental practice may be an important factor in the chaotic pattern of prescriptions which was found. Further, dental implant practitioners may be unaware of existing guidelines for selection of images prior to dental implant placement. Notwithstanding, these guidelines are open to wide interpretation and could be construed to support a wide range of image prescriptions. Further, training in dental implantology may well leave dentists to make their own judgements about selection criteria. There is a need for widely disseminated, evidence-based image selection criteria for dental implantology which are clear and specific.
Acknowledgments
The authors wish to thank Dr Jolene Smyth of the University of Nebraska-Lincoln for her valuable advice and to acknowledge the generous support of Mr Frank Shelley, who paid for the development of the web-based questionnaire.
References
- 1.Thomason JM, Feine J, Exley C, Moynihan P, Muller F, Naert I, et al. Mandibular two implant-supported overdentures as the first choice standard of care for edentulous patients–the York Consensus Statement. Br Dent J 2009; 207: 185–186 [DOI] [PubMed] [Google Scholar]
- 2.Kalpidis CD, Setayesh RM. Hemorrhaging associated with endosseous implant placement in the anterior mandible: a review of the literature. J Periodontol 2004; 75: 631–645 [DOI] [PubMed] [Google Scholar]
- 3.Pigadas N, Simoes P, Tuffin JR. Massive sublingual haematoma following osseo-integrated implant placement in the anterior mandible. Br Dent J 2009; 206: 67–68 [DOI] [PubMed] [Google Scholar]
- 4.Hobkirk JA, Watson RM, Searson LJJ. Introducing dental implants. Edinburgh, UK: Churchill Livingstone; 2003 [Google Scholar]
- 5.European Commission. Radiation Protection 136. European Guidelines on Radiation Protection in Dental Radiology. Luxembourg: Office for Official Publications of the European Communities; 2004. [Google Scholar]
- 6.FGDP(UK) Selection criteria in dental radiography: the safe use of radiographs in dental practice. 2nd edn. London, UK: Faculty of General Dental Practitioners (UK) Royal College of Surgeons of England; 2004 [Google Scholar]
- 7.American Dental Association The selection of patients for dental radiographic examinations. Washington, DC: US Department of Health and Human Services, Public Health Service, Food and Drug Administration; 2004 [Google Scholar]
- 8.Tyndall DA, Brooks SL. Selection criteria for dental implant site imaging: a position paper of the American Academy of Oral and Maxillofacial radiology. Oral Surg Oral Med Oral Pathol Oral Radiol Endod 2000; 89: 630–637 [DOI] [PubMed] [Google Scholar]
- 9.Harris D, Horner K, Gröndahl K, Jacobs R, Helmrot E, Benic GI, et al. E.A.O. guidelines for the use of diagnostic imaging in implant dentistry 2011. A concensus workshop organised by the European Association for Osseointegration at the Medical University of Warsaw. Clin Oral Impl Res 2012; 23: 1243–1253 [DOI] [PubMed] [Google Scholar]
- 10.Shelley AM, Brunton P, Horner K. Questionnaire surveys of dentists on radiology. Dentomaxillofac Radiol 2012; 41: 267–275 [DOI] [PMC free article] [PubMed] [Google Scholar]
- 11.Shelley AM, Brunton P, Horner K. Subjective image quality assessment of cross sectional imaging methods for the symphyseal region of the mandible prior to dental implant placement. J Dent 2011; 39: 764–770 [DOI] [PubMed] [Google Scholar]
- 12.Dillman DA, Smyth JD, Christian LM. Internet, mail and mixed-mode surveys. The tailored design method. 3rd edn. Hoboken, NJ: John Wiley & Sons, Inc.; 2009 [Google Scholar]
- 13.Locker D. Response and nonresponse bias in oral health surveys. J Public Health Dent 2000; 60: 72–81 [DOI] [PubMed] [Google Scholar]
- 14.Newcombe RG. Interval estimation for the difference between independent proportions: comparison of eleven methods. Stat Med 1998; 17: 873–890 [DOI] [PubMed] [Google Scholar]
- 15.Altman DG. Practical statistics for medical research. London, UK: Chapman & Hall; 1991 [Google Scholar]
- 16.Church AH. Estimating the effect of incentives on mail survey response rates: a meta-analysis. Public Opinion Quarterly 1993; 57: 62–79 [Google Scholar]
- 17.James JM, Bolstein R. Large monetary incentives and their effect on mail survey response rates. Public Opinion Quarterly 1992; 56: 442–453 [Google Scholar]
- 18.Hayward R. Training standards in implant dentistry. London, UK: Faculty of General Dental Practice; 2008. [Google Scholar]
- 19.European Commission. Radiation Protection 172. Cone beam CT for dental and maxillofacial radiology: evidence based guidelines. Luxembourg: Office for Official Publications of the European Communities; 2012. [Google Scholar]
- 20.Bender R, Lange S. Multiple test procedures other than Bonferroni's deserve wider use. BMJ 1999; 318: 600–601 [DOI] [PMC free article] [PubMed] [Google Scholar]
- 21.Perneger TV. What's wrong with Bonferroni adjustments. BMJ 1998; 316: 1236–1238 [DOI] [PMC free article] [PubMed] [Google Scholar]
- 22.Bland JM, Altman DG. Multiple significance tests: the Bonferroni method. BMJ 1995; 310: 170. [DOI] [PMC free article] [PubMed] [Google Scholar]
- 23.Shelley AM, Horner K. A transymphyseal X-ray projection to assess the anterior edentulons mandible prior to implant placement. Dental Update 2008; 35: 689–694 [DOI] [PubMed] [Google Scholar]
- 24.Kviz FJ. Toward a standard definition of response rate. Public Opin Q 1977; 41: 265–267 [Google Scholar]
- 25.Asch DA, Jedrziewski MK, Christakis NA. Response rates to mail surveys published in medical journals. J Clin Epidemiol 1997; 50: 1129–1136 [DOI] [PubMed] [Google Scholar]


