

Abstract
Objectives:
The aim of this study was to determine the grey value variation at the implant site with different scan settings, including field of view (FOV), spatial resolution, number of projections, exposure time and dose selections in two cone beam CT (CBCT) systems and to compare the results with those obtained from a multislice CT system.
Methods:
A partially edentulous human mandibular cadaver was scanned by three CT modalities: multislice CT (MSCT) (Philips, Best, the Netherlands), and two CBCT systems: (Accuitomo 170®, Morita, Japan) and (NewTom 5G®, QR, Verona, Italy). Using different scan settings 36 and 24 scans were obtained from the Accuitomo and the NewTom, respectively. The scans were converted to digital imaging and communications in medicine 3 format. The analysis of the data was performed using 3Diagnosys® software (v. 3.1, 3diemme, Cantù, Italy) and Geomagic studio® 2012 (Morrisville, NC). On the MSCT scan, one probe designating the site for pre-operative implant placement was inserted. The inserted probe on MSCT was transformed to the same region on each CBCT scan using a volume-based three-dimensional registration algorithm. The mean voxel grey value of the region around the probe was derived separately for each CBCT. The influence of scanning parameters on the measured mean voxel grey values was assessed.
Results:
Grey values in both CBCT systems significantly deviated from Hounsfield unit values measured with MSCT (p = 0.0001). In both CBCT systems, scan FOV and spatial resolution selections had a statistically significant influence on grey value measurements (p = 0.0001). The number of projections selection had a statistically significant influence in the Accuitomo system (p = 0.0001) while exposure time and dose selections had no statistically significant influence on grey value measurements in the NewTom (p = 0.43 and p = 0.37, respectively).
Conclusions:
Grey-level values from CBCT images are influenced by device and scanning settings.
Keywords: cone beam CT, registration, grey values, bone density
Introduction
The amount and quality of available bone at a proposed implant site determine its resistance to fracture and directly influence treatment outcome.1 Previous research has demonstrated a higher failure rate for oral implants inserted in jawbones with insufficient quantity or poor quality.2,3 In dental implants, bone dimensions expressed by width and height measurements are always assessed by the practitioner prior to implant insertion by means of clinical inspection and radiographic evaluation. In comparison, alveolar bone density measurements at the implant site are less frequently utilized. However, assessing bone density pre-operatively remains an important factor for estimating the rate of primary stability the implant can achieve.4 Cone beam CT (CBCT) is currently widely accepted as a precise tool for pre-operative dental implant planning.5 The advantages of CBCT over multislice CT (MSCT) concerning the wide availability to oral health specialists and reduced scan costs have been emphasized in the literature. It is frequently cited that CBCT radiation dose levels are lower than those of MSCT. Although this was correct previously, recent evidence suggests that this is not necessarily always correct.6–8 The radiation dose from any CBCT device largely depends on the type of machine and scan settings, including field of view (FOV), number of basis projections and scan modes, among other factors.9 Likewise, the latest generation MSCT offers low-dose “dental scan” modes, which can provide image quality and radiation dose levels similar to large FOV CBCT scanners.10
Similar to radiation dose, the influence of FOV and scan settings on image quality is significant. Within any CBCT system, image quality itself is inconsistent and also is largely dependent on the selected FOV and scan settings.11 It is therefore inappropriate to automatically state that CBCT delivers a much lower radiation dose than MSCT and has superior image resolution irrespective of system type or scan protocol used.12 Nevertheless, the aforementioned advantages of CBCT over MSCT for dental implants remain substantial so that CBCT is the modality of choice for pre-operative dental implant surgery assessment and post-operative diagnostic evaluation.
The geometric accuracy for linear measurements with CBCT is high, such that bone dimensions and implant proximity to relevant normal anatomical structures can be accurately assessed.13–15 Furthermore, a strong correlation between MSCT Hounsfield unit measurements and CBCT grey values has been recently demonstrated, hinting at the potential of deriving actual Hounsfield unit values from CBCT to estimate bone mineral density.16–20 However, the manufacturers of CBCT devices use different approaches for setting exposure factors.21 Since there should be a balance between the diagnostic value of the scanned volume and the exposure risk to the patient, there is a real need to select ideal exposure settings in order to optimize image quality and to lower radiation dose.22,23 For example, it has been shown that reducing the number of projections results in a significant reduction in patient radiation exposure while not necessarily leading to reduced dimensional accuracy,24 and that a rotation of 180° is recommended to lower the scan time and radiation dose, especially in implant planning for the lower jaw.25 This has the added advantage of lowering motion artefacts resulting from micro-movements of the jaw.
One of the most important limiting factors for radiation dose and image quality is the selection of FOV.26 Depending on the number and location of the potential implant, the size of the chosen FOV will differ. To date, the influence that FOV and other scan setting selections can have on grey value measurements obtained from CBCT remains unverified. The aim of this study was to determine the grey value variations with different scan settings in two CBCT systems.
Materials and methods
Sample preparation and radiographic evaluation
A partially edentulous human mandibular cadaver not identified by age, sex or ethnic group was sectioned at the mid-ramus level and fixed in formaldehyde (formaldehyde 74.79%, glycerol 16.7%, alcohol 8.3% and phenol 0.21%) and stored. A declaration was obtained from the Functional Anatomy Department to use the human material for research purposes. The mandible was scanned by three types of CT modalities: multislice CT (120 kVp, 222 mA, 1.128 s, 0.67 mm3 isotropic voxel; Philips, Best, the Netherlands) and two CBCT systems (NewTom 5G, Verona, Italy) and (Accuitomo 170, Morita, Japan). The mandible was scanned by the Accuitomo with nine FOVs (40 × 40 mm, 60 × 60 mm, 80 × 80 mm, 100 × 100 mm, 100 × 50 mm, 140 × 50 mm, 140 × 100 mm, 170 × 50 mm and 170 × 120 mm). For each FOV there were two extra scan settings to choose from: the number of basis projections (360 or 180) and the spatial resolution (standard or high resolution). In total 36 scans were made of the mandible (9 FOVs × 2 basis projections × 2 imaging modes).
Similarly, all scan settings were utilized for the NewTom 5G. Using normal resolution, four FOVs were available (80 × 80 mm, 120 × 80 mm, 150 × 120 mm and 180 × 160 mm) with two extra settings to choose from: either regular or enhanced scan time and standard or boosted dose. Similarly, using high resolution there were also four FOVs available (60 × 60 mm, 80 × 80 mm, 120 × 80 mm and 150 × 50 mm) with regular or enhanced scan time, but not with the standard or boosted dose. In total, 24 scans were made using the NewTom 5G. In the MSCT and NewTom 5G scans, the occlusal plane of the mandible was set perpendicular to the floor with zero gantry tilt, whereas in the Accuitomo it was set parallel to the floor according to the manufacturer's recommended protocol.
In all Accuitomo scans, settings remained at 90 kVp and 5 mA, whereas the scan time ranged between 9 s and 30.8 s (9 s, 15.8 s, 17.5 s and 30.8 s, respectively, for 180° standard, 180° hi-fidelity, 360° standard and 360° hi-fidelity). Similar to the Accuitomo, settings remained identical in all NewTom scans at 110 kVp and 0.57 mA for standard resolutions. High-resolution NewTom scans ranged between 0.6 mA and 0.95 mA. For normal resolution, the X-ray emission time was 3.06 s for regular mode and 4.80 s for enhanced mode. For high resolution, it was 5.4 s and 7.3 s for the regular and enhanced modes, respectively. There was one exception: X-ray emission time was 6.01 s for enhanced 60 × 60 mm high resolution. Tables 1 and 2 show all scan settings used in this study for both systems. The region of interest, which was the right first molar edentulous region, was positioned in the centre of the FOV, as identical as possible in all the scans.
Table 1.
Accuitomo 170 scan settings and grey value measurements
| FOV (mm) | Basis projection (°) | Imaging mode | kVp | mA | Scan time (s) | Grey values (first) | Grey values (second) |
| 40 × 40 | 180 | Std | 90 | 5 | 9.0 | 396.16 | 398.00 |
| 40 × 40 | 180 | Hi-Fi | 90 | 5 | 15.8 | 392.75 | 397.70 |
| 40 × 40 | 360 | Std | 90 | 5 | 17.5 | 378.78 | 380.08 |
| 40 × 40 | 360 | Hi-Fi | 90 | 5 | 30.8 | 379.10 | 379.50 |
| 60 × 60 | 180 | Std | 90 | 5 | 9.0 | 473.05 | 473.92 |
| 60 × 60 | 180 | Hi-Fi | 90 | 5 | 15.8 | 474.84 | 473.37 |
| 60 × 60 | 360 | Std | 90 | 5 | 17.5 | 447.71 | 448.35 |
| 60 × 60 | 360 | Hi-Fi | 90 | 5 | 30.8 | 447.63 | 447.49 |
| 80 × 80 | 180 | Std | 90 | 5 | 9.0 | 540.29 | 542.34 |
| 80 × 80 | 180 | Hi-Fi | 90 | 5 | 15.8 | 528.28 | 528.56 |
| 80 × 80 | 360 | Std | 90 | 5 | 17.5 | 502.04 | 503.84 |
| 80 × 80 | 360 | Hi-Fi | 90 | 5 | 30.8 | 502.75 | 505.79 |
| 100 × 100 | 180 | Std | 90 | 5 | 9.0 | 567.89 | 562.79 |
| 100 × 100 | 180 | Hi-Fi | 90 | 5 | 15.8 | 567.50 | 562.62 |
| 100 × 100 | 360 | Std | 90 | 5 | 17.5 | 537.58 | 537.12 |
| 100 × 100 | 360 | Hi-Fi | 90 | 5 | 30.8 | 535.46 | 531.13 |
| 100 × 50 | 180 | Std | 90 | 5 | 9.0 | 575.65 | 570.59 |
| 100 × 50 | 180 | Hi-Fi | 90 | 5 | 15.8 | 574.78 | 571.88 |
| 100 × 50 | 360 | Std | 90 | 5 | 17.5 | 548.41 | 548.16 |
| 100 × 50 | 360 | Hi-Fi | 90 | 5 | 30.8 | 548.99 | 543.34 |
| 140 × 50 | 180 | Std | 90 | 5 | 9.0 | 614.67 | 608.79 |
| 140 × 50 | 180 | Hi-Fi | 90 | 5 | 15.8 | 610.98 | 606.32 |
| 140 × 50 | 360 | Std | 90 | 5 | 17.5 | 585.35 | 585.19 |
| 140 × 50 | 360 | Hi-Fi | 90 | 5 | 30.8 | 580.41 | 580.80 |
| 140 × 100 | 180 | Std | 90 | 5 | 9.0 | 601.35 | 598.82 |
| 140 × 100 | 180 | Hi-Fi | 90 | 5 | 15.8 | 596.31 | 598.27 |
| 140 × 100 | 360 | Std | 90 | 5 | 17.5 | 563.99 | 562.55 |
| 140 × 100 | 360 | Hi-Fi | 90 | 5 | 30.8 | 562.72 | 563.20 |
| 170 × 50 | 180 | Std | 90 | 5 | 9.0 | 793.10 | 799.18 |
| 170 × 50 | 180 | Hi-Fi | 90 | 5 | 15.8 | 790.42 | 803.67 |
| 170 × 50 | 360 | Std | 90 | 5 | 17.5 | 748.38 | 764.76 |
| 170 × 50 | 360 | Hi-Fi | 90 | 5 | 30.8 | 751.12 | 758.43 |
| 170 × 120 | 180 | Std | 90 | 5 | 9.0 | 765.89 | 777.26 |
| 170 × 120 | 180 | Hi-Fi | 90 | 5 | 15.8 | 757.54 | 768.08 |
| 170 × 120 | 360 | Std | 90 | 5 | 17.5 | 737.79 | 745.65 |
| 170 × 120 | 360 | Hi-Fi | 90 | 5 | 30.8 | 733.45 | 739.18 |
FOV, field of view; Hi-Fi, high fidelity; Std, standard.
Table 2.
NewTom 5G scan settings and grey value measurements
| FOV (mm) | Scan time | Dose | kVp | mA | Exposure time(s) | Grey values (first) | Grey values (second) |
| 8 × 8 | Regular | Standard | 110 | 0.57 | 3.06 | 370.24 | 371.15 |
| 8 × 8 | Regular | Boosted | 110 | 0.57 | 3.06 | 373.23 | 374.29 |
| 8 × 8 | Enhanced | Standard | 110 | 0.57 | 4.80 | 372.62 | 371.54 |
| 8 × 8 | Enhanced | Boosted | 110 | 0.57 | 4.80 | 367.92 | 369.11 |
| 12 × 8 | Regular | Standard | 110 | 0.57 | 3.06 | 348.45 | 351.90 |
| 12 × 8 | Regular | Boosted | 110 | 0.57 | 3.06 | 341.78 | 342.38 |
| 12 × 8 | Enhanced | Standard | 110 | 0.57 | 4.80 | 342.93 | 344.83 |
| 12 × 8 | Enhanced | Boosted | 110 | 0.57 | 4.80 | 348.75 | 346.27 |
| 15 × 12 | Regular | Standard | 110 | 0.57 | 3.06 | 274.99 | 275.06 |
| 15 × 12 | Regular | Boosted | 110 | 0.57 | 3.06 | 269.87 | 268.48 |
| 15 × 12 | Enhanced | Standard | 110 | 0.57 | 4.80 | 275.49 | 276.05 |
| 15 × 12 | Enhanced | Boosted | 110 | 0.57 | 4.80 | 271.84 | 272.64 |
| 18 × 16 | Regular | Standard | 110 | 0.57 | 3.06 | 259.71 | 259.65 |
| 18 × 16 | Regular | Boosted | 110 | 0.57 | 3.06 | 260.36 | 259.92 |
| 18 × 16 | Enhanced | Standard | 110 | 0.57 | 4.80 | 256.16 | 256.26 |
| 18 × 16 | Enhanced | Boosted | 110 | 0.57 | 4.80 | 256.49 | 256.41 |
| 6 × 6 | Regular | Hi-res | 110 | 0.95 | 4.50 | 378.10 | 380.53 |
| 6 × 6 | Enhanced | Hi-res | 110 | 0.83 | 6.01 | 383.56 | 381.64 |
| 8 × 8 | Regular | Hi-res | 110 | 0.63 | 5.40 | 327.06 | 333.30 |
| 8 × 8 | Enhanced | Hi-res | 110 | 0.63 | 7.30 | 329.96 | 330.12 |
| 12 × 8 | Regular | Hi-res | 110 | 0.60 | 5.40 | 312.00 | 313.16 |
| 12 × 8 | Enhanced | Hi-res | 110 | 0.59 | 7.30 | 317.73 | 319.42 |
| 15 × 5 | Regular | Hi-res | 110 | 0.86 | 5.40 | 387.31 | 387.13 |
| 15 × 5 | Enhanced | Hi-res | 110 | 8.60 | 7.30 | 390.36 | 390.45 |
FOV, field of view; Hi-res, high resolution.
CT value evaluation
The scans were converted to digital imaging and communications in medicine 3 (DICOM3) format. The data sets from both CBCT scanners (NewTom 5G and Accuitomo170) were 14 bits in depth, thus having a grey value range of 16 384. The data were exported with isotropic voxels. In the Accuitomo, the voxel dimensions were 0.08 mm, 0.125 mm and 0.160 mm for FOVs of 40 × 40 mm3, 60 × 60 mm3 and 80 × 80 mm3, respectively, and 0.25 mm for the remaining FOVs. In the NewTom, the isotropic voxel sizes ranged between 0.15–0.30 mm and 0.075–0.150 mm for normal and high resolution, respectively. The analysis of the data was performed using 3Diagnosys software (v. 3.1, 3diemme, Cantù, Italy) and Geomagic (studio® 2012, Morrisville, NC). On the MSCT scan, one region of interest (ROI) designating the site for pre-operative implant placement (probe) was selected at the right first molar region (Figure 1). The selected ROI was totally within the bone. Using 3Diagnosys the surfaces of all scans were generated and exported as Standard Triangulation Language (STL) files. The inserted probe on MSCT was transformed to the same region on each CBCT scan by a volume-based three-dimensional registration algorithm using Geomagic software to standardize the selection of the ROI to ensure that the voxel value measurements from all the scans are from exactly the same site (Figure 2). On the scans including a transformed virtual implant, an area 1 mm thick was selected around the probe (Figure 3). The mean voxel grey values of each hollow cylinder region around the probe site was exported separately for all CBCT systems. All the scanning and density measurement procedures were performed twice to assess the reproducibility of measurements.
Figure 1.
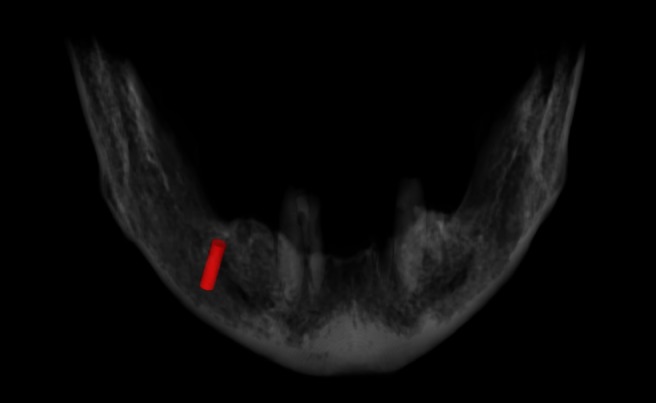
Three-dimensional reconstruction of the mandible with the planning of implant (probe)
Figure 2.
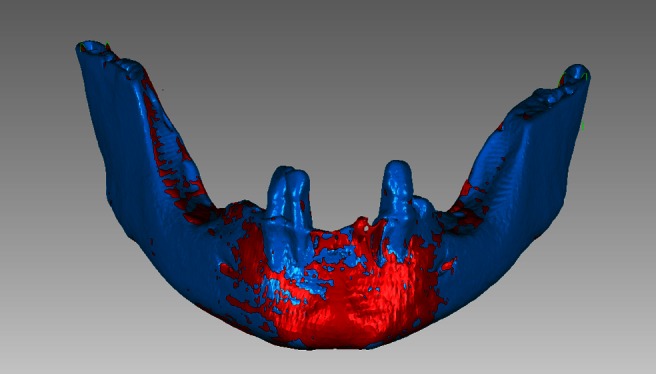
An example of the matching between multislice CT (MSCT) and cone beam CT (CBCT).
Figure 3.

The position of the implant depicted on multiplanar reconstructed images. The measurement area is selected surrounding the implant
Data analysis
All data were analysed using SPSS® (v. 17.0, SPSS Inc., Chicago, IL). There were 72 (36 × 2) measured mean grey values for the Accuitomo and 48 (24 × 2) for the NewTom. The influence of FOV, number of projections and spatial resolution on the variability of the voxel grey values in the Accuitomo scans, and FOV, exposure time, dose level and spatial resolution in NewTom scans were assessed. The significance level was set to a p-value of 0.05 or less.
Results
Statistical analysis (t-test) of repeated measurements of the first and second grey value measurement showed no statistical differences in both CBCT scanners. So the mean of the two measurements for each scanner was calculated for further analysis. The mean voxel grey value of the selected region around the probe ranged from 379.10 to 803.67 (Table 1) in the Accuitomo and from 256.16 to 374.29 in the NewTom (Table 2). In the Accuitomo, the grey values increased with the diameter on the FOV (not the height), whereas in the NewTom it decreased with increasing FOV. Overall, in the Accuitomo scans the FOV (total volume of the scanned mass), number of projections (180° or 360°) and spatial resolution (standard or hi-fidelity) had statistically significant influence on voxel grey value measurement (p = 0.0001). FOV and spatial resolution (normal or high) had a statistically significant influence on voxel grey value measurements in the NewTom scans (p = 0.0001), whereas the effect for exposure time (regular or enhanced) and dose (standard or boosted) was statistically insignificant (p = 0.43 and p = 0.37, respectively).
Discussion
The present ex vivo study showed significant variability within the grey values measured by the two CBCT scanners (Accuitomo 170 and NewTom 5G) using different scan parameters. Both CBCT scanners showed higher grey values than the actual Hounsfield units derived from MSCT (mean 62 HU, standard deviation 243 HU). This deviation arises from increased noise level, scattering and artefacts specific to the scan technology. CBCT scanners operate at a lower peak kilovoltage and tube loading settings than MSCT scanners, resulting in a reduced signal-to-noise ratio.27 A higher noise level also causes more inconsistencies and introduces larger standard deviations in voxel grey values.28–30 Additionally, as the acquired volume in CBCT is proportionally larger than the highly collimated fan beam MSCT, the influence of these artefacts is excessively exacerbated.27,29 In this study, a fully automated and observer-independent three-dimensional matching algorithm was employed to ensure that all measurements were exactly from the same site up to voxel accuracy.
Concerning FOV selection, the Accuitomo demonstrated an increase in grey-level values with increasing field size whereas the opposite was the case for the NewTom, which witnessed a steady decrease in grey values when the imaging volume increased. This disparity between the behaviours of the two systems could be attributed to the variability in reconstruction and post-processing methods applied by the two manufacturers. Among the assessed scanning factors, all the three main settings in Accuitomo (FOV, number of projections and spatial resolution) resulted in significant variation of optical densities, whereas in the case of the NewTom these factors were limited to FOV and spatial resolution.
By rotation of a cone-shaped X-ray beam around the patient's head in CBCT scanners, a cylindrical volume is acquired, the FOV. The size and available number of FOVs is variable for different manufacturers and models.23,31 The selected FOV should include the necessary information for diagnosis and treatment planning. However, as patients vary in size, the correct FOV is a patient-specific selection. The size of the selected FOV remains the most important scanning factor in limiting the radiation dose and image quality.26 Our results showed that this factor influences voxel grey value variability in both CBCT systems. Many CBCT systems permit the user to select the number of basis projections (acquisitions) used to create raw data. However, reducing the number of projections (180° instead of 360°) increases the noise level and inconsistencies in reconstructed images.32,33 In our study, the optical density measurement was significantly affected by the number of projections in the Accuitomo whereas this option was not explicitly available in the NewTom.
The other scanning setting, the imaging mode or spatial resolution, has been expressed differently by manufacturers: e.g. high resolution, standard resolution, high fidelity, standard scan and zoom scan. Usually these selections rely on a combination of manipulating the effective exposure time for the pulsed beam and the number of projections plus the exposure geometry. In the NewTom an additional scan option (standard or boosted) has been added to explicitly increase the exposure time to the patient, thereby increasing the radiation dose and decreasing the noise level in the image, thus leading to an increased signal-to-noise ratio. Although the manufacturers state that these options give the practitioner the freedom to choose the proper scan settings for a patient's needs, there is obvious ambiguity and subjectivity in the jargon used. Using the high-resolution mode increases the patient dose; however, the image noise level will be significantly decreased, thus leading to better image quality.34 However, increasing the spatial resolution and signal-to-noise ratio may exacerbate the influence of metal artefacts, thereby actually resulting in a poor image.27 Spatial resolution showed a significant effect on voxel grey value measurement in both the Accuitomo and the NewTom scans in our study.
Previous attempts to assess the reliability of voxel values from CBCT in evaluating bone density have been noted in the literature. Large amounts of scattered X-rays and artefacts have been mentioned as the reasons for unreliability of CBCT in evaluating bone mineral density.27–29,35 However, other studies have shown high correlation between MSCT and CBCT grey values, suggesting that voxel values of CBCT can be used to estimate bone mineral density.11,16–20 In the later mentioned studies, only one set of scanning factors was used for CBCT evaluations, whereas our results showed that grey values derived from CBCT scanners could vary widely with different settings.
It should be emphasized that our results are confined to the two CBCT systems (Accuitomo 170 and NewTom 5G) that were used in this study and that caution should be exercised when other systems are considered. In a systematic review of the literature on CBCT systems and applications, it was emphasized that there still is no uniformity among the design specifications of different systems.36 The lack of a technical standard for the development of CBCT systems has led to a wide disparity in the physical parameters of each model, including, among others, image quality grey value measurements. Developing such a standard for manufacturing CBCT systems may help in generalizing research findings in the future.
The study was limited in that only two CBCT systems (Accuitomo 170 and NewTom 5G) were used. The scan settings for other flat-panel CBCT systems may vary. Values obtained for a cadaver may deviate from the clinical situation. Finally, the study was also limited as surrounding anatomical structures including the tongue and vertebra were absent, as standardizing the location of these structures in both modalities was rather cumbersome. As a result, partial object artefacts resulting from structures placed outside the scan field were not simulated. It has been previously noted that artefacts resulting from partial sampling of objects outside the scan field could result in a deviation in voxel grey values with CBCT.28,37
In conclusion, grey-level values from CBCT images are influenced by device and scanning settings. FOV and spatial resolution selection can significantly influence grey value measurements in both the NewTom 5G and the Accuitomo 170, and in the latter the number of projections can have an effect. Thus, assessing voxel grey values from CBCT when evaluating bone mineral density should take into account the scanning parameters.
Acknowledgment
We would like to thank Dr Hans Verheij for conducting the statistical analysis.
References
- 1.Isoda K, Ayukawa Y, Tsukiyama Y, Sogo M, Matsushita Y, Koyano K. Relationship between the bone density estimated by cone-beam computed tomography and the primary stability of dental implants. Clin Oral Implants Res 2012; 23: 832–836 [DOI] [PubMed] [Google Scholar]
- 2.Jaffin RA, Berman CL. The excessive loss of Branemark fixtures in type IV bone: a 5-year analysis. J Periodontol 1991; 62: 2–4 [DOI] [PubMed] [Google Scholar]
- 3.Herrmann I, Lekholm U, Holm S, Kultje C. Evaluation of patient and implant characteristics as potential prognostic factors for oral implant failures. Int J Oral Maxillofac Implants 2005; 20: 220–230 [PubMed] [Google Scholar]
- 4.Turkyilmaz I, Tözüm TF, Tumer C, Ozbek EN. Assessment of correlation between computerized tomography values of the bone, and maximum torque and resonance frequency values at dental implant placement. J Oral Rehabil 2006; 33: 881–888 [DOI] [PubMed] [Google Scholar]
- 5.Ito K, Gomi Y, Sato S, Arai Y, Shinoda K. Clinical application of a new compact CT system to assess 3-D images for the preoperative treatment planning of implants in the posterior mandible. A case report. Clin Oral Implants Res 2001; 12: 539–542 [DOI] [PubMed] [Google Scholar]
- 6.Kau CH, Richmond S, Palomo JM, Hans MG. Three-dimensional cone beam computerized tomography in orthodontics. J Orthod 2005; 32: 282–293 [DOI] [PubMed] [Google Scholar]
- 7.Carrafiello G, Dizonno M, Colli V, Strocchi S, Pozzi Taubert S, Leonardi A, et al. Comparative study of jaws with multislice computed tomography and cone-beam computed tomography. Radiol Med 2010; 115: 600–611 [DOI] [PubMed] [Google Scholar]
- 8.White SC. Cone-beam imaging in dentistry. Health Phys 2008; 95: 628–637 [DOI] [PubMed] [Google Scholar]
- 9.Pauwels R, Beinsberger J, Collaert B, Theodorakou C, Rogers J, Walker A, et al. Effective dose range for dental cone beam computed tomography scanners. Eur J Radiol 2012; 81: 267–271 [DOI] [PubMed] [Google Scholar]
- 10.Suomalainen A, Kiljunen T, Käser Y, Peltola J, Kortesniemi M. Dosimetry and image quality of four dental cone beam computed tomography scanners compared with multislice computed tomography scanners. Dentomaxillofac Radiol 2009; 38: 367–378 [DOI] [PubMed] [Google Scholar]
- 11.Mah P, Reeves TE, McDavid WD. Deriving Hounsfield units using grey levels in cone beam computed tomography. Dentomaxillofac Radiol 2010; 39: 323–335 [DOI] [PMC free article] [PubMed] [Google Scholar]
- 12.Hassan B, Nijkamp P, Verheij H, Tairie J, Vink C, Stelt P, van der, et al. Precision of identifying cephalometric landmarks with cone beam computed tomography in vivo. Eur J Orthod 2013; 35: 38–44 10.1093/ejo/cjr050 [DOI] [PubMed] [Google Scholar]
- 13.Naitoh M, Katsumata A, Mitsuya S, Kamemoto H, Ariji E. Measurement of mandibles with microfocus x-ray computerized tomography and compact computerized tomography for dental use. Int J Oral Maxillofac Implants 2004; 19: 239–246 [PubMed] [Google Scholar]
- 14.Lagravère MO, Carey J, Toogood RW, Major PW. Three-dimensional accuracy of measurements made with software on cone-beam computed tomography images. Am J Orthod Dentofacial Orthop 2008; 134: 112–116 [DOI] [PubMed] [Google Scholar]
- 15.Lou L, Lagravere MO, Compton S, Major PW, Flores-Mir C. Accuracy of measurements and reliability of landmark identification with computed tomography (CT) techniques in the maxillofacial area: a systematic review. Oral Surg Oral Med Oral Pathol Oral Radiol Endod 2007; 104: 402–411 [DOI] [PubMed] [Google Scholar]
- 16.Aranyarachkul P, Caruso J, Gantes B, Schulz E, Riggs M, Dus I, et al. Bone density assessments of dental implant sites. 2. Quantitative cone-beam computerized tomography. Int J Oral Maxillofac Implants 2005; 20: 416–424 [PubMed] [Google Scholar]
- 17.Naitoh M, Hirukawa A, Katsumata A, Ariji E. Evaluation of voxel values in mandibular cancellous bone: relationship between cone-beam computed tomography and multislice helical computed tomography. Clin Oral Implants Res 2009; 20: 503–506 [DOI] [PubMed] [Google Scholar]
- 18.Naitoh M, Hirukawa A, Katsumata A, Ariji E. Prospective study to estimate mandibular cancellous bone density using large-volume cone-beam computed tomography. Clin Oral Implants Res 2010; 21: 1309–1313 [DOI] [PubMed] [Google Scholar]
- 19.Nomura Y, Watanabe H, Honda E, Kurabayashi T. Reliability of voxel values from cone-beam computed tomography for dental use in evaluating bone mineral density. Clin Oral Implants Res 2010; 21: 558–562 [DOI] [PubMed] [Google Scholar]
- 20.Lagravère MO, Fang Y, Carey J, Toogood RW, Packota GV, Major PW. Density conversion factor determined using a cone-beam computed tomography unit NewTom QR-DVT 9000. Dentomaxillofac Radiol 2006; 35: 407–409 [DOI] [PubMed] [Google Scholar]
- 21.Kau CH, Bˇoziˇc M, English J, Lee R, Bussa H, Ellis RK. Cone-beam computed tomography of the maxillofacial region—an update. Int JMed Robotics Comput Assist Surg 2009; 5: 366–380 [DOI] [PubMed] [Google Scholar]
- 22.Vandenberghe B, Jacobs R, Yang J. Diagnostic validity (or acuity) of 2D CCD versus 3D CBCT-images for assessing periodontal breakdown. Oral Surg Oral Med Oral Pathol Oral Radiol Endod 2007; 104: 395–401 [DOI] [PubMed] [Google Scholar]
- 23.Hatcher DC. Operational principles for cone-beam computed tomography. J Am Dent Assoc 2010; 141Suppl. 3: 3S–6S [DOI] [PubMed] [Google Scholar]
- 24.Brown AA, Scarfe WC, Scheetz JP, Silveira AM, Farman AG. Linear accuracy of cone beam CT derived 3D images. Angle Orthod 2009; 79: 150–157 [DOI] [PubMed] [Google Scholar]
- 25.Lofthag-Hansen S, Thilander-Klang A, Gröndahl K. Evaluation of subjective image quality in relation to diagnostic task for cone beam computed tomography with different fields of view. Eur J Radiol 2011; 80: 483–488 [DOI] [PubMed] [Google Scholar]
- 26.Allan GF. Field of view. Oral Surg Oral Med Oral Pathol Oral Radiol Endod 2009; 108: 477–478 [DOI] [PubMed] [Google Scholar]
- 27.Schulze R, Heil U, Groβ D, Bruellmann DD, Dranischnikow E, Schwanecke U, et al. Artefacts in CBCT: a review. Dentomaxillofac Radiol 2011; 40: 265–273 [DOI] [PMC free article] [PubMed] [Google Scholar]
- 28.Araki K, Okano T. The effect of surrounding conditions on pixel value of cone beam computed tomography. Clin Oral Implants Res. 2011 Nov 17. doi: 10.1111/j.1600-0501.2011.02373.x. Epub ahead of print. [DOI] [PubMed] [Google Scholar]
- 29.Nackaerts O, Maes F, Yan H, Couto Souza P, Pauwels R, Jacobs R. Analysis of intensity variability in multislice and cone beam computed tomography. Clin Oral Implants Res 2011; 22: 873–879 [DOI] [PubMed] [Google Scholar]
- 30.Maes F, Collignon A, Vandermeulen D, Marchal G, Suetens P. Multimodality image registration by maximization of mutual information. IEEE Trans Med Imaging 1997; 16: 187–198 [DOI] [PubMed] [Google Scholar]
- 31.Scarfe WC, Farman AG. What is cone-beam CT and how does it work? Dent Clin North Am 2008; 52: 707–730 [DOI] [PubMed] [Google Scholar]
- 32.Van Daatselaar AN, van der Stelt PF, Weenen J. Effect of number of projections on image quality of local CT. Dentomaxillofac Radiol 2004; 33: 361–369 [DOI] [PubMed] [Google Scholar]
- 33.Goldman LW. Principles of CT: radiation dose and image quality. J Nucl Med Technol 2007; 35: 213–225 [DOI] [PubMed] [Google Scholar]
- 34.Loubele M, Jacobs R, Maes F, Denis K, White S, Coudyzer W, et al. Image quality vs radiation dose of four cone beam computed tomography scanners. Dentomaxillofac Radiol 2008; 37: 309–318 [DOI] [PubMed] [Google Scholar]
- 35.Hua Y, Nackaerts O, Duyck J, Maes F, Jacobs R. Bone quality assessment based on cone beam computed tomography imaging. Clin Oral Implants Res 2009; 20: 767–771 [DOI] [PubMed] [Google Scholar]
- 36.De Vos W, Casselman J, Swennen GRJ. Cone-beam computerized tomography (CBCT) imaging of the oral and maxillofacial region: a systematic review of the literature. Int J Oral Maxillofac Surg 2009; 38: 609–625 [DOI] [PubMed] [Google Scholar]
- 37.Katsumata A, Hirukawa A, Okumura S, Naitoh M, Fujishita M, Ariji E, et al. Relationship between density variability and imaging volume size in cone-beam computerized tomographic scanning of the maxillofacial region: an in vitro study. Oral Surg Oral Med Oral Pathol Oral Radiol Endod 2009; 107: 420–425 [DOI] [PubMed] [Google Scholar]