Abstract
Estimating total ultrasound attenuation from backscatter data is essential in the field of quantitative ultrasound (QUS) because of the need to compensate for attenuation when estimating the backscatter coefficient and QUS parameters. This work uses a reference phantom method of attenuation estimation to create a spatial map of attenuation slope (AS) from backscatter radio-frequency (RF) data of three phantoms and a rat mammary adenocarcinoma tumor (MAT). The attenuation maps show changes in attenuation between different regions of the phantoms and the MAT tumor. Analyses of the attenuation maps of the phantoms suggest that the AS estimates are in good quantitative agreement with the known values for the phantoms. Furthermore, estimates of total attenuation from the attenuation maps are likewise in good quantitative agreement with known values.
Keywords: attenuation, attenuation slope, total attenuation, parametric image, quantitative ultrasound imaging, ultrasound
Introduction
The ability to accurately estimate total attenuation is essential for estimating the backscatter coefficient (BSC) and several derived quantitative ultrasound (QUS) parameters.1 Attenuation itself has been shown to be a useful quantitative parameter in diagnosing liver and bone disease.2,3 Despite the central importance of attenuation to the QUS field, currently there exists no robust method for its estimation. However, under certain conditions, it is possible to obtain accurate estimates of attenuation.
There are a variety of methods in the time and frequency domains for estimating attenuation.4-7 The spectral difference reference phantom approach is a frequency-domain method that uses the difference in the spectral amplitude at increasing depths to estimate local attenuation from ultrasonic backscatter data,8 and is the method used for this work. There are several advantages to this method, including the ability to analyze attenuation versus frequency over the entire bandwidth of the transducer. The method also makes relatively few assumptions, the main assumption being that the BSC does not change within the region of interest (ROI) being analyzed.
Attenuation maps serve two purposes. First, a parametric image of attenuation can show contrast between regions that do not appear different in a conventional B-mode image and gives quantitative information about the regions. Zagzebski et al.9 implemented a QUS imaging capability on a clinical scanner that had an offline attenuation imaging ability. To mitigate errors caused by changes in backscatter at tissue boundaries, Kim and Varghese developed the hybrid spectral shift method, which uses the downshift in center frequency of the ultrasound pulse for estimating attenuation.7 There have also been efforts by several groups to image attenuation using tomographic methods.10-12
Second, attenuation maps can be used as a way to more accurately compensate for attenuation to calculate the BSC. This requires that the total attenuation along the path between the transducer and ROI be calculated. The easiest way to account for attenuation is to adopt a bulk value of attenuation for the tissue to gain a reasonable estimate of total attenuation. This approach is only accurate in the simplest cases where attenuation does not change along the propagation path. Bigelow et al.13 proposed a Gaussian transformation and a spectral fit algorithm to directly estimate the total attenuation and scatterer size. Nam et al.14 proposed a method for simultaneously calculating the total attenuation and BSC using a constrained least-squares fitting scheme.
In this work, the information obtained from a local map of attenuation is used to compute the total attenuation at a point as the cumulative sum of the local estimates up to that point. The accuracy of the local and total attenuation estimates is tested for three different physical phantoms. These three phantoms had also been used during attenuation- and backscatter-measurement intercomparison studies reported by Nam et al.15 The critical difference between the methods of this work and those of Nam et al. is that this work uses the actual individual local attenuation estimates in their original spatial position to compute total attenuation without having to demarcate discrete regions of the phantom sample as having different attenuation from one another. By contrast, Nam et al. computed the total attenuation using an average of local attenuation values for each individual homogeneous region contained in the phantom. These average values were obtained from a separate radio-frequency (RF) data set, and the boundaries between homogeneous regions in the phantom were completely avoided. The purpose of this work is to demonstrate the ability to obtain accurate total attenuation compensation using the same RF data set from which the BSC is to be estimated. It should be noted that in this work, water boundaries are still segmented if they are present; the previous statement about not needing to demarcate regions applies only to regions within the sample.
Method
For this study, RF data were acquired from single planes in three phantoms and a rat mam-mary adenocarcinoma tumor (MAT) using a VisualSonics Vevo 2100 research scanner (VisualSonics Inc., Toronto, Ontario, Canada). The transducer array uses a quadrature sampling method at a sampling frequency of 40 MHz. When recovering the RF data, the received signals are upsampled by a factor of 16 so that the frequency of samples becomes 640 MHz. The array has an approximate bandwidth of 7 to 14 MHz. The phantoms selected for this study allowed for the accuracy of the attenuation map to be evaluated for simple geometries in which the attenuation and BSC properties are known. The particular tumor was selected for its relatively large size.
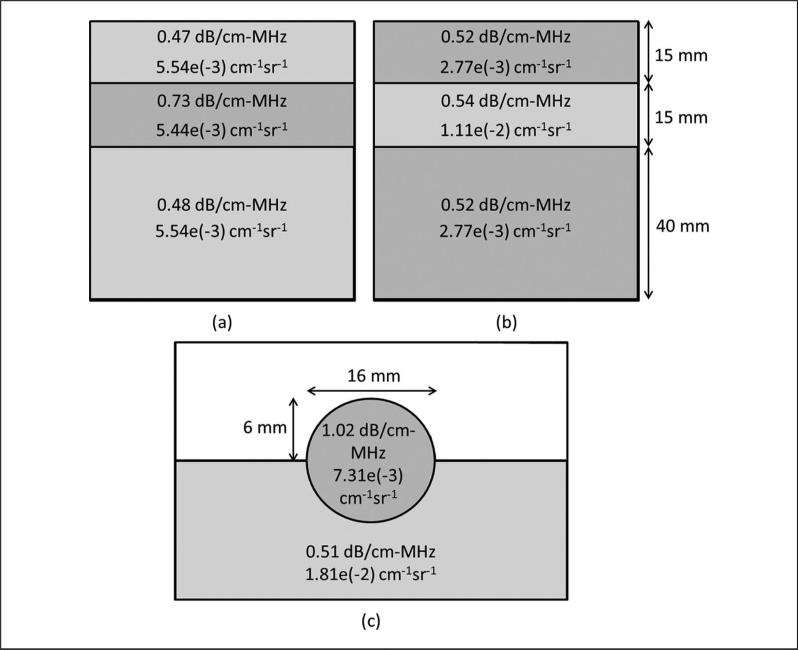
The first phantom consists of three different layers stacked atop one another.14 The middle layer has a higher attenuation than the top and bottom, and the three layers all have the same BSC; hence, this phantom is referred to as the constant-BSC (CB) three-layer phantom. Because of the low signal amplitude received from the third layer, only the data from the top two layers of the phantom were usable. The second phantom is constructed similarly to the first, but with constant attenuation (CA) through all three layers and a higher BSC in the middle layer. This phantom is thus called the CA three-layer phantom. The reference used for the CB and CA phantoms was the material of the third layer of the CA phantom, acquired by placing the transducer on the side of the phantom such that only the material of the third layer was present in the acquired image. The third phantom, referred to as the rodent phantom,16 consists of a sphere partially embedded in a background material with a higher BSC and lower attenuation than the sphere. The reference used for the rodent phantom was the background material of the phantom, acquired in a separate scan, which omitted the spherical inclusion. Diagrams of the three phantoms are shown in Figure 1. The BSC values in Figure 1 were calculated using Faran's theory17 with the exception of the rodent phantom background BSC, which was measured directly.
Figure 1.
Diagrams of (a) the constant-BSC three-layer phantom, (b) constant attenuation three-layer phantom, and (c) rodent phantom.
The first value in each region is the attenuation slope and the second value is the backscatter coefficient at 10 MHz.
BSC = backscatter coefficient.
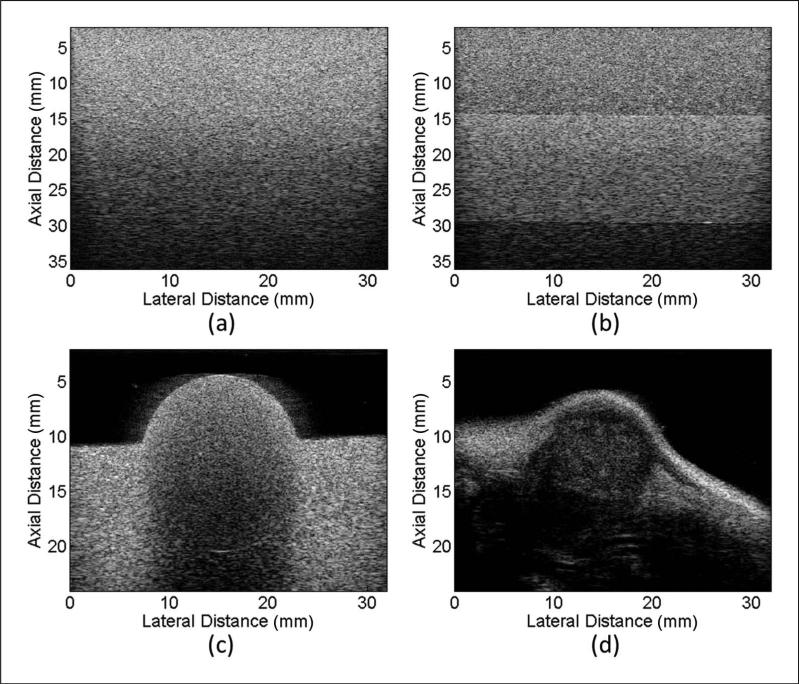
RF data of a MAT tumor of a Sprague-Dawley rat (Harlan Laboratories, Inc., Indianapolis, Indiana) were acquired using a well-characterized phantom as the reference. The attenuation properties for the three phantoms and the MAT tumor are summarized in Table 1. The known attenuation slope (AS) value for MAT tumors presented in Table 1 is the average AS for seven freshly excised MAT tumors. The AS values were obtained using a standard insertion loss4 technique as part of a different study. The experimental conditions were approved by the University of Illinois Institutional Animal Care and Use Committee. B-mode images of all four samples are shown in Figure 2.
Table 1.
Attenuation Slopes for Samples Used in This Study.
| Estimated Attenuation Slope (dB/cm-MHz) |
||||
|---|---|---|---|---|
| Phantom | Location | Attenuation Slope (dB/cm-MHz) | M | SD |
| Constant-BSC three-layer phantom | Top | 0.47 | 0.50 | 0.08 |
| Middle | 0.73 | 0.71 | 0.11 | |
| Boundary | x | 0.57 | 0.14 | |
| Constant attenuation three-layer phantom | Top | 0.52 | 0.51 | 0.11 |
| Middle | 0.54 | 0.54 | 0.12 | |
| Boundary | x | 0.01 | 0.44 | |
| Rodent phantom | Sphere | 1.02 | 1.00 | 0.10 |
| Background | 0.51 | 0.58 | 0.11 | |
| Boundary | x | 0.56 | 0.22 | |
| MAT tumor | Interior | 0.71 ± 0.09 | 0.83 | 0.19 |
BSC = backscatter coefficient; MAT = mammary adenocarcinoma tumor. The x symbol is to indicate that there isn't an accepted attenuation slope for the boundary regions of the phantoms.
Figure 2.
B-mode images of (a) the constant-BSC three-layer phantom, (b) constant attenuation three-layer phantom, (c) rodent phantom, and (d) rat mammary adenocarcinoma.
BSC = backscatter coefficient.
Ultrasound attenuation is often approximated as a power-law function of frequency:
| (1) |
where α is the attenuation coefficient, f is the frequency, a is a positive constant, and n > 0. A special case of the power-law attenuation function is when n = 1. The result is that the attenuation coefficient becomes a linear function of frequency
| (2) |
where β is the attenuation coefficient versus frequency slope (AS) that characterizes the attenuation coefficient as a single parameter.
The attenuation coefficient was estimated from the ultrasonic backscattered RF data using the spectral difference reference phantom method.8 The estimation routine was implemented in MATLAB (The MathWorks, Natick, Massachusetts) as part of a graphical user interface (GUI) for estimating various QUS parameters. The GUI allows the user to manually segment the area of the B-mode image where AS estimates are to be made and specify the bandwidth used to make the estimates; in this study, the –10-dB bandwidth was used. Once the user has chosen the area, it is subdivided into many overlapping, rectangular ROIs, each of which yields an estimate of attenuation coefficient versus frequency. The AS is calculated by dividing the attenuation coefficient at each frequency point by that particular frequency and taking the mean of the quotients over the entire bandwidth.
The spectral difference method8 requires that each individual ROI be subdivided into axial sections to obtain the power spectrum at different depths through the ROI. The power spectrum is calculated by gating with a rectangular window, zero-padding to a length of 8192 points (at a sample frequency of 640 MHz), and computing a fast Fourier transform. Averaging the power spectra at a particular depth over all scan lines in the ROI yields the power spectral estimate for that depth. The size of the ROI was 5 × 5 mm, and the length of the rectangular gating function was 2 mm (approximately 1665 samples). These dimensions yield ROIs that are about 18 pulse lengths axially and include 80 scan lines in the lateral direction, as well as a gate length of 8 pulse lengths. The size of the ROI and the length of the axial sections were chosen according to previous findings using simulated RF echo data,18 which found that the full-width half-maximum bandwidth of the power spectrum does not change significantly for gate functions longer than 7 pulse lengths and that the standard deviation in AS estimates is about 5% for this size of ROI. The ROI overlap was set to 90% in the axial and lateral directions to create a fine-grained attenuation map.
Parametric images of attenuation are created by overlaying the spatial map of AS estimates on top of the original B-mode image. The pixel at position (x, y) is assigned a certain value according to the following formula:
| (3) |
where β is the AS value given to pixel (x, y), ASi is the estimated attenuation slope of ROIi, and N is the number of ROIs containing the point (x, y). More simply, β(x, y) is the mean of the AS estimates over all the rectangular ROIs that contain (x, y). For ROIs that overlap 90% axially and laterally, most pixels are the average of 110 local AS estimates. In accordance with convention, the units of AS used in this work are dB/cm-MHz. The total attenuation for each frequency point in the bandwidth is the cumulative sum of attenuation in the axial direction,
| (4) |
where αt(x, y, f) is the total attenuation in dB of frequency f at point (x, y) and Δy is the axial distance between sample points.
Results
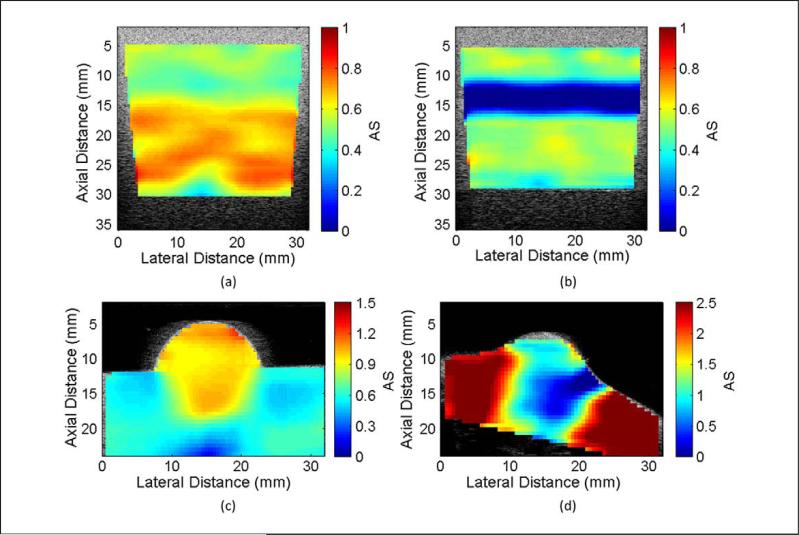
Parametric images of AS for the four samples are shown in Figure 3. The image of the CB phantom shows the change in AS that occurs near the 15-mm depth, which is not observed in the B-mode image. Along the border where the attenuation of the phantom changes, a gradual fading from the lower to the higher AS value can be seen as depth increases. The image of the CA phantom shows a negative AS near the 15-mm boundary between layers. Because the spectral difference method assumes that the BSC is constant throughout an ROI, the larger spectral amplitude due to the increase in BSC results in negative AS estimates along the border. This is the critical factor that limits the use of the spectral difference method and will be discussed further in the “Discussion” section. The image of the rodent phantom indicates that the spherical region has different attenuation properties than the rest of the phantom. The circular shape is well defined in the upper hemisphere but is less well-defined on the border between the different phantom regions. This is once again due to the blending of AS values for ROIs that lie along the border. A similar effect can be seen for the parametric image of the MAT tumor where the lower attenuation of the tumor blends into the areas of higher attenuation outside the tumor. Any ROI with an estimated AS greater than 2.5 dB/cm-MHz appears as the same dark red color. The average AS for the interior of the MAT tumor was 0.83 ± 0.19 dB/cm-MHz.
Figure 3.
Parametric attenuation slope images overlaid on B-mode images for (a) the constant-BSC three-layer phantom, (b) constant attenuation three-layer phantom, (c) rodent phantom, and (d) rat mammary adenocarcinoma.
BSC = backscatter coefficient.
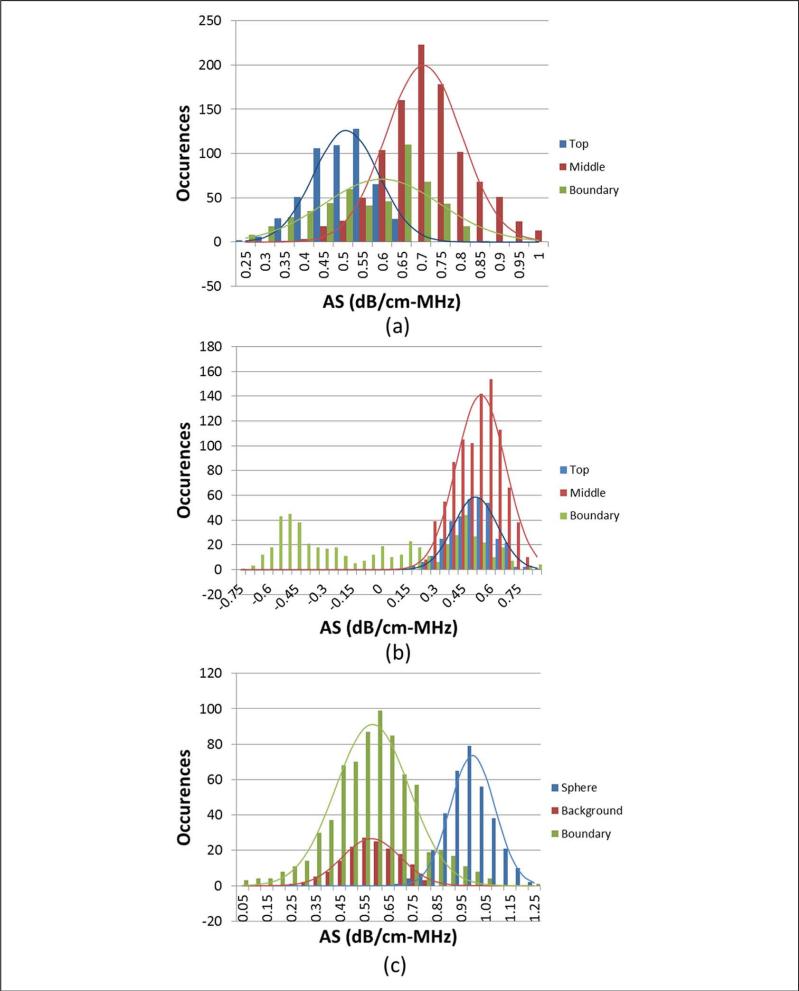
Although visual inspection of the AS images shows good contrast between regions in the three phantoms, it is also desired that the estimates themselves be accurate to the actual properties of the phantoms. To investigate this, the ROIs from each phantom sample were sorted into three groups according to their positions. For the CA and CB phantoms, the groups were ROIs completely inside the top layer, ROIs completely inside the middle layer, or ROIs intersecting the boundary between the two layers. For the rodent phantom, the groups were ROIs completely inside the sphere, ROIs completely outside the sphere (in the background material), or ROIs intersecting the boundary between sphere and background. Histograms of the AS estimates for the phantoms are shown in Figure 4, with the mean and standard deviation of each region given in Table 1. The sorting of ROI was not done for the MAT tumor because the tissue surrounding the tumor had unknown attenuation properties. The mean values for the nonboundary ROI show good agreement with the known attenuation values listed in Table 1.
Figure 4.
Histograms of attenuation slope estimates for (a) constant-BSC three-layer phantom, (b) constant attenuation three-layer phantom, and (c) rodent phantom.
BSC = backscatter coefficient.
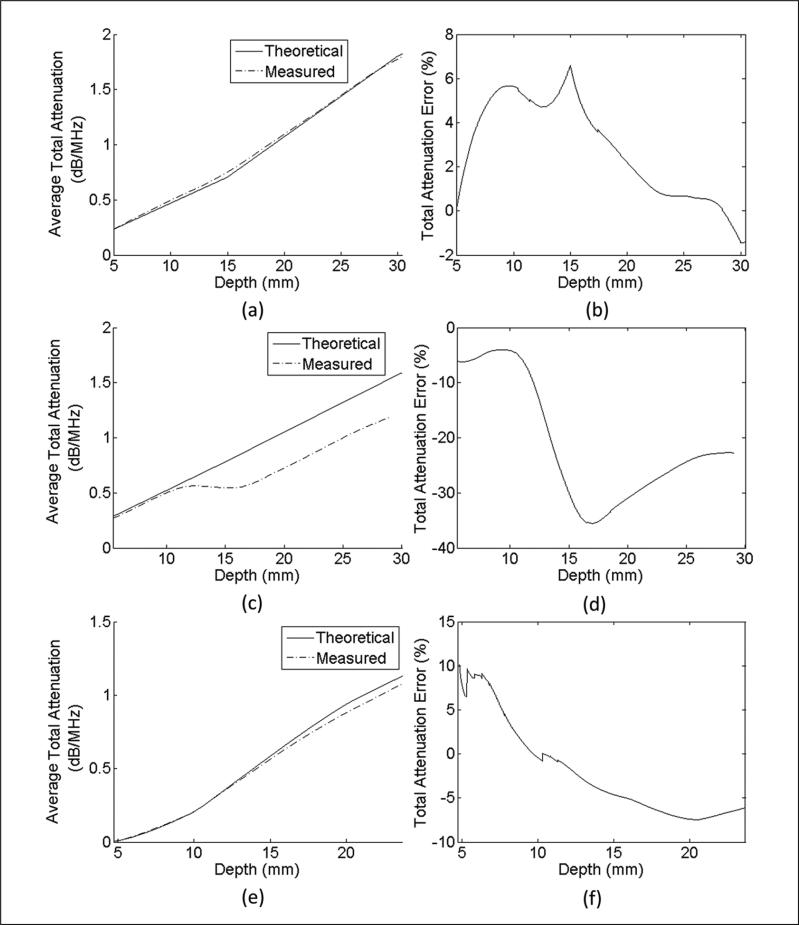
The total attenuation was calculated, and the average error versus depth is shown in Figure 5. The average percentage error over all points was 0.39 ± 5.81% for the CB phantom, –20.86 ± 11.06% for the CA phantom, and 0.35 ± 11.50% for the rodent phantom. The average percentage error over all points inside the MAT tumor was 35.29 ± 38.92%. Although this error appears to be high, the average absolute error of total attenuation of the MAT is only 0.14 dB/MHz. The percentage error values are true for any frequency in the bandwidth because the attenuation coefficient is assumed to be a linear function.
Figure 5.
Estimated total attenuation and total attenuation derived from independent laboratory measurements versus depth for (a) constant-BSC three-layer phantom, (c) constant attenuation three-layer phantom, and (e) rodent phantom, and percentage error of total attenuation versus depth for (b) constant-BSC three-layer phantom, (d) constant attenuation three-layer phantom, and (f) rodent phantom.
BSC = backscatter coefficient.
Discussion
The histograms in Figure 4 show that when separating the ROI in the manner described above, there is a distribution of estimated AS values for the different regions. For the ROIs that lie on the boundary, this is to be expected because the estimated attenuation will be affected by what percentage of the ROI is within each of the two regions of differing attenuation or BSC. But for ROIs that are wholly contained in a section of uniform acoustic properties, a much narrower distribution of AS values would be expected. There are several reasons to explain the wide distribution of estimates. The first reason could be that the phantom layers themselves are not completely uniform with respect to attenuation. This is not believed to be the case as it has been seen in separate experiments using a through-transmission method that the phantoms are very uniform with a narrow distribution of attenuation values. The second, and more likely, reason is that the ROI size was not sufficiently large to obtain the desired consistency of estimates. The attenuation estimator was tested using simulated RF data to verify that consistent estimates can be made. It was seen that the variance of the AS estimates decreased as the axial and lateral dimensions of the ROI were increased. However, the simulations suggested that to obtain a standard error less than 5% with the phantom data, the ROI dimensions would need to be at least 12 × 12 mm. Thus, a tradeoff between the ROI size and the variance in estimates must be found, and in this work, the ROI size chosen yielded average errors less than 20% for all nonboundary regions of the phantoms.
The ROI falling on the boundary regions of the CB and rodent phantoms generally yielded an intermediate AS between that of the two discrete layers. The estimates of the CA phantom were very inaccurate and contained negative values because of the change in BSC between the top and middle layers. The estimation errors are mitigated slightly by the averaging of overlapping ROI; however, the inaccuracies caused by the change in BSC are still large. A partial solution to this problem would be to filter out ROIs that are believed to lie in regions of changing BSC when generating the attenuation image. This could be done in a variety of ways such as setting a maximum threshold for the amplitude change in BSC with depth. In situations with many layers of changing BSC, the spectral difference would simply be too ill suited for the task, and a different method would need to be selected.
The results when calculating the total attenuation are unbiased with very low average errors for the CB and rodent phantoms. The reason for the higher standard deviation for the rodent phantom is likely due to the total attenuation being very small at the interface between the water and the phantom. This will register a high percentage error while the absolute error is less than 0.01 dB/MHz for points very close to the water boundary. Due to the inaccurate AS estimates of the CA phantom occurring at the boundary between layers, the total attenuation is underestimated beginning at 11 mm. At depths below the boundary, the total attenuation increases at the correct rate; however, due to the low AS estimates at the boundary, the total attenuation is still underestimated.
The AS images presented show clearly defined regions of differing attenuation in all of the samples shown. The values are in good quantitative agreement with the known values for the phantoms with the percentage error of the mean values never exceeding 6.3% in all cases except for the rodent phantom background, which had an error of 13.7%. The estimates obtained from the MAT tumor differed by 16.4% from independent laboratory measurements made for this type of tumor (and shown in Table 1). These spatial maps are also useful for determining the total attenuation values needed to compensate for attenuation when calculating the BSC. Hence, the attenuation images can serve the dual purpose of quantitative imaging and providing an accurate method of attenuation compensation for BSC calculations.
Acknowledgments
Funding
The authors disclosed receipt of the following financial support for the research, authorship, and/or publication of this article: This work was supported by the National Institutes of Health Grant R01CA111289.
Footnotes
Declaration of Conflicting Interests
The authors declared no potential conflicts of interest with respect to the research, authorship, and/or publication of this article.
References
- 1.Insana MF, Wagner RF, Brown DG, Hall TJ. Describing small-scale structure in random media using pulse-echo ultrasound. J Acoust Soc Am. 1990;87:179–92. doi: 10.1121/1.399283. [DOI] [PMC free article] [PubMed] [Google Scholar]
- 2.Maklad NF, Ophir J, Balsara V. Attenuation of ultrasound in normal liver and diffuse liver disease in vivo. Ultrason Imaging. 1984;6:117–25. doi: 10.1177/016173468400600201. [DOI] [PubMed] [Google Scholar]
- 3.Langton CF, Palmer SB, Porter RW. Measurement of broadband ultrasonic attenuation in cancellous bone. Eng Med. 1984;13:89–91. doi: 10.1243/emed_jour_1984_013_022_02. [DOI] [PubMed] [Google Scholar]
- 4.Chivers R, Hill C. Ultrasonic attenuation in human tissue [measurement method]. Ultrasound Med Biol. 1975;2:25–29. doi: 10.1016/0301-5629(75)90038-1. [DOI] [PubMed] [Google Scholar]
- 5.Fink M, Hottier F, Cardoso J. Ultrasonic signal processing for attenuation measurement: short time Fourier analysis. Ultrason Imaging. 1983;5:117–35. doi: 10.1177/016173468300500202. [DOI] [PubMed] [Google Scholar]
- 6.Haak A, Hafez ZT, Anderson JJ, Herd M-T, Nam K, Madsen EL, et al. Algorithm for estimating the attenuation slope from backscattered ultrasonic signals. Proc Ultrason Symp. 2009:1946–49. [Google Scholar]
- 7.Kim H, Varghese T. Hybrid spectral domain method for attenuation slope estimation. Ultrasound Med Biol. 2008;34:1808–19. doi: 10.1016/j.ultrasmedbio.2008.04.011. [DOI] [PubMed] [Google Scholar]
- 8.Yao LX, Zagzebski JA, Madsen EL. Backscatter coefficient measurements using a reference phantom to extract depth-dependent instrumentation factors. Ultrason Imaging. 1990;12:58–70. doi: 10.1177/016173469001200105. [DOI] [PubMed] [Google Scholar]
- 9.Zagzebski JA, Gerig A, Chen Q, Tu H, Liu W, Varghese T, et al. Parametric imaging using a clinical scanner. IEEE Ultrason Symp. 2004:2165–68. [Google Scholar]
- 10.Dines KA, Kak AC. Ultrasonic attenuation tomography of soft tissues. Ultrason Imaging. 1979;1:16–33. doi: 10.1177/016173467900100102. [DOI] [PubMed] [Google Scholar]
- 11.Schreiman JS, Gisvold JJ, Greenleaf JF, Bahn RC. Ultrasound transmission computed tomography of the breast. Radiology. 1984;150:523–30. doi: 10.1148/radiology.150.2.6691113. [DOI] [PubMed] [Google Scholar]
- 12.Duric N, Littrup P, Poulo L, Babkin A, Pevzner R, Holsapple E, et al. Detection of breast cancer with ultrasound tomography: first results with the Computed Ultrasound Risk Evaluation (CURE) prototype. Med Phys. 2007;34:773–85. doi: 10.1118/1.2432161. [DOI] [PubMed] [Google Scholar]
- 13.Bigelow TA, Oelze ML, O'Brien WD., Jr Estimation of total attenuation and scatterer size from backscattered ultrasound waveforms. J Acoust Soc Am. 2005;117:1431–439. doi: 10.1121/1.1858192. [DOI] [PubMed] [Google Scholar]
- 14.Nam KWD, Zagzebski JA, Hall TJ. Simultaneous backscatter and attenuation estimation using a least squares method with constraints. Ultrasound Med Biol. 2011;37:2096–104. doi: 10.1016/j.ultrasmedbio.2011.08.008. [DOI] [PMC free article] [PubMed] [Google Scholar]
- 15.Nam K, Rosado-Mendez IM, Wirtzfeld LA, Ghoshal G, Pawlicki AD, Madsen EL, et al. Comparison of ultrasound attenuation and backscatter estimates in layered tissue mimicking phantoms among three clinical scanners. Ultrason Imaging. doi: 10.1177/0161734612464451. (in press) [DOI] [PMC free article] [PubMed] [Google Scholar]
- 16.Nam K, Rosado-Mendez IM, Wirtzfeld LA, Pawlicki AD, Kumar V, Madsen EL, et al. Ultrasonic attenuation and backscatter coefficient estimates of rodent-tumor-mimicking structures: comparison of results among clinical scanners. Ultrason Imaging. 2011;33:233–50. doi: 10.1177/016173461103300403. [DOI] [PMC free article] [PubMed] [Google Scholar]
- 17.Faran JJ. Sound scattering by solid cylinders and spheres. J Acoust Soc Am. 1951;23:405–18. [Google Scholar]
- 18.Labyed Y. PhD dissertation. Iowa State University; 2011. Optimization and application of ultrasound attenuation estimation algorithms. [Google Scholar]


