Abstract
Fluorescent biosensors based on environmentally sensitive dyes enable visualization and quantification of endogenous protein activation within living cells. Merocyanine dyes are especially useful for live cell imaging applications as they are extraordinarily bright, have long wavelengths of excitation and emission, and can exhibit readily detectable fluorescence changes in response to environment. We sought to systematically examine the effects of structural features on key photophysical properties, including dye brightness, environmental responsiveness, and photostability, through the synthesis of a library of 25 merocyanine dyes, derived from combinatorial reaction of 5 donor and 5 acceptor heterocycles. Four of these dyes showed optimal properties for specific imaging applications and were subsequently prepared with reactive side chains and enhanced aqueous solubility using a one-pot synthetic method. The new dyes were then applied within a biosensor design for Cdc42 activation, where dye mero60 showed a remarkable 1470% increase in fluorescence intensity on binding activated Cdc42 in vitro. The dye-based biosensors were used to report activation of endogenous Cdc42 in living cells.
INTRODUCTION
Visualizing protein activation dynamics in vivo has proven essential to understanding how signaling networks are transiently configured to generate different cell phenotypes.1–3 Fluorescent biosensors have become a valuable tool for quantifying the spatio-temporal dynamics of cellular signaling.4–7 Biosensors based on environment sensing fluorescent dyes can provide important advantages: 1) they can be brighter than fluorescent proteins, 2) unlike biosensors based on fluorescence resonance energy transfer (FRET), their fluorescence is the product of direct rather than indirect excitation, and 3) in some biosensor designs they report the conformational changes of endogenous, unmodified proteins.8–11 Nonetheless, currently available environment-sensing dyes for use in live cell imaging applications often suffer from one or more limitations, including less than adequate changes in fluorescence response on target binding, insufficient brightness, poor photostability, and/or short fluorescence wavelengths that are toxic to cells and overlap with autofluorescence. Elegant studies have resulted in several fluorophores that are sensitive to their environment and have been used to report protein activity in vitro.12, 13 For applications in vivo, a dye must be capable of providing sufficient signal/noise to report protein activities at biosensor concentrations that minimally perturb normal physiology. This is a product of both the fluorescence change in response to protein activity, and the brightness of the dye. Dyes used in vitro sometimes undergo impressive changes in fluorescence intensity, but are too dim to be used in living systems. Here we focus on fluorophores with the requisite combination of brightness and fluorescence responsiveness for use in living cells.
Merocyanine dyes are characterized by electron donor and acceptor components linked by conjugation, usually a system of double bonds. This results in a ground state that may be represented as a resonance hybrid of charged and uncharged forms.14, 15 The potential for resonance delocalization across the polyene system renders these dyes especially sensitive to the effects of hydrogen bonding from the surrounding solvent.16 Changes in the local solvation environment can result in large changes in fluorescence intensity, as well as shifts in excitation and emission maxima. These changes can be used in quantitative live cell imaging applications to measure the activity of a target protein, usually by attaching the dyes to an ‘affinity reagent’ that binds only to the activated stated of the targeted protein. When the affinity reagent binds the activated, endogenous target, the dye is placed in a different solvent environment, leading to fluorescence changes.10, 17 Dyes can also be directly attached to the protein of interest to report conformational changes.17–20
Pioneering work by Brooker demonstrated that absorbance properties of the merocyanines are strongly affected by varying the terminal donor and acceptor groups21–24, and later studies confirmed the profound effect on fluorescence properties that arises from the use of different donor and acceptor components.25–29 Nonetheless, a relatively small number of specific donor-acceptor combinations have been synthesized and fully characterized with respect to the photophysical properties relevant to live cell imaging. In the present work, 25 merocyanine dyes were prepared, each with a different combination of donor and acceptor groups, in order to examine structure-property relationships and to identify dyes with optimal characteristics for different types of imaging applications. Four of these dyes that showed the most promising characteristics were further prepared as water soluble derivatives containing a reactive side chain for protein labeling and utilized to measure the GTP-induced activation of Cdc42.
EXPERIMENTAL PROCEDURES
Materials and Methods
1,2-Diphenyl-3,5-pyrazolidinedione was purchased from Acros Organics. 2,3,3-Trimethylindolenine was purchased from TCI America. All other reagents were purchased from Sigma-Aldrich. Reactions were run using anhydrous solvents. Microwave reactions were carried out on a CEM Discovery instrument. Automated column chromatography was performed using a Teledyne-Isco Combiflash Rf system. UV-visible spectra were obtained with a Hewlett-Packard 8453 diode array spectrophotometer. HPLC separations were performed on Shimadzu Prominence system using a 250 × 21.2 mm, 15 micron Phenomenex C18 preparative column and elution at 8 mL/min with a gradient of 10% solvent B (H2O/ACN 5:95, TFA 0.05%) 90% solvent A (H2O/ACN 95:5, TFA 0.05%) for 2 min, increasing to 90% solvent B over 30 min and held for a total of 45 min. Emission and excitation spectra were obtained using a Spex Fluorolog 2 spectrofluorometer at room temperature. Mass spectra were obtained on a Hewlett-Packard 1100 mass-selective detector (MS-ESI) using direct infusion. NMR spectra were obtained on Varian Mercury-300 or Inova-400 spectrometers. Reference peaks of 7.26 ppm (CDCl3), 3.31 ppm (MeOH-d4) and 2.50 ppm (DMSO-d6) were used for 1H spectra and 77.23 ppm (CDCl3) and 39.50 (DMSO-d6) for 13C spectra. All operations with dyes were performed under dim light.
General procedure for the quaternization of donor heterocycles
Representative example for compound I: 2,3,3-Trimethylindolenine (0.228 mL, 1.42 mmol) and iodomethane (0.444 mL, 7.09 mmol) were added to a small microwave vial and heated to 120 °C for 5 min. The mixture was cooled, filtered, and washed with ice-chilled ether to give 0.341 g (80%) pale pink powdery solid. Spectral data matched those previously reported.30 1H NMR (400 MHz, DMSO) δ 7.96 - 7.87 (m, 1H), 7.85 - 7.78 (m, 1H), 7.67 - 7.57 (m, 2H), 3.97 (s, 3H), 2.77 (s, 3H), 1.53 (s, 6H). 13C NMR (100 MHz, DMSO) δ 195.9, 142.0, 141.5, 129.2, 128.7, 123.2, 115.1, 53.9, 34.7, 21.7, 14.2.
General procedure for the preparation of acceptor heterocycles as the activated enol ether
Representative example for compound Pht: 1,3-Indandione (0.146 g, 1.00 mmol) was added to a small microwave vial with 1,1,3,3-tetramethoxypropane (0.823 mL, 5.00 mmol), followed by addition of trifluoroacetic acid (7.7 µL, 0.10 mmol). The vial was capped and heated to 150 °C for 15 min. The reaction was cooled and the precipitate was filtered and rinsed with ice chilled 3:1 hexanes/Et2O. Isolated 0.158 g (74%) brown solid. 1H NMR (400 MHz, CDCl3) δ 7.95 – 7.85 (m, 2H), 7.76 – 7.70 (m, 2H), 7.51 (d, J = 12.2 Hz, 1H), 7.42 (d, J = 12.3 Hz, 1H), 7.27 (dd, J = 12.4, 11.6 Hz, 1H), 3.93 (s, 3H). 13C NMR (100 MHz, CDCl3) δ 191.4, 190.5, 168.9, 145.0, 142.0, 140.7, 134.8, 134.7, 124.1, 123.0, 122.7, 103.9, 58.5.
General procedure for the synthesis of merocyanine dyes not bearing reactive side chains
Representative example for I-Pht: Donor I (38 mg, 0.13 mmol), sodium acetate (11 mg, 0.13 mmol), and acceptor Pht (21 mg, 0.10 mmol) were added to a small microwave vial and diluted in 1:1 MeOH/CHCl3 (1 mL). The vial was capped and heated to 75 °C for 30 min. The reaction mixture was cooled and concentrated with 250 mg SiO2 and eluted on a 12 g silica column with 0 – 3% MeOH in CH2Cl2 over 20 min. Isolated 29 mg (82%) dark blue solid. 1H NMR (400 MHz, DMSO) δ 8.12 (t, J = 13.1 Hz, 1H), 7.82 – 7.63 (m, 5H), 7.52 (dd, J = 17.4, 10.2 Hz, 2H), 7.33 (t, J = 7.7 Hz, 1H), 7.23 (d, J = 8.0 Hz, 1H), 7.12 (t, J = 7.4 Hz, 1H), 6.14 (d, J = 13.5 Hz, 1H), 3.49 (s, 3H), 1.62 (s, 6H). 13C NMR (100 MHz, CDCl3) δ 191.8, 168.1, 152.5, 146.6, 143.7, 142.2, 140.8, 140.1, 133.9, 133.7, 128.4, 123.0, 122.2, 122.1, 122.0, 120.8, 120.3, 108.5, 99.7, 47.8, 30.1, 28.5. MS-ESI m/z 356.2 ([M + H]+ requires 356.2).
3-[(3-bromopropyl)ammonio]propane-1-sulfonate (3)
Bromopropylamine hydrobromide (10.95 g, 50.0 mmol) and propane sultone (12.21 g, 100 mmol) were added together to a flame dried round bottom flask. The flask was evacuated and argon flushed and EtOH (100 mL) was added. After complete dissolution, Et3N (7.67 ml, 55.0 mmol) was added quickly drop wise and the reaction mixture was stirred at room temp under argon for 24 h. The resulting white precipitate was filtered and recrystallized from methanol to give 4.83 g (37%) white solid. 1H NMR (400 MHz, DMSO) δ 8.59 (s, 2H), 3.59 (t, J = 6.6 Hz, 2H), 3.14 – 2.93 (m, 4H), 2.62 (t, J = 6.7 Hz, 2H), 2.12 (p, J = 6.6 Hz, 2H), 1.93 (p, J = 6.8 Hz, 2H). 13C NMR (100 MHz, DMSO) δ 48.7, 46.7, 45.4, 30.9, 28.8, 21.9.
2,3,3-Trimethyl-1-(3-((3-sulfopropyl)amino)propyl)indolinium bromide (5)
Compound 3 (1.44 g, 5.54 mmol) was added to a flame dried round bottom flask and the flask was evacuated and flushed with argon. 2,3,3-Trimethylindolenine (4.44 mL, 27.7 mmol) was added and the flask was added to a pre-heated oil bath at 150 °C and stirred for 30 min. The flask was cooled to room temperature, and then further cooled in an ice bath. Excess liquid was decanted and further removed by syringe. The residue was rinsed with Et2O (3 × 10 mL), then dried under vacuum. The product was isolated as 1.86 g pink granular solid and used in the following step without further purification.
General procedure for the synthesis of conjugatable merocyanine dyes
Representative example for dye mero60: Compound 5 (0.628 g, 1.50 mmol), chloroacetic anhydride (0.855 g, 5.00 mmol), and NaOAc (0.246 g, 3.00 mmol) were dissolved in DMF (4 mL) under argon. After 10 min, acceptor Pht (0.214 g, 1.00 mmol) was added. The flask was covered in foil and allowed to stir at room temperature under argon for 24 h. The DMF was removed with addition of toluene (3 × 40 mL) in the presence of Celite (3 g) and the cake was eluted on a 24 g silica column with a 0 – 10% MeOH in CH2Cl2 gradient over 10 min, followed by 15 min at 10% MeOH. The main product containing fractions were combined, concentrated, and dried under vacuum to give a crude yield of 0.291 g dark blue crystalline solid.
The chloroacetamide dye intermediate (0.060 g, 0.100 mmol) was diluted in 1:1 MeOH/CHCl3 (2 mL) and sodium iodide (0.150 g, 1.00 mmol) was added. The flask was fitted with a condenser topped with a drying tube and the reaction was heated to reflux for 16 h. The solvent was then removed and the crude reaction mixture was concentrated, diluted in methanol, and submitted to HPLC column purification to give 0.030 g (21% from Pht) dark blue crystalline solid. 1H NMR (400 MHz, DMSO) δ 8.12 (t, J = 13.1 Hz, 1H), 7.79 – 7.67 (m, 5H), 7.57 (dd, J = 13.1, 9.5 Hz, 1H), 7.50 (d, J = 7.5 Hz, 1H), 7.38 – 7.28 (m, 1H), 7.23 (d, J = 8.0 Hz, 1H), 7.13 (t, J = 7.2 Hz, 1H), 6.26 (d, J = 13.4 Hz, 1H), 4.05 – 3.82 (m, 4H), 3.52 – 3.36 (m, 4H), 2.48 – 2.37 (m, 2H), 2.00 – 1.72 (m, 4H), 1.64 (s, 6H). MS-ESI m/z 687.3 ([M − H]− requires 687.1).
General procedure for the synthesis of β-mercaptoethanol derivatives of conjugatable merocyanines
Representative example for dye mero60: Mero60 (6.6 mg, 9.6 µmol) was added to a 5 mL conical vial with DMSO (10 µL) and 50 mM aqueous Na2HPO4, pH 7.5 (490 µL). The mixture was stirred and β-mercaptoethanol (3.4 µL, 48 µmol) was added. The vial was capped, covered in foil, and stirred at room temp for 24 h. The reaction mixture was subjected neat to HPLC column purification. The main product fractions were combined, concentrated, and lyophilized to give 2.1 mg (33%) dark blue powdery solid.
Quantum yield determinations
Quantum yield (QY) values were determined using the following equation: QYsamp = QYstd (gradsamp / gradstd) (η2samp / η2std), where “grad” is equal to the slope of a plot relating the integrated emission to the absorbance (x axis) at a given concentration, using a minimum of four different concentrations per sample, and η is the refractive index of the solvent used for the fluorescence readings. Merocyanine 54031 and sulforhodamine 10132 were used as standards.
Photostability measurements
Each sample dye and fluorescein standard solution was prepared at 1 mM in degassed n-BuOH and placed in a capped 1 cm × 1 cm cuvette. Samples were irradiated with a 90 W halogen tungsten lamp with fan cooling to maintain a temperature of 25 °C ± 1 °C during the study. Absorbance measurements were taken prior to irradiation and at designated intervals during irradiation.
CBD-MBP dye labeling and Cdc42 binding assay
The Cdc42 binding domain (CBD) from Wiskott Aldrich Syndrome Protein (WASP) was covalently derivatized with dye to generate a biosensor, using protein sequences and methods described previously.10 Freshly prepared CBD fused to Maltose-binding protein for enhanced solubility (CBD-MBP,100 µL of a 132.5 µM stock solution in 50 mM Na2HPO4, pH 7.5 buffer) was mixed with 5 molar equivalents conjugatable dye in DMSO (3 uL of 20 – 25 mM solution) and stirred at room temperature for 2 h. The reaction was quenched by adding 1 µL of β-mercaptoethanol. Excess dye was removed by passing the reaction mixture through a 1 × 20 cm G-15 column pre-equilibrated with 50 mM Na2HPO4, pH 7.5 buffer and wrapped in aluminum foil. Labeling efficiency and concentrations of CBD-MBP dye conjugates were determined using absorption measurements at protein and dye maximum absorption wavelengths, using protein dissolved in DMSO to overwhelm solvent effects on dye and produce a sample with known extinction coefficient (see Table 5 for dye absorption maxima and extinction coefficients, CBD-MBP abs max = 280 nm, ε = 74830 M−1 cm−1). Dye-labeled CBD-MBP (100 nM in 50 mM Na2HPO4, 150 mM NaCl, pH 7.5 buffer) aliquots were treated with varying concentrations of Cdc42 Q61L (constitutively active mutant) and fluorescence intensity measurements were taken after incubation for 10 min at room temperature.
Live cell imaging of Cdc42 biosensors
Imaging experiments utilized a CBD-Cerulean C49S construct for fluorescence ratio analysis. Labeling reactions were carried out as for CBD-MBP. After size exclusion chromatography, the dye-labeled proteins were dialyzed in 50 mM Na2HPO4, pH 7.5 buffer at 4 °C overnight and then concentrated to 60 µM by centrifugation at 12000 rpm, 4 °C (Millipore, Amicon Ultra-0.5mL, MWCO 10K). NIH 3T3 mouse embryonic fibroblasts (MEFs) were microinjected with biosensor solution and imaged for 20 min with acquisition at every 1 min. Image processing was carried out as previously described.33, 34
RESULTS
Synthesis of the merocyanine library
Synthesis of the dyes utilized commercially available donor and acceptor components, with the exception of diethylbarbituric acid, which was synthesized using a previously described method.35 Donor and acceptor groups will be henceforth referred to by their letter code names, derived from the parent heterocycle, in order to clarify discussion36 (Table 1). Donor groups are ordered according to their Brooker basicity, with indolenine (I) being the weakest and quinoline (Q) the strongest.37, 38 Donor components of the dyes were activated for conjugation through quaternization with iodomethane (Table 1). Each acceptor ring was prepared as its corresponding methyl enol ether through acid catalyzed reaction with malonaldehyde bis(dimethyl) acetal (Table 2).
Table 1.
Synthesis of quaternized donor heterocycles.
 | ||||||
|---|---|---|---|---|---|---|
| heterocycle | donor code |
Brooker basicity a |
product | temp (°C) |
time (min) |
yield (%) |
| indolenine | I | 260 |  |
120 | 5 | 80 |
| benzoxazole | O | 345 |  |
100 | 20 | 51 |
| benzothiazole | S | 375 |  |
120 | 20 | 93 |
| thiadiazole | TD | - |  |
90 | 20 | 98 |
| quinoline | Q | 730 |  |
r.t.b | 15 | 95 |
From reference 15.
Reaction stirred at room temperature for time indicated without microwave heating.
Table 2.
Synthesis of activated acceptor enol ethers.
 | |||
|---|---|---|---|
| heterocycle | acceptor code |
product | % yield |
| phthal. | Pht | 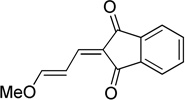 |
74 |
| barbituric acid | BA |  |
61 |
| benzothiophene | SO |  |
73 |
| thiobarbituric acid | TBA | 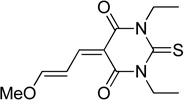 |
55 |
| pyrazolidine | Pz | 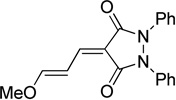 |
70 |
The dyes for initial screening were synthesized through reaction of an acceptor enol ether with a donor in the presence of 1.25 equivalents base (Table 3). All dyes were made with three intervening double bonds between the terminal heterocycles as this provided the optimum compromise between solvent-sensitive fluorescence and photostability.39, 40 Following reflux, the dyes were purified by column chromatography or in some cases by precipitation through concentration of the reaction mixture, followed by addition of diethyl ether and washing with MeOH. Donor Q did not react successfully with acceptors when using NaOAc and instead required the use of the stronger base N-methylpiperidine.
Table 3.
Preparation of the merocyanine library
 | ||||||
|---|---|---|---|---|---|---|
| acceptor | ||||||
 |
 |
 |
 |
 |
||
 |
I-Pht (82)a | I-BA (89) | I-SO (97) | I-TBA (93) | I-Pz (87) | |
| donor |  |
O-Pht (59) | O-BA (29) | O-SO (29) | O-TBA (85) | O-Pz (78) |
 |
S-Pht (72) | S-BA (70) | S-SO (78) | S-TBA (93) | S-Pz (70) | |
 |
TD-Pht (82) | TD-BA (61) | TD-SO (77) | TD-TBA (70) | TD-Pz (53) | |
 |
Q-Pht (56) | Q-BA (45) | Q-SO (20) | Q-TBA (69) | Q-Pz (39) | |
compound name (% yield)
Brightness and solvatochromism of the dyes
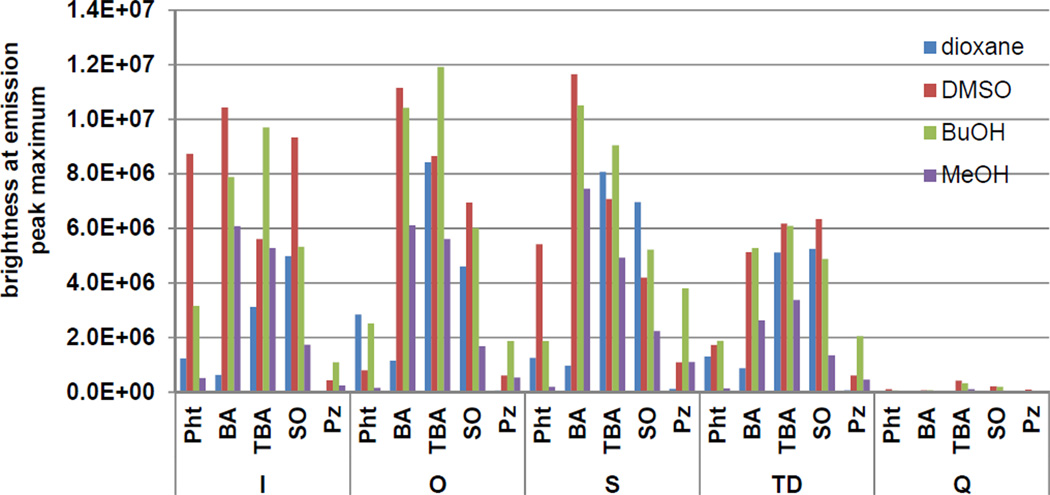
The synthesized library dyes were screened for relative brightness based on the fluorescence intensity value at the emission peak maximum (EPM) when the dye is excited at its excitation maximum. Given that the emission peak shapes for the dyes were generally similar, the EPM value provided a straightforward measurement that is useful for the comparison of brightness across a broad range of dye structures. The solvents 1,4-dioxane, dimethylsulfoxide (DMSO), butanol (BuOH), and methanol (MeOH) were used to evaluate the solvent-dependence of dye brightness (Table S1). These solvents were selected to provide a range of polarities as well as examples of both weak and strong hydrogen bonding.41, 42 Dyes with weaker donor groups such as indolenine (I), benzoxazole (O), and benzothiazole (S) tended to have the largest EPM values (Figure 1). As a whole, dyes containing the quinoline (Q) donor group were significantly dimmer than the other dyes. The presence of BA, TBA, or SO acceptor groups led to the highest brightness levels, regardless of the donor component of the dye. Conversely, the Pz acceptor group was associated with diminished relative brightness, regardless of the donor group with which it was paired. The reduced brightness for Pz-containing dyes may be attributable to an alternative de-excitation pathway generated through the unrestricted rotation of phenyl substituents around the C-N bonds.43 No clear trend was observed when the solvents were ordered based on dipolar characteristics but dye brightness in all cases was maximized in solvents with intermediate hydrogen bonding capacity. The fluorescence intensity of several of the brightest dyes (EPM > 8 ×10⁶) was strongly solvent-dependent. As solvent-dependent changes in brightness can be harnessed to report protein activity,11 this was an important consideration when selecting dyes for synthesis of reactive derivatives (see below).
Figure 1.
Brightness values at the emission peak maximum when exciting the dye at its excitation maximum. Values are grouped by donor heterocycle and are presented for the set of 4 solvents (dioxane, DMSO, BuOH, MeOH) in order of increasing hydrogen bonding capacity.
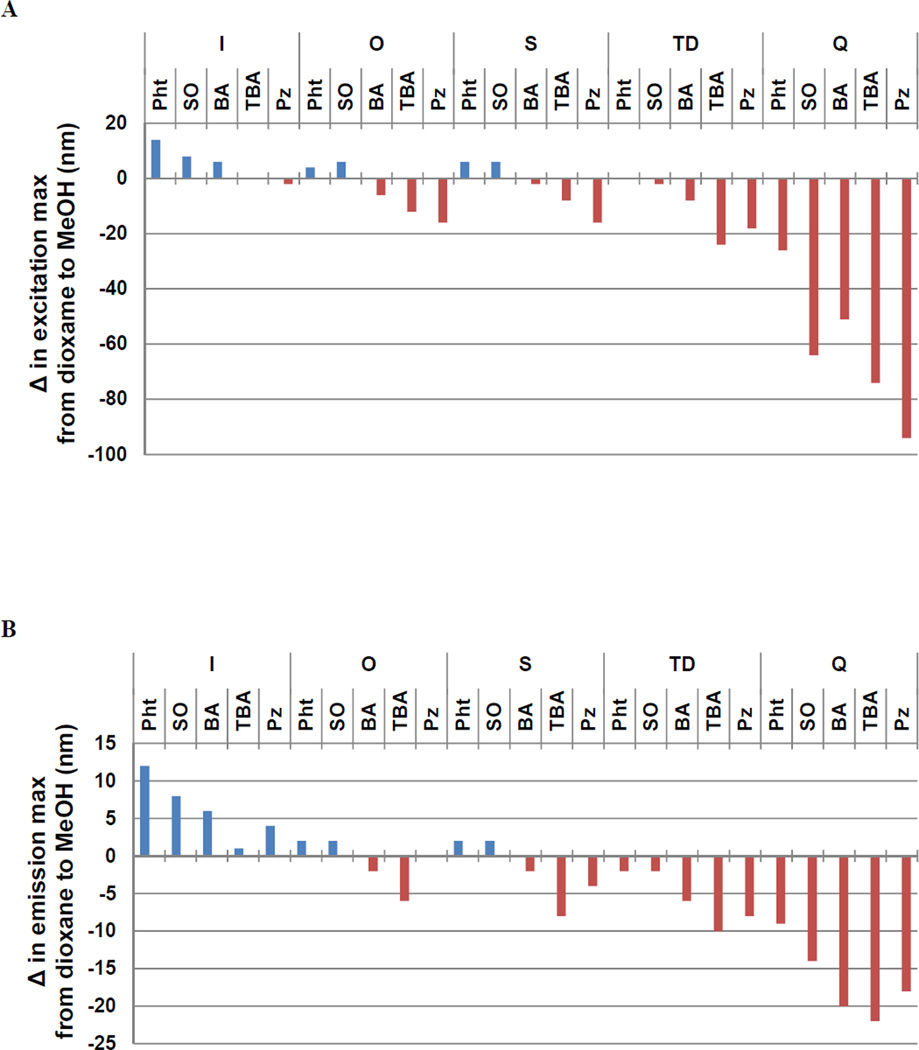
Excitation and emission maxima of the dyes in each of the four solvents were also recorded. Most of the solvatochromic shifts were modest (<20 nm), especially among the weaker donor groups (Figure S1). The largest shifts were seen among the Q donor group dyes, which uniformly exhibited negative solvatochromism (Figure 2). A hypsochromic shift when going from low to high polarity solvent (e.g. from dioxane to MeOH, Figure 2) is typically observed when the ground state structure of the dye is more dipolar than that of the excited state. This result would be consistent with an increased propensity of the quinoline heterocycle to establish aromaticity in the ground state relative to the other donor groups.
Figure 2.
Change in the λ max of excitation (A) and emission (B) from non-polar (1,4-dioxane) to polar (methanol) solvent.
Photostability measurements
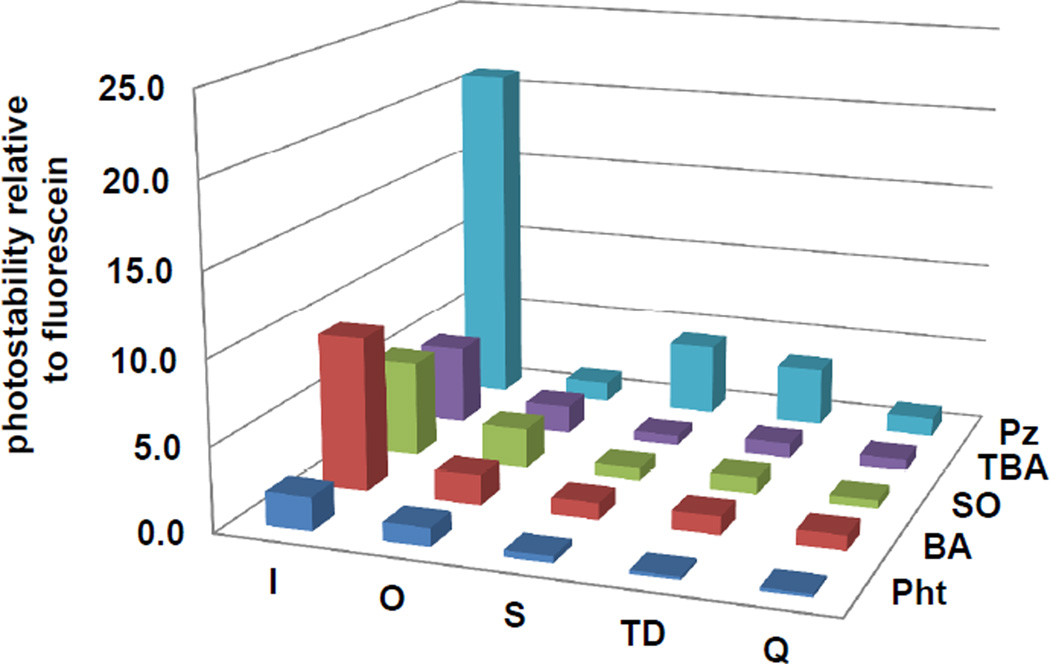
A previously reported method,9 was used to determine the photobleaching rates of each dye relative to fluorescein44 (Figure 3). The most photostable dyes contained the weakest donor (I) and values fell sharply with increasing donor strength. Dyes containing the Pz acceptor group tended to show greater photostability relative to other acceptor groups in the library. Photobleaching in merocyanines is thought to be mediated by singlet oxygen attacking the polyene chain due to its strongly electrophilic character.9 In dyes with weaker donors, such as I, electron density in the polyene is reduced and therefore the extent of reaction with excited oxygen species and subsequent disproportionation reactions would also be decreased.
Figure 3.
Photostability of library dyes. Photostability values were calculated as: (photobleaching rate of fluorescein) / (photobleaching rate of dye).
Selection and synthesis of water soluble, conjugatable merocyanines
Several dyes showed extraordinary and useful combinations of brightness, photostability, and solvent-dependent fluorescence. We therefore developed these further by incorporating water solubilizing and reactive side chains to generate derivatives that could be used for protein labeling. Dyes containing the I donor group were selected based on their photostability and because the geminal dimethyl group of I is known to assist in limiting dye aggregation that can result in reduced solubility and fluorescence.9 Despite the considerable photostability of I-Pz, this dye was not selected for further development due to its low brightness. Although the dyes containing donor Q showed the greatest solvatochromism, their poor photostability and relatively low brightness led us to eliminate them from further consideration.
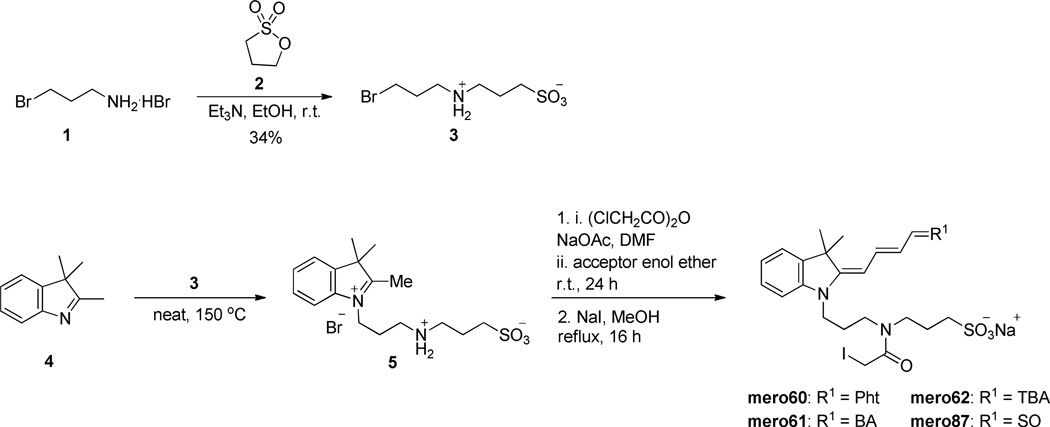
Synthesis of the water soluble, conjugatable versions of the selected dyes began with reaction of 1-bromopropylamine with propane sultone to give 3-((3-bromopropyl)amino)propane-1-sulfonic acid (3, Scheme 1). The donor heterocycle was then quaternized with compound 3 and subsequently coupled with the acceptor enol ether in the presence of chloroacetic anhydride and sodium acetate using a one-pot procedure.45 Refluxing in MeOH for 3 h in the presence of an excess of NaI gave merocyanines containing iodoacetamide (IAA) for protein labeling. Consistent with the nomenclature for merocyanines used in our lab,11 these conjugatable dyes were named mero60, mero61, mero62, and mero87 (Table 4). Physical constants were obtained for both the reactive derivatives and for beta-mercaptoethanol adducts that eliminate effects of iodine on quantum yield, and better mimic dye attached to protein.
Scheme 1.
Synthesis of water soluble, conjugatable merocyanines.
Table 4.
Photophysical properties of functionalized merocyanines.
| dye name | % yield (from enol ether) |
solvent | QYa | εb | QY × ε | λmax (nm) absorption |
λmax (nm) emission |
|---|---|---|---|---|---|---|---|
| mero60 | 21 | DMSO | 0.37 | 126000 | 46620 | 593 | 620 |
| MeOH | 0.02 | 133000 | 2660 | 591 | 614 | ||
| BuOH | 0.16 | 132000 | 21120 | 593 | 616 | ||
| H2O | <0.01 | 106000 | 11 | 595 | 608 | ||
| mero61 | 26 | DMSO | 0.37 | 100000 | 37035 | 570 | 595 |
| MeOH | 0.07 | 167000 | 11690 | 565 | 588 | ||
| BuOH | 0.17 | 146000 | 24820 | 570 | 592 | ||
| H2O | 0.03 | 131000 | 3930 | 565 | 586 | ||
| mero62 | 21 | DMSO | 0.20 | 135000 | 27000 | 597 | 615 |
| MeOH | 0.09 | 140000 | 12600 | 590 | 608 | ||
| BuOH | 0.18 | 139000 | 25020 | 594 | 614 | ||
| H2O | 0.10 | 36000 | 3600 | 585 | 608 | ||
| mero87 | 33 | DMSO | 0.34 | 140000 | 47600 | 592 | 620 |
| MeOH | 0.06 | 107000 | 6420 | 588 | 620 | ||
| BuOH | 0.21 | 111000 | 23310 | 591 | 622 | ||
| H2O | 0.02 | 81000 | 1620 | 592 | 616 | ||
| mero60-BME | - | DMSO | 0.66 | 124000 | 81870 | 595 | 618 |
| mero61-BME | - | DMSO | 0.55 | 116000 | 63800 | 570 | 594 |
| mero62-BME | - | DMSO | 0.41 | 142000 | 58220 | 596 | 614 |
| mero87-BME | - | DMSO | 0.27 | 105000 | 28350 | 590 | 620 |
| I-SOc | - | BuOH | 0.54 | 134000 | 72000 | 587 | 618 |
| OcOH | 0.98 | 125000 | 123000 | 587 | 617 | ||
| - | MeOH | 0.08 | 143000 | 11440 | 586 | 615 |
Quantum yield of fluorescence, error ± 10%.
Molar extinction coefficient, error ± 10%.
Values for I-SO as reported in ref.9 are included for comparison (see Discussion and Conclusions).
Biosensor applications
Conjugates of the reactive dyes with the Cdc42 binding domain (CBD) of Wiskott Aldrich Syndrome Protein (WASP) were prepared and evaluated for their ability to report the activated, GTP-bound conformation of Cdc42. As shown in previous studies using dye-labeled CBD as a biosensor for Cdc42 activity in vitro and in vivo,10 CBD binds selectively to the activated, GTP-bound conformation of Cdc42. Upon binding, a solvent-sensitive dye on CBD can respond to a change in environment as it is brought near Cdc42.
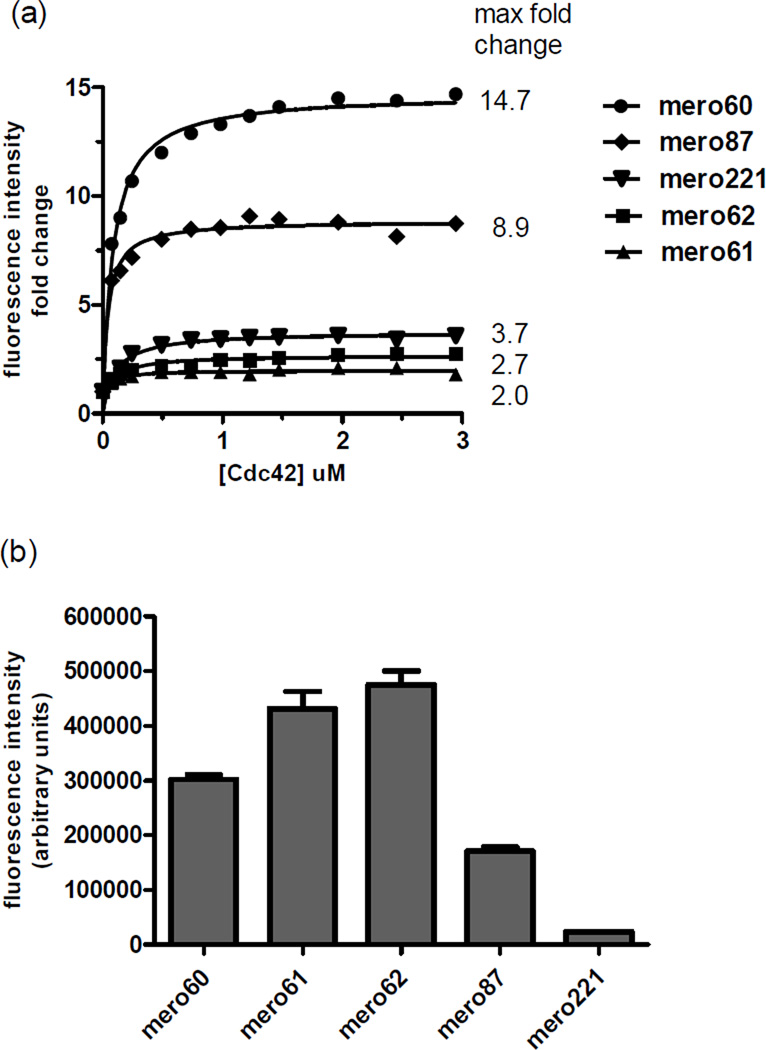
All of the newly prepared dyes exhibited an increase in fluorescence intensity on binding to activated Cdc42 in vitro, with mero60 showing a remarkable 14.7 fold increase (Figure 4a). The mero61 and mero62 dyes exhibited the greatest absolute brightness at saturating levels of Cdc42 (Figure 4b) but their brightness changes upon binding Cdc42 were smaller relative to mero60 and mero87 dyes due to their much higher initial brightness in aqueous solution (Figure S2). Biosensors based on these new dyes showed significant improvements in both brightness and extent of change upon Cdc42 binding relative to the mero221-based biosensor that has been used in other successful live cell studies (Figure S3).1, 10 Dissociation constant (Kd) values calculated for the binding of the meroCBD constructs to Cdc42 ranged from 144 ± 62 nM (mero61-CBD) to 186 ± 40 nM (mero87-CBD) (Figure S4). These values are similar to that of the previously reported Kd for mero221-CBD (150 ± 50 nM)10 and are slightly higher than that reported for the unlabeled CBD fragment (77 ± 9 nM).46 This relatively modest difference indicates that the presence of the dye does not substantially perturb the overall binding affinity.
Figure 4.
In vitro binding assay of dye labeled CBD to Cdc42. (a) Fold change increase of emission intensity upon binding of labeled CBD to Cdc42. (b) Maximum fluorescence intensity at saturated binding of Cdc42. Mero221 was used in previously published successful biosensor applications (see Figure S3 for structure and photophysical data).
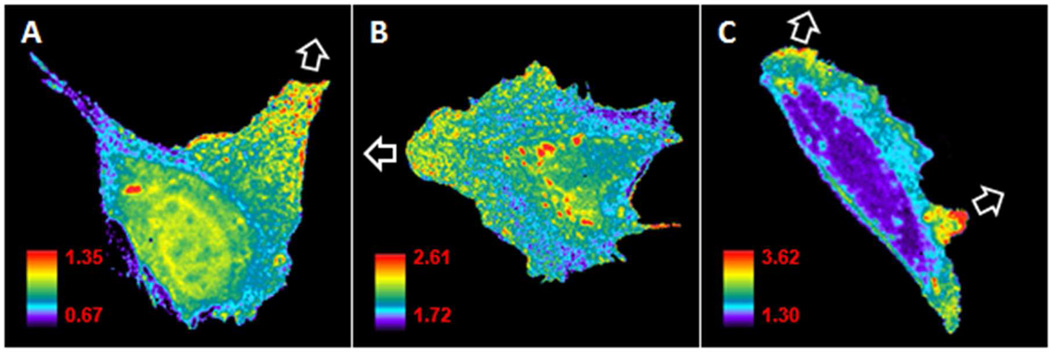
To test the dyes in live cell imaging applications, Cdc42 biosensors were prepared with each of the four new conjugatable dyes as well as the previously reported mero221. For these biosensors, CBD was fused to Cerulean fluorescent protein for ratio image analysis47 and mutation F271C was included for conjugation of the dye.33, 34 The biosensors were microinjected into mouse embryonic fibroblasts (MEFs) and used to examine the Cdc42 activity in constitutive cell protrusions and retractions (Figure 6).The biosensors based on mero61, mero62, and mero87 each reported endogenous Cdc42 activation during protrusion at the cell’s leading edge, consistent with previously reports of Cdc42 behavior (Figure 5). Although the mero60 biosensor had shown the greatest fluorescence change upon activation in vitro, its signal bleached too rapidly to provide Cdc42 data in vivo without using concentrations that clearly caused cell contraction and otherwise affected cell behavior.
Figure 5.
Cdc42 biosensors based on the new dyes show the localization of Cdc42 activation in moving MEF cells. Cells were injected with CBD biosensor labeled with mero61 (A), mero62 (B), or mero87 (C). Biosensors show increased Cdc42 activation in areas where the cell edge is protruding, as indicated by white arrows (see supplemental movies S1 – S3). Some activity is also seen at perinuclear compartments and in the nucleus of some cells, consistent with previous observations.10
DISCUSSION AND CONCLUSIONS
For imaging, it is useful to define dye brightness as the product of quantum yield and extinction coefficient (QY × ε), as this gauges the total light output per unit illumination intensity. By this measure, all dyes except mero62 showed maximum brightness values comparable to those of fluorophores frequently used as intracellular markers but which have little solvent-dependent fluorescence (e.g. Cy5, QY × ε = 67500,48 rhodamine = 61000,49 and eGFP = 3300050).
It is difficult to use our solvent-dependent fluorescence data to predict how each dye will behave in a given application. The brightness of these dyes on proteins will depend on the specific protein environment, and optimization of positioning is usually required to place the fluorophore in an environment mimicking a hydrophobic solvent, where most dyes are at their brightest. The fluorescence response of merocyanines is complex, involving interplay of multiple factors including solvent viscosity, local solvent polarity, and hydrogen bonding of specific dye heteroatoms.51–53 Physical constants were determined for β-mercaptoethanol adducts of the dyes, to mimic cysteine conjugates and eliminate the quenching effects of iodine.9 However even these brightness values may not be as large as when the dye is in a very hydrophobic protein environment. The reactive dyes could not be dissolved in highly nonpolar solvents, but the parent compound I-SO has been reported to reach a brightness value (QY × ε) of 123,000 in octanol, which is among the largest values reported for organic dyes.54
Although the solvent dependence studies of the screening library can be useful in guiding the selection of fluorophores likely to show a strong response to changes in protein environment, only direct testing can ultimately determine which dye will be best for any given biosensor application. The dyes showed different trends in their response to solvent, implying that each may show unique behavior on proteins. Mero62 achieved its maximum brightness in butanol, unlike all the other reactive dyes, which achieved maximum brightness in DMSO. Fluorescence in water was not measured in our initial screening assay because side chains for water solubilization had not been added to the dyes. For the reactive dye derivatives, QY × ε values in water were very low, consistent with previous studies indicating that biosensor response is due to increased shielding from water when biosensors interact with their targets.51–53 For the nonreactive versions of compounds that were later converted to reactive forms, solvent-dependent differences in brightness ranged from three to twenty fold. For the reactive versions of these same dyes, with values in water included, brightness varied from seven to twenty-nine fold. The brightness of mero60 was so low in water that the extent of increase could not be precisely quantified. However, mero60 was among the brightest dyes in organic solvents, indicating a potential for very large changes when it is used in favorable protein environments. None of the dyes showed a significant pH-dependent change in fluorescence intensity when tested from pH 5.0 to 8.0 for 6 hours (Figure S5).
There were several parent fluorophores that showed not only changes in fluorescence intensity, but also changes in excitation and emission maxima. Such fluorophores are very valuable for ratio imaging applications, as they can be used without adding a second fluorophore to the biosensor; however these dyes were not pursued because of their poor photostability. Additional structural modifications aimed at reducing the susceptibility of these dyes to photodegradative attack by singlet oxygen may make them useful for protein applications in the future.55
The potential of the new dyes in biosensor applications was demonstrated by making new versions of dye-based Cdc42 biosensors. When substituted for the dye mero221, which was utilized in a previously published biosensor that had proven successful in vivo, each of the new dyes produced a several fold improvement in brightness or change in fluorescence intensity upon protein binding. Dyes mero61, mero62, and mero87 proved to be superior to the original mero221, but mero60 was difficult to use because of its more rapid photobleaching. This dye underwent the largest fluorescence change upon protein activation, so still may prove valuable in screening assays and other applications not requiring repeated measurements over time.
In conclusion, the systematic variation of donor and acceptor groups on merocyanine fluorophores, coupled with the synthesis of reactive and water soluble derivatives, has led to a set of new dyes with proven utility for biosensor applications requiring solvent sensitive fluorescence. The combined properties of these dyes should enable experimentalists to develop biosensors that can effectively report endogenous protein activity at low intracellular biosensor concentrations, thereby reducing perturbation of normal cell physiology. Biosensors based on these dyes may be used to enhance the sensitivity of biophysical measurements across a range of potential applications in which a dye is directly conjugated to a protein or peptide to report conformational changes or ligand interactions.
Supplementary Material
ACKNOWLEDGMENTS
This research was supported by funding from the American Cancer Society (CJM 119169-PF-10-183-01-TBE) and the National Institutes of Health (GM057464 and GM094663). We are grateful to Betsy Clarke for her help in preparing this manuscript.
Footnotes
ASSOCIATED CONTENT
Supporting Information Available: Protein expression and purification protocols for CBD-MBP and CBD-Cerulean biosensors and for constitutively active Cdc42, cell culture and microinjection procedures, imaging acquisition parameters, cell migration movies, supplemental figures and tables, and characterization data for all other quaternized donors, acceptor enol ethers, library dyes, and conjugatable merocyanines. This material is available free of charge via the Internet at http://pubs.acs.org.
REFERENCES
- 1.Machacek M, Hodgson L, Welch C, Elliott H, Pertz O, Nalbant P, Abell A, Johnson GL, Hahn KM, Danuser G. Coordination of Rho GTPase activities during cell protrusion. Nature. 2009;461:99–103. doi: 10.1038/nature08242. [DOI] [PMC free article] [PubMed] [Google Scholar]
- 2.Cai X, Lietha D, Ceccarelli DF, Karginov AV, Rajfur Z, Jacobson K, Hahn KM, Eck MJ, Schaller MD. Spatial and temporal regulation of focal adhesion kinase activity in living cells. Mol. Cell. Biol. 2008;28:201–214. doi: 10.1128/MCB.01324-07. [DOI] [PMC free article] [PubMed] [Google Scholar]
- 3.Gardiner EM, Pestonjamasp KN, Bohl BP, Chamberlain C, Hahn KM, Bokoch GM. Spatial and temporal analysis of Rac activation during live neutrophil chemotaxis. Curr. Biol. 2002;12:2029–2034. doi: 10.1016/s0960-9822(02)01334-9. [DOI] [PubMed] [Google Scholar]
- 4.Hodgson L, Pertz O, Hahn KM. Design and optimization of genetically encoded fluorescent biosensors: GTPase biosensors. Methods Cell Biol. 2008;85:63–81. doi: 10.1016/S0091-679X(08)85004-2. [DOI] [PubMed] [Google Scholar]
- 5.Lawrence DS, Wang Q. Seeing is believing: peptide-based fluorescent sensors of protein tyrosine kinase activity. ChemBioChem. 2007;8:373–378. doi: 10.1002/cbic.200600473. [DOI] [PMC free article] [PubMed] [Google Scholar]
- 6.Zhang J, Allen MD. FRET-based biosensors for protein kinases: illuminating the kinome. Mol. BioSyst. 2007;3:759–765. doi: 10.1039/b706628g. [DOI] [PubMed] [Google Scholar]
- 7.Chen C, Yeh R, Yan X, Lawrence DS. Biosensors of protein kinase action: from in vitro assays to living cells. Biochim. Biophys. Acta, Proteins Proteomics. 2004;1697:39–51. doi: 10.1016/j.bbapap.2003.11.012. [DOI] [PubMed] [Google Scholar]
- 8.Hahn K, Toutchkine A. Live-cell fluorescent biosensors for activated signaling proteins. Curr. Opin. Cell Biol. 2002;14:167–172. doi: 10.1016/s0955-0674(02)00313-7. [DOI] [PubMed] [Google Scholar]
- 9.Toutchkine A, Kraynov V, Hahn K. Solvent-sensitive dyes to report protein conformational changes in living cells. J. Am. Chem. Soc. 2003;125:4132–4145. doi: 10.1021/ja0290882. [DOI] [PubMed] [Google Scholar]
- 10.Nalbant P, Hodgson L, Kraynov V, Toutchkine A, Hahn KM. Activation of endogenous Cdc42 visualized in living cells. Science. 2004;305:1615–1619. doi: 10.1126/science.1100367. [DOI] [PubMed] [Google Scholar]
- 11.Gulyani A, Vitriol E, Allen R, Wu J, Gremyachinskiy D, Lewis S, Dewar B, Graves LM, Kay BK, Kuhlman B, Elston T, Hahn KM. A biosensor generated via high-throughput screening quantifies cell edge Src dynamics. Nat. Chem. Biol. 2011;7:437–444. doi: 10.1038/nchembio.585. [DOI] [PMC free article] [PubMed] [Google Scholar]
- 12.Goguen BN, Loving GS, Imperiali B. Development of a fluorogenic sensor for activated Cdc42. Bioorg. Med. Chem. Lett. 2011;21:5058–5061. doi: 10.1016/j.bmcl.2011.04.051. [DOI] [PMC free article] [PubMed] [Google Scholar]
- 13.Loving GS, Sainlos M, Imperiali B. Monitoring protein interactions and dynamics with solvatochromic fluorophores. Trends Biotechnol. 2010;28:73–83. doi: 10.1016/j.tibtech.2009.11.002. [DOI] [PMC free article] [PubMed] [Google Scholar]
- 14.Shirinian VZ, Shimkin AA. Merocyanines: synthesis and application. Top. Heterocycl. Chem. 2008;14:75–105. [Google Scholar]
- 15.Kulinich AV, Ishchenko AA. Merocyanine dyes: synthesis, structure, properties and applications. Russ. Chem. Rev. 2009;78:141–164. [Google Scholar]
- 16.Buncel E, Rajagopal S. Solvatochromism and solvent polarity scales. Acc. Chem. Res. 1990;23:226–231. [Google Scholar]
- 17.Garrett SC, Hodgson L, Rybin A, Toutchkine A, Hahn KM, Lawrence DS, Bresnick AR. A biosensor of S100A4 metastasis factor activation: inhibitor screening and cellular activation dynamics. Biochemistry. 2008;47:986–996. doi: 10.1021/bi7021624. [DOI] [PMC free article] [PubMed] [Google Scholar]
- 18.Hahn K, DeBiasio R, Taylor DL. Patterns of elevated free calcium and calmodulin activation in living cells. Nature. 1992;359:736–738. doi: 10.1038/359736a0. [DOI] [PubMed] [Google Scholar]
- 19.Hahn KM, Waggoner AS, Taylor DL. A calcium-sensitive fluorescent analog of calmodulin based on a novel calmodulin-binding fluorophore. J. Biol. Chem. 1990;265:20335–20345. [PubMed] [Google Scholar]
- 20.Nomanbhoy TK, Leonard DA, Manor D, Cerione RA. Investigation of the GTP-binding/GTPase cycle of Cdc42Hs using extrinsic reporter group fluorescence. Biochemistry. 1996;35:4602–4608. doi: 10.1021/bi951743d. [DOI] [PubMed] [Google Scholar]
- 21.Brooker LGS, Sprague RH. Color and constitution. VI. Pyrrolocyanines. J. Am. Chem. Soc. 1945;67:1869–1874. [Google Scholar]
- 22.Brooker LGS, Sklar AL, Cressman HWJ, Keyes GH, Smith LA, Sprague RH, Van Lare E, Van Zandt G, White FL, Williams WW. Color and constitution. VII. Interpretation of absorptions of dyes containing heterocyclic nuclei of different basicities. J. Am. Chem. Soc. 1945;67:1875–1889. [Google Scholar]
- 23.Brooker LGS, Keyes GH, Sprague RH, VanDyke RH, VanLare E, VanZandt G, White FL, Cressman HWJ, Dent SG., Jr Color and constitution. X. Absorption of the merocyanines. J. Am. Chem. Soc. 1951;73:5332–5350. [Google Scholar]
- 24.Brooker LGS, Keyes GH, Sprague RH, VanDyke RH, VanLare E, VanZandt G, White FL. The cyanine dye series. XI. The merocyanines. J. Am. Chem. Soc. 1951;73:5326–5332. [Google Scholar]
- 25.Marder SR, Torruellas WE, Blanchard-Desce M, Ricci V, Stegeman GI, Gilmour S, Bredas J, Li J, Bublitz GU, Boxer SG. Large molecular third-order optical nonlinearities in polarized carotenoids. Science. 1997;276:1233–1236. doi: 10.1126/science.276.5316.1233. [DOI] [PubMed] [Google Scholar]
- 26.Bublitz GU, Ortiz R, Runser C, Fort A, Barzoukas M, Marder SR, Boxer SG. Stark spectroscopy of donor-acceptor polyenes: correlation with nonlinear optical measurements. J. Am. Chem. Soc. 1997;119:2311–2312. [Google Scholar]
- 27.Bublitz GU, Ortiz R, Marder SR, Boxer SG. Stark spectroscopy of donor/acceptor substituted polyenes. J. Am. Chem. Soc. 1997;119:3365–3376. [Google Scholar]
- 28.Bublitz GU, Boxer SG. Stark spectroscopy: applications in chemistry, biology, and materials science. Annu. Rev. Phys. Chem. 1997;48:213–242. doi: 10.1146/annurev.physchem.48.1.213. [DOI] [PubMed] [Google Scholar]
- 29.Marder SR, Gorman CB, Tiemann BG, Cheng LT. Stronger acceptors can diminish nonlinear optical response in simple donor-acceptor polyenes. J. Am. Chem. Soc. 1993;115:3006–3007. [Google Scholar]
- 30.Tomasulo M, Sortino S, Raymo FM. Bichromophoric photochromes based on the opening and closing of a single oxazine ring. J. Org. Chem. 2008;73:118–126. doi: 10.1021/jo7017119. [DOI] [PubMed] [Google Scholar]
- 31.Hoebeke M, Piette J, Van de Vorst A. Viscosity-dependent isomerization and fluorescence yields of Merocyanine 540. J. Photochem. Photobiol., B. 1990;4:273–282. [Google Scholar]
- 32.Velapoldi RA, Tonnesen HH. Corrected emission spectra and quantum yields for a series of fluorescent compounds in the visible spectra region. J. Fluoresc. 2004;14:465–472. doi: 10.1023/b:jofl.0000031828.96368.c1. [DOI] [PubMed] [Google Scholar]
- 33.Hodgson L, Nalbant P, Shen F, Hahn K. Imaging and photobleach correction of Mero-CBD, sensor of endogenous Cdc42 activation. Methods Enzymol. 2006;406:140–156. doi: 10.1016/S0076-6879(06)06012-5. [DOI] [PubMed] [Google Scholar]
- 34.Hodgson L, Shen F, Hahn K. Biosensors for characterizing the dynamics of rho family GTPases in living cells. Curr. Protoc. Cell Biol. 2010;Chapter 14(Unit 14.11):1–26. doi: 10.1002/0471143030.cb1411s46. [DOI] [PMC free article] [PubMed] [Google Scholar]
- 35.Prajapati D, Bhuyan P, Sandhu JS. Studies of pyrimidine-2,4-diones: synthesis of novel condensed pyrido[2,3-d]pyrimidines via intramolecular cycloadditions. J. Chem. Soc. Perkin Trans. 1988;1:607–610. [Google Scholar]
- 36.Ernst LA, Gupta RK, Mujumdar RB, Waggoner AS. Cyanine dye labeling reagents for sulfhydryl groups. Cytometry. 1989;10:3–10. doi: 10.1002/cyto.990100103. [DOI] [PubMed] [Google Scholar]
- 37.Brooker LGS, White FL, Sprague RH. Color and constitution. IX. Absorption of cyanines derived from 3-methylisoquinoline, a rule relating basicity and absorption in symmetrical cyanines. J. Am. Chem. Soc. 1951;73:1087–1093. [Google Scholar]
- 38.Brooker LGS. Absorption and resonance in dyes. Rev. Mod. Phys. 1942;14:275–293. [Google Scholar]
- 39.Mostovnikov VA, Rubinov AN, Al'perovich MA, Avdeeva VI, Levkoev II, Loiko MM. Effect of the structure of polymethine dyes on the luminescence and generating properties of their solutions. Zh. Prikl. Spektrosk. 1974;20:42–47. [Google Scholar]
- 40.Ishchenko AA. Structure and absorption-luminescence spectral properties of polymethine dyes. Usp. Khim. 1991;60:1708–1743. [Google Scholar]
- 41.Hansen CM. Solubility Parameters - An Introduction. In: Hansen CM, editor. Hansen Solubility Parameters: A User's Handbook, Second Edition. Chapter 1. Boca Raton: CRC Press; 2007. pp. 1–26. [Google Scholar]
- 42.Hansen CM, Skaarup K. Aspects of the three-dimensional solubility parameter. Dan. Kemi. 1967;48:81–84. [Google Scholar]
- 43.Sharafy S, Muszkat KA. Viscosity dependence of fluorescence quantum yields. J. Am. Chem. Soc. 1971;93:4119–4125. [Google Scholar]
- 44.Song L, Hennink EJ, Young IT, Tanke HJ. Photobleaching kinetics of fluorescein in quantitative fluorescence microscopy. Biophys. J. 1995;68:2588–2600. doi: 10.1016/S0006-3495(95)80442-X. [DOI] [PMC free article] [PubMed] [Google Scholar]
- 45.Toutchkine A, Nguyen D, Hahn KM. Simple one-pot preparation of water-soluble, cysteine-reactive cyanine and merocyanine dyes for biological imaging. Bioconjugate Chem. 2007;18:1344–1348. doi: 10.1021/bc060376n. [DOI] [PMC free article] [PubMed] [Google Scholar]
- 46.Rudolph MG, Bayer P, Abo A, Kuhlmann J, Vetter IR, Wittinghofer A. The Cdc42/Rac interactive binding region motif of the Wiskott Aldrich syndrome protein (WASP) is necessary but not sufficient for tight binding to Cdc42 and structure formation. J. Biol. Chem. 1998;273:18067–18076. doi: 10.1074/jbc.273.29.18067. [DOI] [PubMed] [Google Scholar]
- 47.Bright GR, Fisher GW, Rogowska J, Taylor DL. Fluorescence ratio imaging microscopy. Methods Cell Biol. 1989;30:157–192. doi: 10.1016/s0091-679x(08)60979-6. [DOI] [PubMed] [Google Scholar]
- 48.Mujumdar RB, Ernst LA, Mujumdar SR, Lewis CJ, Waggoner AS. Cyanine dye labeling reagents: Sulfoindocyanine succinimidyl esters. Bioconjugate Chem. 1993;4:105–111. doi: 10.1021/bc00020a001. [DOI] [PubMed] [Google Scholar]
- 49.Leytus SP, Melhado LL, Mangel WF. Rhodamine-based compounds as fluorogenic substrates for serine proteinases. Biochem. J. 1983;209:299–307. doi: 10.1042/bj2090299. [DOI] [PMC free article] [PubMed] [Google Scholar]
- 50.Patterson GH, Knobel SM, Sharif WD, Kain SR, Piston DW. Use of the green fluorescent protein and its mutants in quantitative fluorescence microscopy. Biophys. J. 1997;73:2782–2790. doi: 10.1016/S0006-3495(97)78307-3. [DOI] [PMC free article] [PubMed] [Google Scholar]
- 51.Han W, Liu T, Himo F, Toutchkine A, Bashford D, Hahn KM, Noodleman L. A theoretical study of the UV/visible absorption and emission solvatochromic properties of solvent-sensitive dyes. ChemPhysChem. 2003;4:1084–1094. doi: 10.1002/cphc.200300801. [DOI] [PubMed] [Google Scholar]
- 52.Liu T, Han W, Himo F, Ullmann GM, Bashford D, Toutchkine A, Hahn KM, Noodleman L. Density functional vertical self-consistent reaction field theory for solvatochromism studies of solvent-sensitive dyes. J. Phys. Chem. A. 2004;108:3545–3555. [Google Scholar]
- 53.Toutchkine A, Han W, Ullmann M, Liu T, Bashford D, Noodleman L, Hahn KM. Experimental and DFT studies: Novel structural modifications greatly enhance the solvent sensitivity of live cell imaging dyes. J. Phys. Chem. A. 2007;111:10849–10860. doi: 10.1021/jp073197r. [DOI] [PMC free article] [PubMed] [Google Scholar]
- 54.Lavis LD, Raines RT. Bright ideas for chemical biology. ACS Chem. Biol. 2008;3:142–155. doi: 10.1021/cb700248m. [DOI] [PMC free article] [PubMed] [Google Scholar]
- 55.Griebel R. The influence of viscosity on fluorescence-quantum yields of a polymethine dye diquinolinylcyanomethane. Ber. Bunsenges. Phys. Chem. 1980;84:84–91. [Google Scholar]
- 56.Oster G, Nishijima Y. Fluorescence and internal rotation: their dependence on viscosity of the medium. J. Am. Chem. Soc. 1956;78:1581–1584. [Google Scholar]
- 57.Toutchkine A, Nguyen D, Hahn KM. Merocyanine dyes with improved photostability. Org. Lett. 2007;9:2775–2777. doi: 10.1021/ol070780h. [DOI] [PubMed] [Google Scholar]
Associated Data
This section collects any data citations, data availability statements, or supplementary materials included in this article.


