Abstract
Mass cytometry is a recently introduced technology that utilizes transition element isotope-tagged antibodies for protein detection on a single-cell basis. By circumventing the limitations of emission spectral overlap associated with fluorochromes utilized in traditional flow cytometry, mass cytometry currently allows measurement of up to 40 parameters per cell. Recently a comprehensive mass cytometry analysis was described for the hematopoietic differentiation program in human bone marrow from a healthy donor. The present study describes approaches to delineate cell cycle stages utilizing iododeoxyuridine (IdU) to mark cells in S phase, simultaneously with antibodies against cyclin B1, cyclin A, and phosphorylated histone H3 (S28) that characterize the other cell cycle phases. Protocols were developed in which an antibody against phosphorylated retinoblastoma protein (Rb) at serines 807 and 811 was used to separate cells in G0 and G1 phases of the cell cycle. This mass cytometry method yielded cell cycle distributions of both normal and cancer cell populations that were equivalent to those obtained by traditional fluorescence cytometry techniques. We applied this to map the cell cycle phases of cells spanning the hematopoietic hierarchy in healthy human bone marrow as a prelude to later studies with cancers and other disorders of this lineage.
Keywords: Mass Cytometry, Cell Cycle, Flow Cytometry, Retinoblastoma, iododeoxyuridine, hematopoiesis
Introduction
Understanding the complexity of the physiology and biology of healthy and diseased tissues requires a detailed phenotypic and functional characterization of individual cells. Recent advances in flow cytometry that replace fluorescence detection with detection by mass spectrometry have made possible a dramatic increase in the number of parameters (currently up to 40) that can be measured simultaneously at the single cell level. Mass cytometry technology is enabled using antibodies conjugated to chelated metal ion tags instead traditional fluorochromes. The approach takes advantage of the quantitative nature of inductively coupled plasma time of flight spectrometry in which the ion clouds are quantitated in a time of flight mass spectrometer and correlated with concentrations of the metal-tagged antibody (1-3).
Single cell mass cytometry was recently applied to study signaling states in immune cell subsets within primary human bone marrow samples (4). This study measured simultaneously 34 signals from antibodies to both surface markers (to identify cell subsets) and intracellular signaling proteins (to determine activation state). Exposure of the sample to extracellular modulators such as growth factors, cytokines and therapeutic agents allowed analysis of changes in signaling pathway responses within different immune cell subsets. As with high parameter traditional flow cytometry with fluorophores, data visualization at 34-parameter dimensionality was a challenge, necessitating the development of bioinformatics tools that enabled efficient data interpretation. Thus, a spanning–tree progression analysis of density normalized events (SPADE) algorithm was created and then applied to cluster cell subsets based on their phenotypic similarity to one another with signaling responses superimposed on each cell cluster (4, 5). A detailed single-cell analysis of healthy bone marrow of this nature established a reference against which diseases of immune dysfunction and cancer could be compared and a process through which drug candidates might be evaluated.
Lacking from our original evaluations of healthy bone marrow samples were measurements of cell cycle phase, since the DNA intercalator used did not provide sufficient resolution to separate cells of 2n and 4n DNA content. Previous studies have demonstrated the utility of measures of cell proliferation and identification of cells expressing stem cell markers as prognostic indicators in a variety of hematologic malignancies (6-8). The capacity of malignant stem cells to proliferate after xenotransplantation has also been shown to predict outcome in acute leukemia (9). However, combining cell cycle measurements with extensive immunophenotypic characterization of stem cells has, until now, not been technically feasible, mainly due to the restrictions on number of parameters that can be measured using fluorescence-based flow cytometry.
In the work reported here, the assay developed by Bendall et al. was expanded to include measurements of cell cycle phases in immune cell subsets in healthy human bone marrow. In addition to metal ion-chelated antibodies against proteins designating G0, G1, G2 and M cell cycle phases, cells in S phase were identified using 5-iodo-2-deoxyuridine (IdU); the atomic mass of iodine is 127, which is compatible with the mass range measured by the spectrometer. Thus, IdU incorporation can be measured directly in S phase cells bypassing the need for an antibody or DNA denaturation. The use of an antibody against retinoblastoma protein phosphorylated at serines 807 and 811 was also validated as a method to measure the proportion of cells in G0 phase by both fluorescence and mass-based cytometry. These adapted techniques were combined with well established antibodies against cyclin B1, cyclin A, and phosphorylated histone H3 (p-HH3) to delineate all cell cycle phases. With this mass cytometry approach, comprehensive cell cycle assessment can be performed in conjunction with analysis of up to 35 other immunophenotypic or functional parameters, creating a new paradigm for the study of the cell cycle.
Materials and Methods
Data files
Original data files from all experiments described in this report are publically available at www.cytobank.org/nolanlab.
Antibodies
Antibody clone names, manufacturer, and concentrations used for labeling cells are listed in Table 1. For mass cytometry studies, primary antibody transition metal-conjugates were prepared in 100μg lots with the MaxPAR antibody conjugation kit (DVS Sciences, Toronto, Canada) using the manufacturers recommended protocol. Following conjugation, antibodies were diluted to 100x working concentration in Candor PBS Antibody Stabilization solution (Candor Bioscience GmbH, Wangen, Germany) and stored at 4°C.
Table 1.
Antibodies used in this study.
| Antigen | Conjugate | Clone | Concentration | Manufacturer |
|---|---|---|---|---|
| Mass cytometry | ||||
| CD3 | In-113 | UCHT1 | 1.5 ug/mL | Biolegend |
| CD45 | In-115 | Hl30 | 1.5 ug/mL | Biolegend |
| CD45RA | La-139 | Hl100 | 1 ug/mL | Biolegend |
| CD133 | Pr-141 | AC133 | 2 ug/mL | Militeney |
| CD19 | Nd-142 | H1B19 | 1 ug/mL | BD Biosciences |
| CD71 | Nd-143 | R17217 | 2 ug/mL | eBiosciences |
| CD11b | Nd-144 | ICRF44 | 2 ug/mL | Biolegend |
| CD4 | Nd-145 | RPA-T4 | 2 ug/mL | Biolegend |
| CD8 | Nd-146 | RPA-T8 | 1 ug/mL | Biolegend |
| CD20 | Sm-147 | 2H7 | 1 ug/mL | BD Biosciences |
| CD34 | Nd-148 | 8G12 | 2 ug/mL | BD Biosciences |
| CD90 | Sm-149 | 5E10 | 2 ug/mL | Biolegend |
| CD117 | Nd-150 | 104D2 | 0.5 ug/mL | Biolegend |
| CD123 | Eu-151 | 9f5 | 2 ug/mL | BD Biosciences |
| CD235 | Sm-152 | HIR2 | 0.5 ug/mL | Biolegend |
| HLA-DR | Eu-153 | L243 | 2 ug/mL | Biolegend |
| Cyclin A | Sm-154 | BF683 | 2 ug/mL | BD Biosciences |
| Cyclin B1 | Gd-156 Dy-164 |
GNS-1 | 2 ug/mL | BD Biosciences |
| CD33 | Gd-158 | WM53 | 1.5 ug/mL | Biolegend |
| CD38 | Tb-159 | HIT2 | 1 ug/mL | Biolegend |
| CD14 | Gd-160 | M5E2 | 2 ug/mL | Biolegend |
| CD7 | Dy-162 | M-T701 | 0.5 ug/mL | BD Biosciences |
| CD15 | Dy-164 | W6D3 | 0.5 ug/mL | Biolegend |
| p-pRb (S807/811) | Ho-165 | J112-906 | 0.5 ug/mL | BD Biosciences |
| Ki-67 | Er-167 | B56 | 1 ug/mL | BD Biosciences |
| CD13 | Er-168 | L138 | 2 ug/mL | BD Biosciences |
| p-CDK1(Y15) | Tm-169 | 10A11 | 2 ug/mL | Cell Signaling Technology |
| CD56 | Er-170 | HCD56 | 2 ug/mL | Biolegend |
| cleaved-PARP(D214) | Yb-171 | F21-852 | 1 ug/mL | BD Biosciences |
| p-RPS6(S235/36) | Yb-172 | N7-548 | 1 ug/mL | BD Biosciences |
| CD10 | Yb-174 | Hl10a | 4 ug/mL | Biolegend |
| CD16 | Lu-175 | 3G8 | 2 ug/mL | Biolegend |
| p-Histone H3(S28) | Yb-176 Er-168 |
HTA28 | 0.5 ug/mL | Biolegend |
| Fluorescent cytometry | ||||
| CD3 | PE-Cy7 | SK7 | BD Biosciences | |
| p-pRb(S807/811) | Alexa 647 | J112-906 | BD Biosciences | |
| BrdU | None | B-44 | BD Biosciences | |
| Cyclin B1 | FITC | GNS-1 | BD Biosciences | |
| pHH3(S28) | Pacific Orange | HTA28 | Biolegend | |
| Mouse IgG | FITC, PE-Cy7 | eBiosciences |
Cell culture
HL-60 cells (ATCC, Manassas, VA, USA) were cultured in Iscove's modified eagle media supplemented with 20% fetal bovine serum (FBS) and penicillin and streptomycin. U937, NALM-6 and A20 cells (ATCC) were cultured in RPMI media supplemented with 10% FBS and penicillin and streptomycin. All cell culture was performed at 37°C in a humidified cell culture incubator at 5% CO2.
Peripheral blood and bone marrow samples
Human peripheral blood was purchased from the Stanford Blood Bank and was collected according to a Stanford University IRB-approved protocol. Blood was Ficoll-purified and peripheral blood mononuclear cells (PBMCs) were cryopreserved in liquid nitrogen until required for use. Human bone marrow aspirates were purchased from Allcells (Emeryville, CA, USA) and used in accordance with an IRB-approved protocol.
Preparation of T cells from mouse and human
For human T cell analysis, PBMCs were thawed rapidly, washed with RPMI media and then rested for 1 hour at 37°C in RPMI media supplemented with 10% fetal bovine serum (FBS) and penicillin and streptomycin. Subsequently, PBMCs were treated with 10 ng/mL phorbol 12-myristate 13-acetate (PMA; Sigma-Aldrich, St. Louis, MO, USA) and 0.4 μg/mL ionomycin (Sigma-Aldrich) over a time period of 48 hours. For murine T cell analysis, freshly isolated splenocytes from a wild-type C57/BL6 mouse were incubated in RPMI complete media with anti-CD3 antibody (Biolegend; San Diego, CA, USA) at 1 μg/mL over a time period of 48 hours. All mouse experiments were performed in accordance with an animal use protocol approved by the Stanford University Administrative Panel on Laboratory Animal Care.
Treatment of cells with IdU and processing for cytometry
For both the murine and human cell systems, cell aliquots of approximately 10 million cells were removed at specified times over 48 hours, and incubated with 10 μM (final concentration) IdU (Sigma-Aldrich) for 15 minutes at 37°C. Cells were then fixed for 10 minutes with paraformaldehyde (Electron Microscopy Sciences, Hatfield, PA, USA) at a final concentration of 1.5%, permeabilzed with methanol at 4°C and processed for mass or fluorescence cytometry as previously described (4). Cells were stored at -80°C for up to 2 months until analysis by mass cytometry or fluorescent flow cytometry.
Human bone marrow analysis
Fresh bone marrow aspirates were collected into a heparinized tubes containing 10 μM IdU. Cells were incubated for approximately 1 hour at 37°C after which cells were pipetted several times to free cells from bone particles (spicules) and then filtered through a 100 μm filter to remove spicules. The cells were then immediately fixed using a fixation/stabilization buffer (SmartTube, Palo Alto, CA, USA) for 10 minutes at room temperature and then frozen at -80°C for up to 3 months prior to analysis by mass cytometry. Prior to analysis, cells were thawed in a 4°C water bath and then red cells were lysed using a hypotonic lysis buffer (SmartTube) following the manufacturer's recommended protocol. Cells were then washed twice in cell staining medium (CSM). Bone marrow cells were incubated with surface marker antibodies (Table 1) in 100 μL CSM for 1 hour with continuous mixing. Cells were then washed twice in CSM and fixed a second time with PFA (1.5% final) for 10 minutes. Cells were then pelleted by centrifugation and resuspended with vortexing in ice-cold methanol. After overnight storage at -80°C cells were washed twice in CSM prior to incubation with antibodies against intracellular signaling proteins as previously described (4).
Fluorescent flow cytometry
Fluorescence cytometry analysis was performed on a BD LSRII cytometer (BD Biosciences, San Jose, CA, USA) equipped with 405nm, 488nm, and 633nm lasers. For T cell analysis, paraformaldehyde and methanol-fixed T cells were washed two times with CSM and then incubated with RNase-free, DNase I (Roche Bioscience, Palo Alto, CA, USA) for 45 minutes at 37° C in 250 μL of the manufacturer's supplied buffer. Cells were then washed 3 times with CSM-T (PBS, 0.5% BSA, 0.02% sodium azide, 0.5% Tween-20). Cells were then stained with anti-BrdU antibody in 100 μL CSM for 30 minutes at room temperature, washed in CSM and then stained with FITC anti-mouse secondary antibody at 1:3000 in 100 μL CSM for 30 minutes at room temperature. Cells were washed in CSM then blocked with 10 μg/mL normal mouse immunoglobulin for 10 minutes. Staining with all other antibodies was then performed in 100 μL CSM with 10μg/mL normal mouse immunoglobulin for 30 minutes at room temperature. Hoechst 3342 (2.5 μg/mL; Invitrogen, Carlsbad, CA, USA) and pyronin Y (6 μg/mL; Polysciences, Warrington, PA, USA) were added during this final antibody staining step. Cells were then washed two times with CSM before analysis. Compensation was performed using protein A/G compensation bead standards for each fluorochrome and cells stained with either Hoechst 3342 or pyronin Y alone. A compensation matrix was made using FlowJo (v8.8.6). Live single cells were gated based on FSC-A vs. SSC-A, FSC-A vs. FSC-W. For comparisons between mass cytometry and fluorescent cytometry, cell events completely negative for p-Rb(S807/811) were gated out of both analyses, however, this did not exclude a significant number of cells from the fluorescent analysis after gating on FSC-A vs. SSC-A.
Mass cytometry
Mass cytometry staining and measurement was performed as previously described (4). Briefly, antibody staining was performed in 100 μL of cell staining media (CSM; 1xPBS with 0.5% bovine serum albumin and 0.02% sodium azide) for 60 minutes at room temperature with continuous shaking. Cells were washed twice with CSM and then incubated for 20 minutes in PBS with 1:5000 the iridium intercalator pentamethylcyclopentadienyl-Ir(III)-dipyridophenazine (DVS Sciences, Toronto, Canada) and 1.6% paraformaldehyde (to fix antibodies to cellular antigens). Excess intercalator was then removed with two CSM washes and a single wash in PBS. Cells were then resuspended in distilled-deionized water at approximately 1 million cells per mL. Cell events were acquired on the CyTOF™ mass cytometer (DVS Sciences) at an event rate of 200-400 events per second with internally calibrated dual count detection (1, 2). Noise reduction and cell extraction parameters were as follows: cell length 10-75, lower convolution threshold 10. A cell subtraction value was set to -100. After acquisition, the effect of the cell subtraction setting was negated by subtracting a value of 100 from every channel of each FCS file using the FlowCore package for R (10). The above manipulations allow for the estimation of mass signals below background and a more accurate representation of experimental noise. Antibodies against either cleaved caspase3 or cleaved PARP (or both) were incorporated in all mass cytometry experiments (except for Figure 1A) to allow for dead or dying cells to be gated out. For comparisons between mass cytometry and fluorescent cytometry, cell events completely negative for p-Rb(S807/811) were gated out of both analyses.
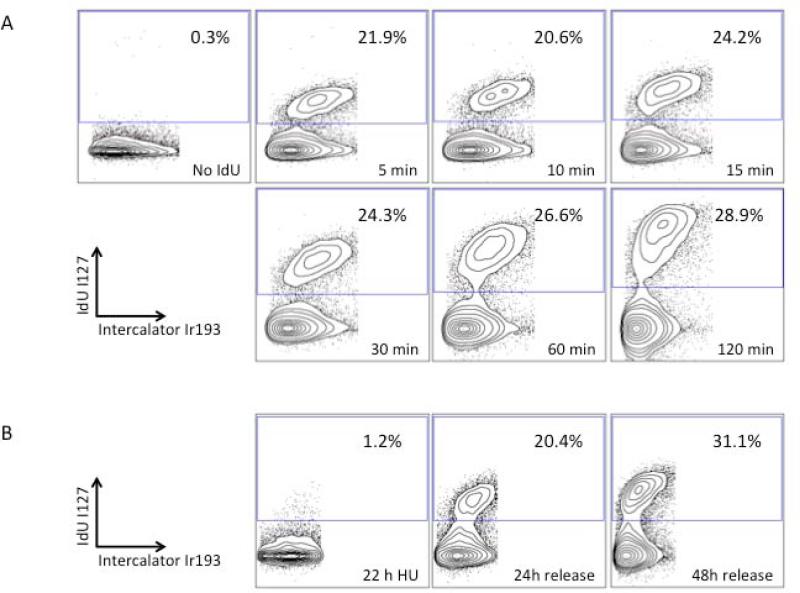
Figure 1.
Mass cytometric measurement of IdU incorporation specifically identifies S phase cells. (A) U937 cells were incubated with 10 μM IdU for the indicated times, fixed, and analyzed by mass cytometry; S-phase gate is indicated. Cells not incubated with IdU have no significant iodine signal. (B) Treatment with 1.5 μM hydroxyurea for 22 hours blocked IdU incorporation; IdU incorporation was restored 24 hours after release from the hydroxyurea block.
Data analysis
Data analysis and SPADE clustering was performed as previously described (4). All data plots were created in Cytobank (11) (www.cytobank.org). All mass cytometry data are displayed with an arcsinh transformation and a scale argument of 5. All fluorescent cytometry data is displayed with an arcsinh transformation and a scale argument of 150. SPADE analysis has previously been described in detail (5). To perform analysis on this dataset, mass cytometry data was first singlet gated in Cytobank using a cell length by DNA (Ir intercalator) gate (Supplemental Figure 2). SPADE analysis was performed with the default configuration (arcsinh cofactor = 5, normalize = “global”, down-sampling events = 3000, downsampling exclusion percentile = 0.01, target number of clusters = 250, maximum number of clustered events = 50000). Clustering was performed on the following markers: CD10, CD117, CD11b, CD123, CD13, CD133, CD14, CD15, CD16, CD19, CD20, CD235, CD3, CD33, CD34, CD38, CD4, CD45, CD45RA, CD56, CD7, CD71, CD8, CD90, and HLA-DR. Cell immunophenotype identification was performed manually based on the median expression of all markers in the individual clusters of the SPADE tree. Assignments were based on previous studies from our laboratory (4) and others (12).
Results
IdU incorporation identifies S phase cells
A method for cellular DNA content measurement by mass cytometry utilizing an iridium-based intercalator has been previously described (13). Although valuable for marking nucleated cells, the iridium intercalator lacks sufficient resolution to allow assignment of cells to different phases of the cell cycle (Supplemental Figure 1). As an alternative approach, the halogenated uridine analog IdU, commonly used to measure cells in S phase, was tested by capitalizing on the ability of the mass cytometer to detect the 127 Dalton mass of iodine. Asynchronously growing U937 cells were incubated with IdU at in a time series up to 2 hours and then fixed, permeabilized, and incubated with the iridium intercalator to identify cell events as previously described (13). Singlet gating was performed as previously described (4), and as shown in Supplemental Figure 2.
Incorporation of IdU into cells was rapid with 22% of cells stained as early as 5 minutes post-incubation. Increased labeling time lead to a significant increase in IdU incorporation into S phase cells (mean intensity of 43.5 at 5 minutes, 83.1 at 15 minutes, 240.5 at 1 hour, and 667.6 at 2 hours) with little change in the percentage of positive cells (24% by 15 minutes, 26% by 1 hour, and 28% by 2 hours). The small increase in the percentage of S phase cells from 5 minutes to 2 hours was consistent with the 3-4% per hour that would be expected for this cell line that has a doubling time of 24-30 hours. These data indicate that short incubation times (10-15 minutes) are adequate to measure the S phase within a cell population. The cells incorporating IdU were characterized by the variable, intermediate to high, staining with the iridium DNA intercalator (Figure 1A). In order to confirm that IdU incorporation was specific to S phase cells, U937 cells were treated with hydroxyurea (HU) for 22 hours to inhibit DNA synthesis and impose a G1-S phase block. As can be seen in Figure 1(B) no significant IdU incorporation was seen after HU treatment. However, upon removal of HU, IdU incorporation was observed in 20% of cells at 24 hours and 31% of cells by 48 hours. Thus direct detection of IdU by mass cytometry allows quantitation of cells in S-phase. This obviates protocols dependent upon antibody staining or DNA denaturation--as in traditional methods for detection of halogenated pyrimidine molecules (14).
Simultaneous measurements of IdU with additional cell cycle markers allows assignment of individual cells to cell cycle phases
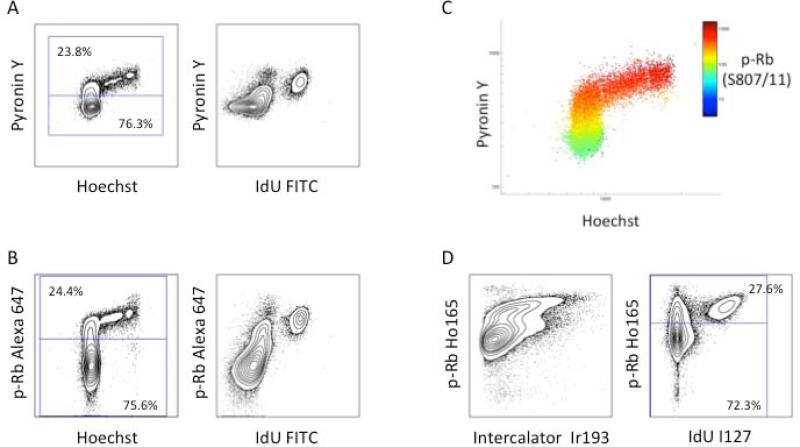
Having established a reliable methodology for S phase identification, additional markers were required for demarcating cells in G0, G1, G2, and M phases. Although several choices existed for antibodies that could be used to distinguish G1, G2, and M phases, it was necessary to identify and characterize an antibody capable of identifying cells in G0. Based on the reported increase in retinoblastoma protein (Rb) phosphorylation at serines 807 and 811 during the G0-G1 transition (15), a phospho-specific antibody against this epitope was tested for its ability to distinguish G0 cells from actively cycling cells (G1 through M phase). Human peripheral blood T cells were stimulated with PMA and ionomycin for 48 hours to induce proliferation. These cells were then treated with 10 μM IdU for 15 minutes, fixed and split into two aliquots for analysis by fluorescence and mass cytometry. Traditional fluorescence cytometry using Hoechst, to stain DNA, and pyronin Y, which preferentially binds RNA, separated pyroninlow quiescent cells in G0 from other cell cycle phases as shown by of pyronin Y vs. Hoechst (Figure 2A, left) and pyronin Y vs. IdU incorporation (Figure 2A, right). Simultaneous incubation with an antibody against p-Rb(S807/811) demonstrated an equivalent staining pattern as pyronin Y when compared to Hoechst or IdU staining as shown in Figure 2B. The 3D flow plot shown in Figure 2C provided further evidence that the staining patterns for p-Rb(S807/811) and pyronin Y were highly correlated (r = 0.93). G0 cells were defined as IdU-positive cells with p-Rb(S807/811) expression of less than 95-99%. Figure 2B demonstrates this gating strategy performed using fluorescent cytometry, and Figure 2D shows analysis of the same samples by mass cytometry.
Figure 2.
Measurement of phosphorylated Rb on serines 807 and 811 discriminates of G0 from G1 cells by both fluorescent cytometry and mass cytometry. (A) Identification of G0 and G1 cells in stimulated T cells using Hoechst 3342 and pyronin Y staining (left) and pyronin Y staining vs. antibody detection of IdU incorporation (right). (B) The p-Rb(S807/811) staining pattern is similar to that of pyronin Y and defines similar G0 and G1 populations. (C) A plot of Hoechst 3342 vs. pyronin Y colored for staining by p-Rb(S807/811), Alexa 647. (D) Analysis of the same cell sample by mass cytometry using p-Rb(S807/811) labeled on Ho165 vs. iridium intercalator (left) or IdU incorporation (right).
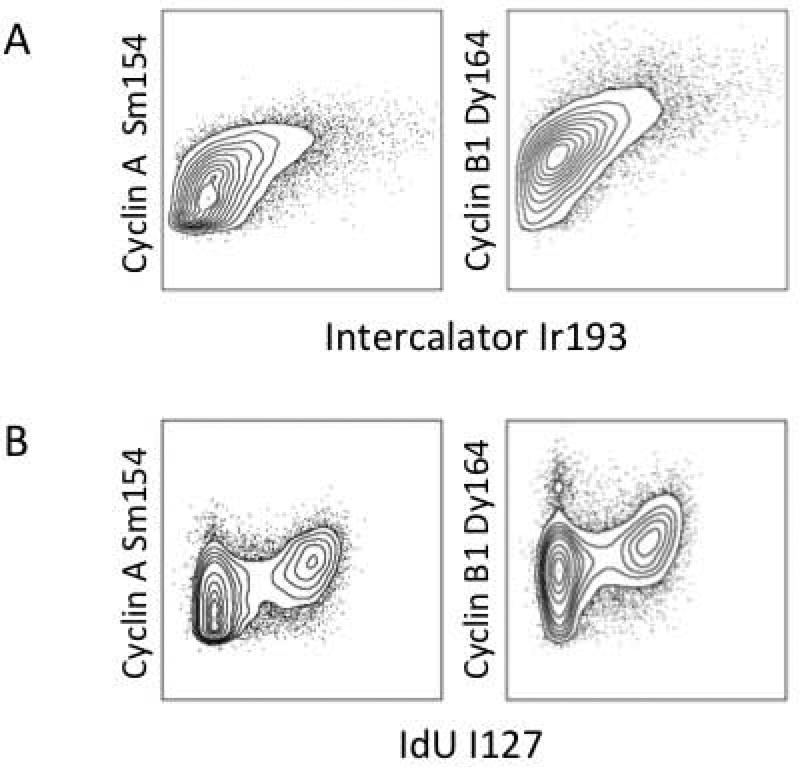
Previous studies have demonstrated the utility of the cyclins and phosphorylated histone 3 to define cells in G1, G2, and M phases of the cell cycle (16-18). To test these markers for use in mass cytometry, asynchronously growing HL60 cells were incubated with IdU and stained simultaneously with metal ion-chelated antibodies against the following cell cycle proteins: cyclin E (G1/S), cyclin A (S/G2), cyclin B1 (G2/M), and Ki-67 (G1-G2-S-M) (16, 18). The data depicted in the 2D flow plots in Figure 3 compared the expression of these markers with total DNA staining by the iridium intercalator (Figure 3A) and IdU incorporation (Figure 3B). These experiments demonstrated that cyclin B1 provided the greatest discrimination of G1 and G2 cell cycle phases (Figure 3B), and this marker was used to assign these phases of the cell cycle.
Figure 3.
Total cyclin levels can be detected by mass cytometry and used to sub-divide the cell cycle. cyclin A, and cyclin B1 were measured relative to Iridium intercalator (A) or IdU incorporation (B).
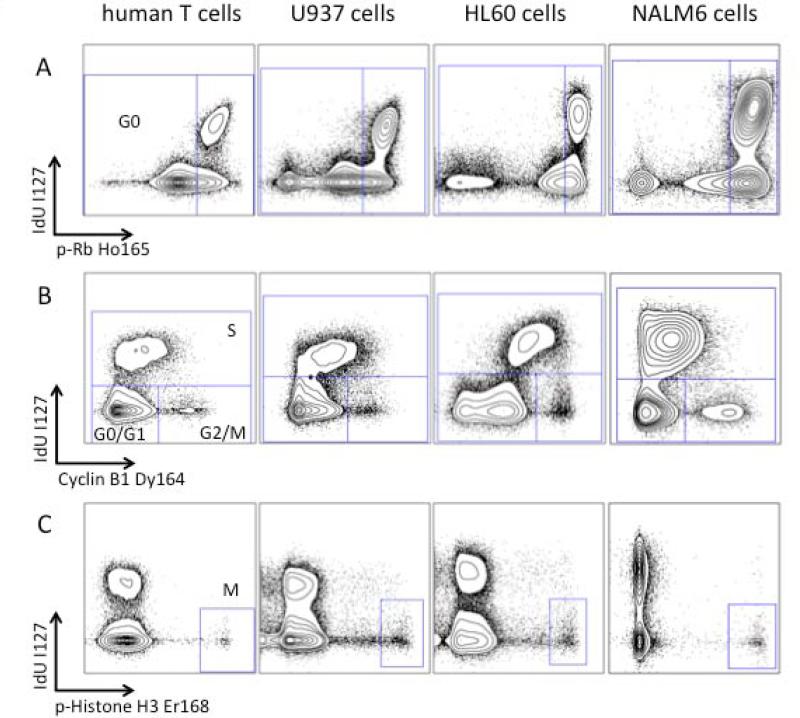
The gating strategy developed above was applied to cycling human proliferating T cells and the leukemia cell lines HL-60, U-937 and NALM-6. Figure 4A demonstrates gating of G0 cells based on the biaxial plot of p-Rb(S807/811) versus IdU incorporation for these cell systems. To distinguish G1 and G2 cell populations, staining for total cyclin B1 was measured relative to IdU incorporation. As cyclin B1 expression peaks in late G2, a biaxial plot of total cyclin B versus to IdU incorporation was used to define an IdUlow/cyclin B1low population comprising G0 and G1 cells, and an IdUlow/cyclin B1high population containing G2 and M-phase cells. Importantly, the data in Figure 4(B) show a consistent ability of the combination of IdU and cyclin B to demarcate cells in S phase versus G1 and G2 phases in all the cell types used in this analysis.
Figure 4.
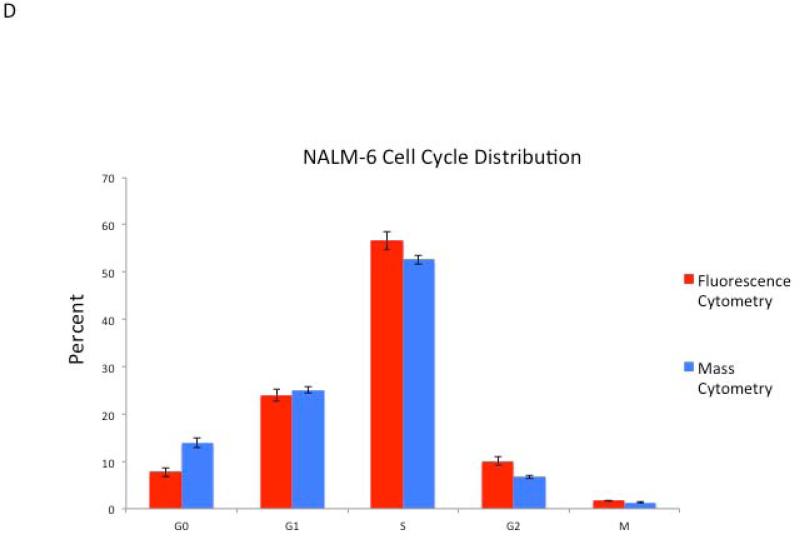
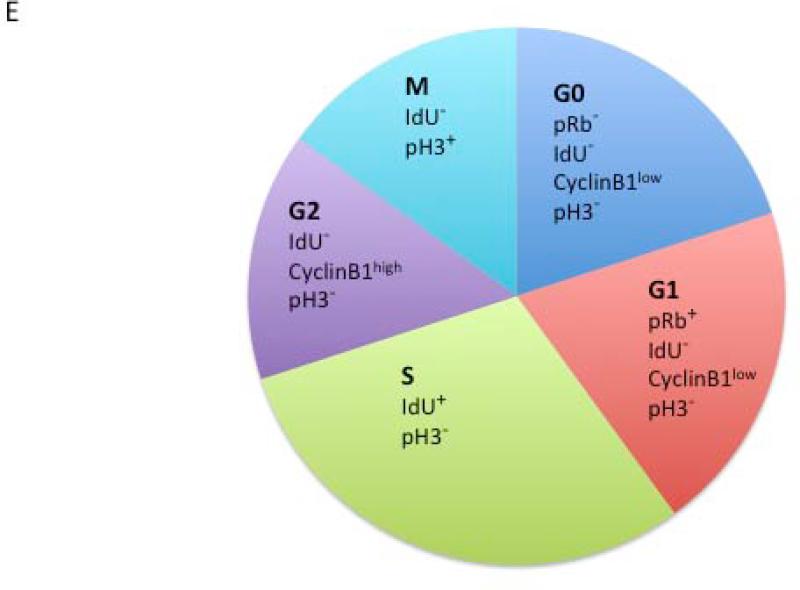
Cell cycle analysis by mass cytometry yields results equivalent to fluorescence cytometry methods. (A) A plot of IdU vs. p-Rb(S807/811) allows for gating of G0 and G1 phase populations. (B) A plot of IdU incorporation vs. cyclin B1 allows gating of G1, S, and G2/M populations as shown. (C) p-HH3(S28) defines an M-phase population. (D) Percentage of NALM-6 cells in each cell cycle phase as measured by mass and fluorescence (Hoechst-pyronin Y) cytometry. Six separate aliquots were taken from a single culture and individually treated with IdU and prepared for mass or fluorescence cytometry analysis. Standard deviation is shown by error bars. (E) Diagram of cell cycle gating strategy for each phase of the cell cycle. Cell events must fall within each of the indicated gates to be assigned to a given cell cycle state.
To identify cells in M-phase of the cell cycle, a phospho-specific antibody against serine 28 of histone H3 (p-HH3 (S28)), recently shown to be highly specific for cells in all stages of M-phase, was used (19, 20). Mass cytometric staining for p-HH3(S28) was robust, and readily identified cycling human T cells in M-phase, as well as M-phase cell populations from both cultured cell lines (Figure 4C).
A quantitative comparison of the NALM6 cell cycle distribution measured by mass cytometry and traditional fluorescence cytometry analysis (using Hoechst, IdU, and pyronin Y) was performed, and representative results from six replicate experiments are shown in Figure 4. Simultaneous fluorescence cytometry analysis of these cells utilizing the markers employed for mass cytometry (IdU, cyclin B1, and p-Rb) is also shown in Supplemental Figure 4. Similar results were obtained utilizing this mass cytometry cell cycle panel in proliferating murine splenic T cells (stimulated with anti-CD3) and in the murine B cell lymphoma cell line A20 (Supplemental Figure 3). Thus, mass cytometry enabled simultaneous measurements of representative markers for all cell cycle phases. Furthermore, the data are consistent with data obtained using fluorescence cytometry across a variety of cell types.
A consistent finding of the above experiments is that all of the studied cell lines appear to have three pRb(S807/811) populations, a pRb(S807/811)+ cycling population, a pRb(S807/811)mid G0 population, and a pRb(S807/811)- population. To further explore this unexpected finding, several additional cell cycle associated proteins were assessed across these three pRb(S807/811) populations in NALM6 cells. As shown in Supplemental Figure 5, the pRb(S807/811)- population appears to be composed primarily of dead cells and large debris, as the cell events in this population lack expression of any the measured proteins except for cleaved caspase 3 and cleaved PARP. This finding was also consistent in other experiments (data not shown). As a result, this pRb(S807/811)- population (which falls outside of the FSC v SSC cell gate in fluorescent analyses) was excluded from quantitative comparisons of mass cytometry and fluorescent cytometry. By contrast, the Rb(S807/811)mid population appears to be composed of live cells (lacking markers of apoptosis) but positive for basal levels of p-AMPK(T172). This population appears to best correlate with G0 cells, as these cells lack significant cyclin A, cyclin B1, p-HH3(S28), or IdU incorporation. This pRB(S807/811)mid population also has lower levels of Ki67 than the pRB(S807/811)+ cell population. Fluorescent cytometry analysis of the pRB(S807/811)mid population confirms the low level of cyclinB1 expression and demonstrates that this population also has low levels of pyronin Y staining (Supplemental Figure 4).
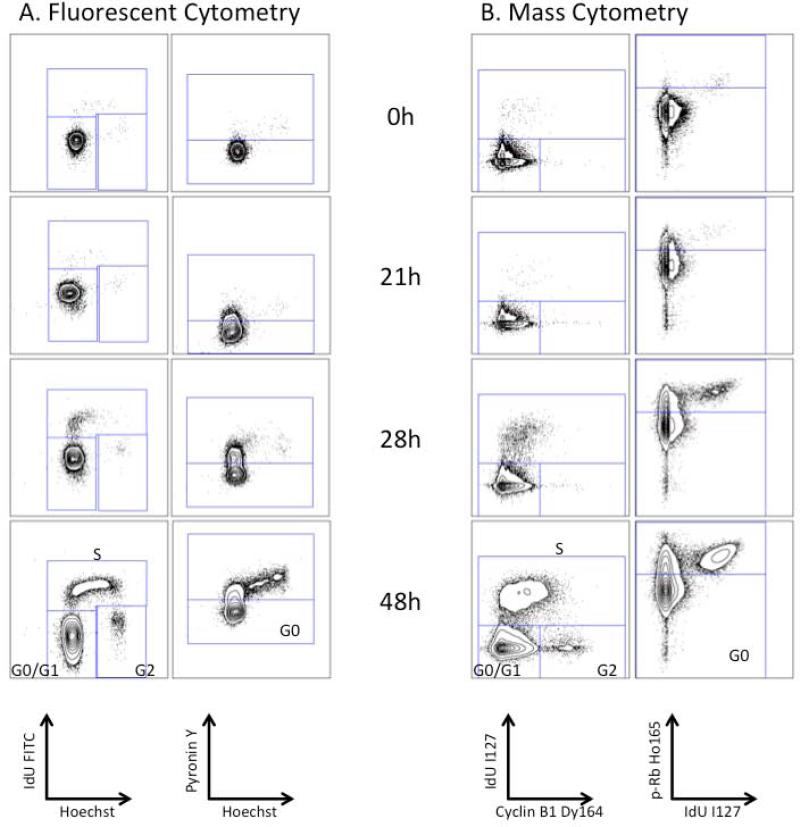
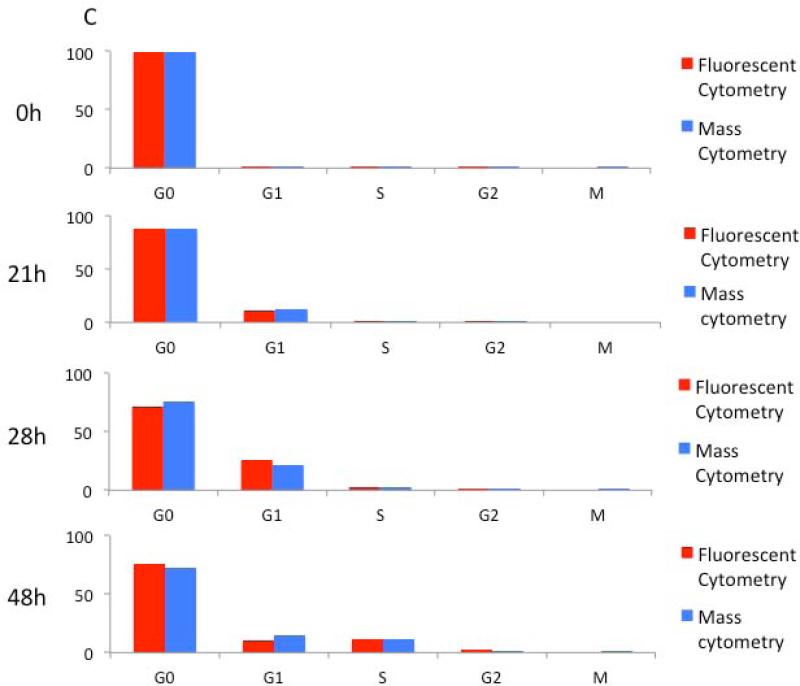
In order to further validate this approach, cell cycle analysis of stimulated human T cells was performed by both fluorescence and mass cytometry across a time course. Proliferating T cells were generated by culturing human PBMCs in the presence of PMA and ionomycin. The cell cycle phase distribution of the CD3 positive T cells was measured by fluorescence and mass cytometry at several times over the course of 48 hours of continuous exposure. Fluorescence cytometry analysis was performed using Hoechst 3342 and pyronin Y staining, and staining with antibodies against IdU, p-Rb(S807/811), and CD3. Mass cytometry analysis was performed using direct measurement of iodine incorporation and metal conjugated antibodies against p-Rb(S807/S811), cyclin B1, p-HH3(S28), and CD3 (14, 21). As shown in Figure 5, before addition of PMA/ionomycin both methodologies classified nearly all T cells in G0 phase of the cell cycle (Hoechst/pyronin Y for fluorescence and IdU/p-Rb(S807/811) for mass cytometry). Cells began to enter G1 after 21 hours of PMA/ionomycin treatment, as detected by increases in both pyronin Y (Figure 5A) and p-Rb(S807/811) (Figure 5B). By 28 hours, IdU content increased as detected by both antibody-mediated fluorescence cytometry and direct mass cytometric iodine detection. A complete cell cycle distribution was seen at 48 hours with both platforms. Overall, the data were consistent between the two platforms with comparable frequencies of cells distributed throughout different phases of the cell cycle at each time point (Figure 5C).
Figure 5.
Validation of mass cytometric cell cycle measurement during stimulation of human peripheral blood T cells by PMA and ionomycin. (A) Fluorescent cytometry cell cycle assessment. Left, measurement of cells in G0/G1, S, and G2/M using Hoechst and anti-IdU antibody (detected by FITC secondary antibody) at indicated timepoints following PMA and ionomycin stimulation. Right, discrimination of G0 and G1 cells using Hoechst and pyronin Y. (B) Mass cytometry cell cycle assessment. Left, measurement of cells in G0/G1, S, and G2/M using cyclin B and direct IdU measurement at indicated timepoints following stimulation. Right, discrimination of G0 and G1 cells using p-Rb(S807/811) and IdU detection. (C) Comparison of the fraction of cells measured in each phase of the cell cycle by fluorescent cytometry and mass cytometry. All cell events have been gated on viable T cells (FSC vs. SSC, DNA≥2n, CD3+ for fluorescent analysis; DNA vs. cell length, cleaved PARP-, CD3+ for mass cytometry).
System-wide analysis of cell cycle state in healthy human bone marrow
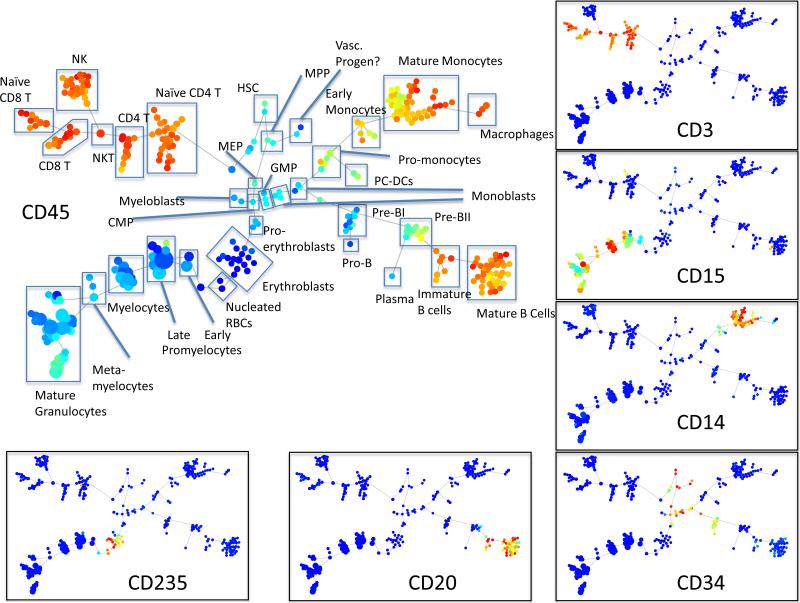
The reagents validated above were then combined into a panel with 25 antibodies against immune cell surface markers validated in a previous study (4). This panel was used to characterize the cell cycle state of healthy human bone marrow cells across the continuum of immunophenotypic differentiation during hematopoiesis. To accomplish this, fresh human bone marrow cells were incubated with IdU for 1 hour at 37°C immediately after aspiration. Cells were then fixed, permeabilized, incubated with the indicated antibodies and processed for mass cytometry. Data analysis was performed using the spanning tree progression analysis of density normalized events (SPADE) algorithm to visualize all of the measured cell events in a minimum spanning tree of immunophenotypically related cell clusters (4, 5). Briefly, this algorithm down-samples the input data in order to equalize the density of rare and abundant cell subsets. The down-sampled events are then agglomeratively clustered into clusters of “like” cells based on marker expression. The clustered cells are then connected to their nearest, most similar neighbors, to form a minimum spanning tree. In the last step the cells that were removed in the first step are up-sampled into clusters to which they are most similar based on marker expression. This clustering allowed the identification of 34 groups of related cell clusters correlated with characterized stages of immunophenotypic maturation (Figure 6 and (12)). The cell type (e.g. CD4 T cell) of each cluster (or group of clusters) was manually assigned on the basis of the mean expression level of each surface marker in the cluster (Figure 6, inset) (4). All of the major immune cell subsets that would be expected from the surface marker panel were identified.
Figure 6.
Immunophenotypic analysis of healthy human bone marrow. A minimum spanning tree was constructed using SPADE analysis based on 25 cell surface markers. The size of each circle in the tree approximates the relative frequency of cells that fall within boundaries of surface marker expression that define each node. Node color is scaled to the median intensity of expression of the indicated markers. Putative cell populations were annotated manually based on previous studies. Eight of the SPADE tree clusters could not be definitively identified on the basis of the surface markers present in this antibody panel. (Minimum and maximum node size was constrained to allow visualization of marker intensity.)
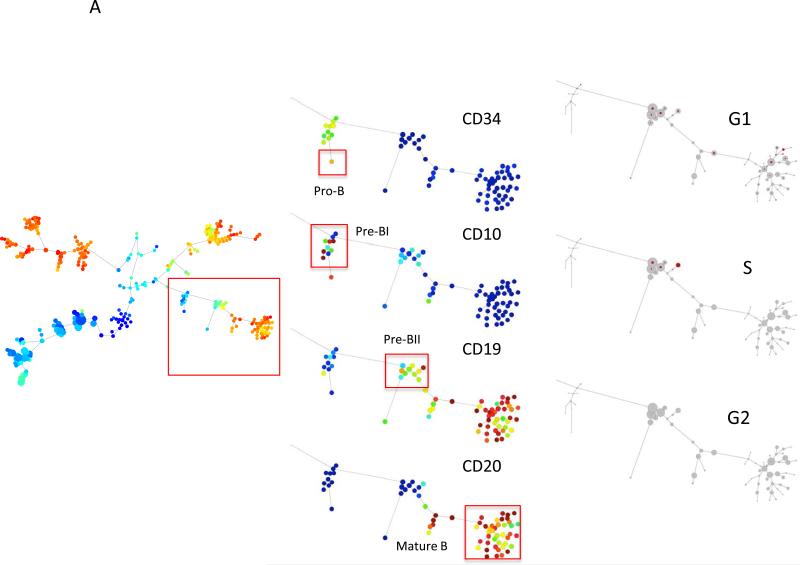
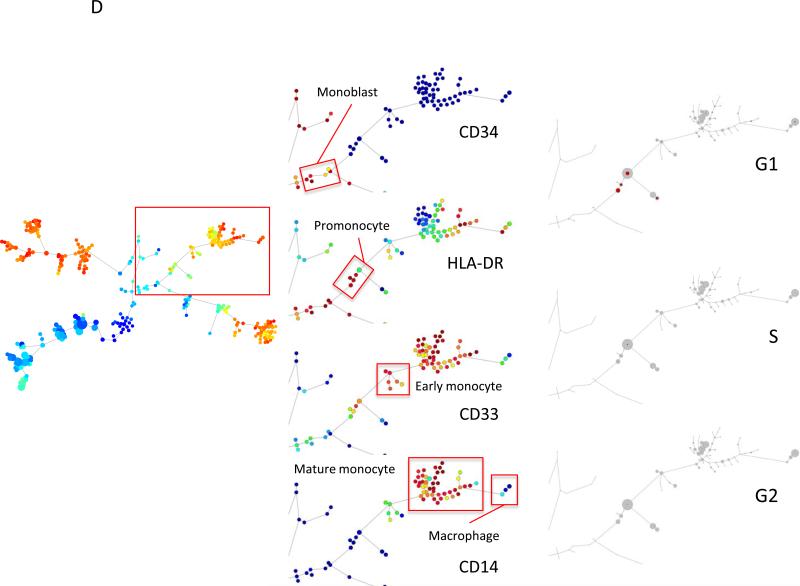
The cell cycle state distribution of the cells within each cluster was then analyzed. Figure 7 shows the relative proportion of cells from each cluster identified in each phase of the cell cycle. The cell cycle distribution of each immunophenotypic population is also listed in Table 2. The data confirm the cell cycle distribution expected based on studies of cell cycle distribution during hematopoiesis in model experimental systems (22, 23). Figure 7A shows the cell cycle distribution of the B cell lineage. The most immature B cell populations (CD34high, CD10mid) demonstrated very low proliferative rates, as did the most immunophenotypically mature cell subtypes (CD19+, CD20+). The highest fraction of G1 cells was found in the Pre-B I cell clusters (29%) and the highest S phase fraction was found in the Pre-B II cell clusters (17%).
Figure 7.
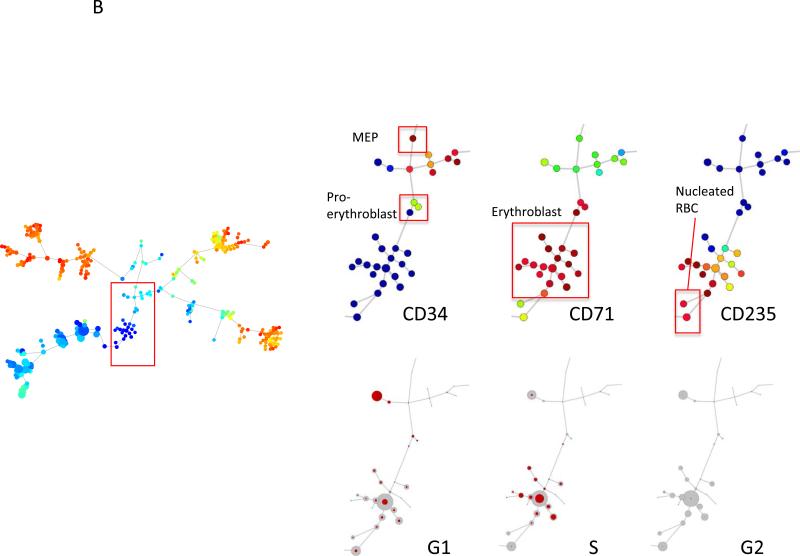
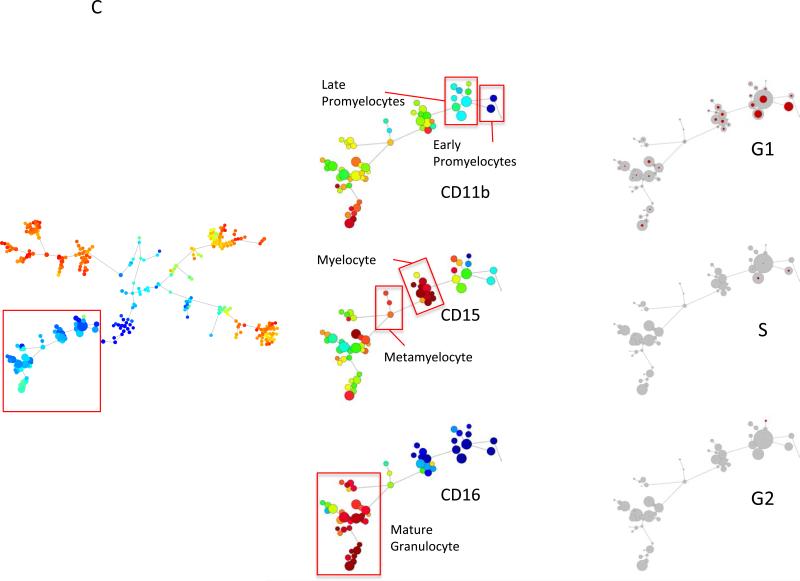
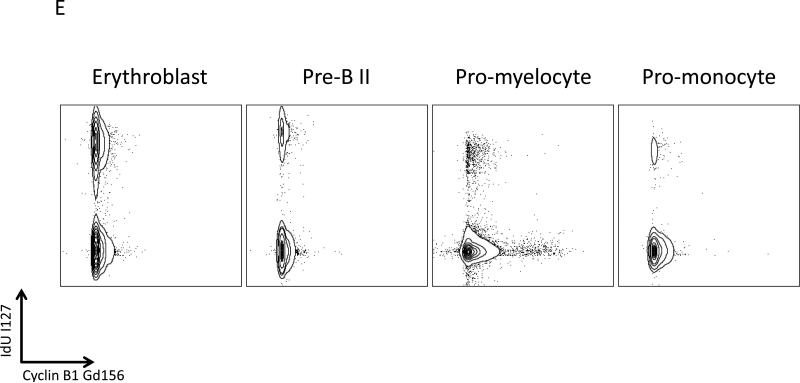
Mass cytometric measurement of the cell cycle distribution across normal human hematopoiesis. (A) Cell cycle distribution across B cell development. Left, “branch” of B cell development from hematopoietic tree shown in Figure 6. Center, population annotations and expression levels of population defining surface markers for the B cell “branch” (node color and node sizing scaling as described in Figure 6). Right, distribution of cells in each phase of the cell cycle in the B cell “branch” of the tree. The number of cells within each node is indicated by the size of the gray circle, while the number of cells in the labeled cell cycle phase is indicated by the size of the red circle. In the left column, the size of each circle is directly correlated with the number of cells within each node and there is no maximum or minimum size constraint. The red circle size is scaled such that a completely filled circle represents 67% of cells within the node in the indicated cell cycle phase. (B) Cell cycle distribution across erythroid development. Left, “branch” of erythroid development from hematopoietic tree shown i n Figure 6. Center, population annotations and expression levels of population defining surface markers for the erythroid “branch” (node color and node sizing scaling as described in Figure 6). Right, distribution of cells in each phase of the cell cycle in the erythroid “branch” of the tree. Node sizing as described in (A). (C) Cell cycle distribution across myeloid development. Left, “branch” of myeloid development from hematopoietic tree shown in Figure 6. Center, population annotations and expression levels of population defining surface markers for the myeloid “branch” (node color and node sizing scaling as described in Figure 6). Right, distribution of cells in each phase of the cell cycle in the myeloid “branch” of the tree. Node sizing as described in (A). (D) Cell cycle distribution across monocyte development. Left, “branch” of monocyte development from hematopoietic tree shown in Figure 6. Center, population annotations and expression levels of population defining surface markers for the monocyte “branch” (node color and node sizing scaling as described in Figure 6). Right, distribution of cells in each phase of the cell cycle in the monocyte “branch” of the tree. Node sizing as described in (A). (E) The amount of IdU incorporation varies across S phase cells of different developmental lineages. IdU signal versus cyclin B1 signal in the indicated cell subpopulations (as described in Figure 6).
Table 2.
Cell cycle distribution of cells at each stage of differentiation in normal human bone marrow.
| Cell Type | Total Cells | Percent G0 | G1 | S | G2 | M |
|---|---|---|---|---|---|---|
| B Lymphocyte | ||||||
| Pro-B | 16 | 100.00 | 0.00 | 0.00 | 0.00 | 0.00 |
| PreB I | 346 | 62.14 | 29.19 | 5.20 | 3.47 | 0.00 |
| Pre-B II | 2660 | 66.05 | 13.65 | 17.33 | 2.86 | 0.11 |
| Immature B | 1226 | 87.85 | 8.73 | 0.98 | 2.45 | 0.00 |
| Mature B | 4693 | 82.14 | 15.24 | 0.28 | 2.34 | 0.00 |
| Plasma | 77 | 59.74 | 29.87 | 5.19 | 5.19 | 0.00 |
| Erythroid | ||||||
| Pro Erythroblast | 229 | 5.68 | 59.39 | 27.51 | 7.42 | 0.00 |
| Erythroblast | 3155 | 27.48 | 23.74 | 42.85 | 3.52 | 2.41 |
| Nucleated Red | 564 | 69.50 | 18.97 | 7.62 | 3.55 | 0.35 |
| Myelocyte | ||||||
| Myeloblast/ Early ProMonocyte | 481 | 8.73 | 77.96 | 12.27 | 1.04 | 0.00 |
| Early Pro-Myelocytes | 4387 | 34.21 | 53.80 | 10.62 | 1.37 | 0.00 |
| Late ProMyelocytes | 18431 | 64.96 | 27.91 | 4.14 | 2.98 | 0.01 |
| Myelocytes | 18653 | 77.59 | 21.10 | 0.34 | 0.98 | 0.00 |
| Meta-Myelocytes | 2242 | 85.06 | 14.32 | 0.09 | 0.54 | 0.00 |
| Mature Granulocytes | 47851 | 87.89 | 11.07 | 0.05 | 0.98 | 0.00 |
| Monocyte | ||||||
| Early Monoblasts | 74 | 9.46 | 67.57 | 22.97 | 0.00 | 0.00 |
| Late Monoblasts | 58 | 3.45 | 81.03 | 15.52 | 0.00 | 0.00 |
| Pro-Monocytes | 1351 | 52.41 | 35.53 | 9.70 | 2.29 | 0.07 |
| Early Monocytes | 649 | 81.20 | 15.87 | 2.16 | 0.77 | 0.00 |
| Plamacytoid-DCs | 759 | 86.43 | 9.09 | 1.98 | 2.50 | 0.00 |
| Monocytes | 4554 | 86.12 | 9.18 | 0.46 | 4.24 | 0.00 |
| Macrophages | 842 | 89.67 | 8.79 | 0.00 | 1.54 | 0.00 |
| T Lymphocyte | ||||||
| CD4T (Naïve?) | 6363 | 94.25 | 1.79 | 0.41 | 3.52 | 0.03 |
| CD4 T | 4041 | 95.84 | 1.36 | 0.02 | 2.77 | 0.00 |
| NKT | 1125 | 75.29 | 22.22 | 0.09 | 2.40 | 0.00 |
| NK | 5651 | 80.04 | 17.20 | 0.32 | 2.44 | 0.00 |
| CD 8 T | 3864 | 95.86 | 1.58 | 0.23 | 2.30 | 0.03 |
| CD8 T (Naïve?) | 2895 | 92.71 | 3.83 | 0.31 | 3.11 | 0.03 |
| Stem and Progenitor | ||||||
| Hematopoietic Stem Cells | 48 | 87.50 | 10.42 | 0.00 | 2.08 | 0.00 |
| MPP | 28 | 67.86 | 28.57 | 0.00 | 3.57 | 0.00 |
| Vasc/Endo Progenitors | 22 | 95.45 | 4.55 | 0.00 | 0.00 | 0.00 |
| CMP | 40 | 55.00 | 32.50 | 5.00 | 7.50 | 0.00 |
| GMP | 59 | 44.07 | 45.76 | 5.08 | 5.08 | 0.00 |
| MEP | 14 | 21.43 | 50.00 | 28.57 | 0.00 | 0.00 |
We then examined other cell lineages known for “burst” kinetics of cell cycle progression. For instance, characterization of cell cycle phases for cells in the erythroid differentiation path showed that the most mature nucleated red cells (CD235+ CD71low) had a very low S-phase fraction (8%). The greatest fractions of G1 and S phase cells were isolated from the pro-erythroblast and erythroblast populations with S-phase fractions of 28% and 42%, respectively.
Further, the cell cycle distributions for myeloid and monocytic lineages are shown in Figures 7C and 7D, respectively. The distribution of S phase cells was similar in both of these lineages with the highest fractions in the myeloblast (12%), monoblast (23%), early promyelocyte (11%) and promonocyte (10%) populations, with no significant fraction of S phase cells in the mature myeloid and monocyte populations. Myeloblasts and monoblast populations also had very high fractions of G1 phase cells (78% and 68%, respectively; Figure 7E and Table 2) with the majority of cells not in S phase falling into G1 phase of the cell cycle.
Although the majority of bone marrow cell populations had less than 5% G2 phase cells across all stages of differentiation, a small but significant number of G2 cells persisted even in more differentiated cell types that lacked any significant numbers of S phase cells. In all myeloid populations, for instance, a small but significant number of G2 cells were present regardless of the degree of immunophenotypic differentiation, perhaps representing a biological or mechanistic need for cells to stall at this cell cycle stage. Co-expression of elevated levels of cyclin A confirmed that these cells were in the later portion of the cell cycle (Supplemental Figure 6). The G2 cells (IdU-, cyclin B1high) from the immature promyelocyte populations demonstrated the expected co-expression of elevated p-Rb(S807/811) and cyclin B; however, G2 cells (IdU-, cyclin B1high) from the mature myeloid populations expressed much lower levels of p-Rb(S807/811) than the immature myeloid cells (Supplemental Figure 6). This suggests that the mature myeloid cells in G2 phase of the cell cycle may have entered a G2 or G2-M arrest. To further investigate this possibility, the phosphorylation status of tyrosine 15 of cyclin dependent kinase 1 (p-CDK1) was measured. Consistent with the expression levels of p-Rb(S807/811), CDK1 phosphorylation was much higher in the G2 promyelocyte cells, and lower in the G2 cells of the mature myeloid cell populations (Supplemental Figure 6).
It was also observed that the amount of IdU incorporated into S phase cells was significantly different across the different cell lineages. As shown in Figure 7E, the median level of IdU signal measured in the S phase cells of the erythroblast, and pre-B II cell populations was 1148 and 2019, respectively. By contrast, the promyelocyte and promonocyte cell populations incorporated significantly less IdU during the same incubation (539 and 724, respectively). Since all of the cells in the experiment were incubated with IdU, antibody stained, and measured by mass cytometry simultaneously in the same tube, these differences appear to reflect true differences in the rate of uridine incorporation during S phase across these different cell lineages.
Discussion
A rapid, sensitive and reproducible mass cytometry panel for measuring phases of the cell cycle, on a single-cell basis, in cell lines and complex biological samples is presented. Two reagents, a p-Rb(S807/S811) monoclonal antibody and IdU, were characterized and adapted to mass cytometry, where they separated G0 and S phase cells respectively. Cyclins A and B1 were measured to distinguish G1 from G2 cells. M-phase cells were readily identified through the detection of p-HH3 (20). Previous measurements of the cell cycle using fluorescence-based flow cytometry with antibodies against IdU, cyclins, p-HH3(S28) as well as dyes detecting RNA and DNA are well established (16, 18, 24), but are limited in their ability to measure all phases simultaneously, particularly in complex cell populations that require use of multiple cell surface molecules, due to the inherent parameterization ceiling of fluorescence.
Mass cytometry was used here to study the cell cycle in a variety of human and murine tumor cell lines, cultured T cells (from both human PBMCs and murine spleen) and primary fresh human bone marrow from a healthy donor. Mass cytometry was directly compared with fluorescence cytometry and yielded equivalent results (Figures 2, 4, 5, and Supplemental Figure 4). After their optimization on an individual basis, mass cytometry reagents were incorporated into a panel comprised of seven antibodies against all phases of the cell cycle and then combined simultaneously with up to 24 antibodies against surface proteins that delineated multiple cell subsets as appropriate to the experimental systems at hand. The high parameterization allowed by mass cytometry resulted in deep profiling of all major phases of the cell cycle simultaneously in single cells in a variety of cell types including all of the major cell lineages across the entire spectrum of human hematopoiesis.
Given the established role of the Rb pathway in cancer and the multiple mechanisms by which the pathway can be disrupted, one potential caveat is the choice of an antibody against p-Rb(S807/811) to identify cells in G0, particularly when applying this methodology to primary samples from malignancies (25). However, combining the p-Rb(S807/S811) antibody in the mass cytometry panel with antibodies against other cell cycle markers such as p-CDK1(Y15), and cyclin A would allow for such cell cycle aberrations to be revealed. The choice of the p-Rb(S807/S811) antibody was based in a recent study that showed a cyclin C/Cdk3-dependent phosphorylation of Rb at serines 807 and 811 increased during the transition from G0 to G1. Here, the application of using this p-Rb(S807/S811) within the context of other antibodies recognizing all cell cycle phases is a new strategy for evaluating cell cycle status in single cells. Use of this antibody in conjunction with IdU to discriminate G0 from cycling cells agreed well with established protocols using pyronin Y (Figure 2) and also demonstrated good correlations with expression of cyclin A (peak G2) cyclin B1 (G2/M), as well as phosphorylation of tyrosine 15 on Cdk2 (Supplemental Figure 6 and data not shown). Of note was the presence of three cell sub-populations of p-Rb(S807/811) expression; negative, mid and high levels of p-Rb(S807/811) (Figures 4 and 5)—indicating potential transition stages that might be relevant for a better understanding of mechanistic events during this process. Including antibodies to cleaved caspase 3 and PARP established that the p-Rb- population appears to be most closely associated with dead cells (Supplemental Figure 5) or cells undergoing DNA damage response (data not shown). The p-Rbmid sub-population represents cells in G0 and this population could be easily gated in a biaxial IdU vs. p-Rb(S807/811) flow plot. This gate is thus dependent on the presence of some S-phase cells in the sample. Although, this requirement for IdU positive cells may be a limitation for discerning G0 and G1 cells in rare, non-proliferating populations (such as HSCs), it is easily overcome by defining gates based on closely related, proliferating cell populations (such as multipotent progenitor (MPP) cells) or by spiking in a defined proliferating cell type.
The finding of G0 cell subpopulations in all four of the cell lines tested was unexpected. However, the levels of proliferation markers by mass and fluorescence cytometry were consistent with the G0 assignment. In the current study, the G0 (pRbmid) cells observed in U937, HL-60, and NALM6 cells have low expression of cyclins A and B1, Ki-67 (Supplemental Figure 5), low staining with pyronin Y (Supplementary Figure 4), and low levels of pp-rpS6 (data not shown). Furthermore, a recent study described a “G0-like” populations in the MCF7 and HCT116 cancer cell lines. These cells were characterized by 2n DNA content (using Hoechst 33342), low levels of reactive oxygen species, expression of the senescence marker HES1, and low protein and mRNA levels of several proliferation-associated proteins (MKI67, MCM2, CDC6, GMNN, AURKA, PLK1). Interestingly, these cells could still form colonies, suggesting that this “G0-like” state was transient (26). The increased number of reagents enabled by mass cytometry, for measuring multiple parameters within the cell cycle allowed for a reliable assignment of cell cycle phases.
Given the ability of total cyclin levels to discriminate G1 from G2 cell populations, it is important to note that unscheduled cyclin synthesis has been documented for several cancer cell lines and tumor samples (16, 27), and could potentially confound clear cell cycle phase assignments. However, both the HL-60 and U937 cell lines tested in this report were previously shown to exhibit unscheduled cyclin B1 synthesis with abnormally high levels in G1 and S phase (27), yet a G2 population could be delineated in both of these cell lines (Figure 4 and data not shown). The ability to measure the G2 phase cell population in the presence of unscheduled cyclin B1 likely derives from the ability to clearly identify S-phase cells by IdU incorporation and thereby increase the resolution of IdU negative G1 and G2 cells based on cyclin B1 levels (Figures 3, 4 and 5). In addition, measurement of cyclin A, which has not been shown to exhibit unscheduled synthesis, was well correlated with cyclin B1 expression and can be used in conjunction with cyclin B1 to discriminate G1 and G2 populations (Figure 3, Supplemental Figure 6, and data not shown) (16).
The utility of IdU is based on its ability to be directly detected in S phase cells without the use of an antibody, since Iodine's atomic mass of 127 Daltons falls within the mass range of the time of flight mass spectrometer. The data presented in the 2D flow plots from multiple mass cytometry experiments confirm unequivocally the ability of IdU to identify S-phase cells (Figures 1-5). Of note, the methodology described in this report was designed to measure the cell cycle distribution at a single point in time and requires that S-phase cells be actively synthesizing DNA at the time of labeling. Additional antibodies against S-phase specific proteins, are currently under study as a means to definitively identify S- and G2- arrested cells by mass cytometry. This will be important in future studies measuring the cell cycle response to drug treatments that could induce S-phase checkpoints. Should a kinetic analysis of the cell cycle be desired, cells could also be labeled with a second halogenated nucleotide analog (e.g. 5-chloro-2-deoxyruidine) to allow for complete assessment of cell cycle kinetics (e.g. Ts, Tpot). Although, this would require antibody detection of the second halogenated nucleotide analog and traditional sample processing to expose single-stranded DNA for antibody binding. In its current form, this methodology has been rigorously characterized for fresh, rather than cryopreserved, samples. Although it is more likely that a fresh sample will be more reflective of the pathophysiology of the biologic system under evaluation, studies are currently underway (data not shown) to determine the effects of cryopreservation on cell cycle phase distribution and to develop methods to return cells to their previous cell cycle state upon thawing.
An application of the cell cycle reagent panel developed and characterized for mass cytometry was a proof of principle analysis of the cell cycle in single cells across the continuum of normal human hematopoiesis. The mass cytometry data recapitulated the relative frequencies of immature and differentiated cell populations during the hematopoietic differentiation program in fresh human bone marrow as described previously (Figure 6 and Table 2) (4) (23, 28) and was also consistent with data from eight other healthy human samples (Bendall et al. and E. Simonds unpublished data). These preliminary data measured the cell cycle status in B lymphocytic, erythroid and myeloid differentiation lineage pathways (Figure 7(A – D). For the B lymphocytic lineage, most G1/ S cells were confined to pro-B, pre-B1 and pre-B2 stages (Figure 7(A). For the erythroid lineage, G1/S phase cells were localized to the megakaryocyte/erythroid progenitor and erythroblast stages (Figure 7(B). For the myelocytic/granulocytic lineage, G1/S cells were also most common in early stages of differentiation, however, a much smaller G2 sub-population persisted across all differentiation stages. Previous studies utilizing in vivo BrdU labeling in murine systems to analyze the cell cycle distribution of progenitor and mature populations (29, 30) yielded similar results, with the S-phase fraction highest among the late progenitor populations and lowest in HSCs and mature differentiated cell populations. Similar to this study, Passegue and colleagues also observed a small fraction of G2 phase cells among terminally differentiated myeloid cell populations in murine bone marrow (30) and Head et al. observed a similar population in mature human myeloid cells in both normal donors and patients with myelodysplastic syndrome (31). Finally, mass cytometry allowed for direct quantitative comparisons to be made across all of the major immunophenotypic populations of the human bone marrow. As a result, variations in the amount of IdU incorporated by S phase cells (Figure 7E) and cell type-specific variations in total cyclin levels and the phosphorylation of Rb (data not shown) could be appreciated. The mass cytometry data reported here form a foundation for follow-up analyses of cell cycle status in a large number of human peripheral blood and bone marrow samples from healthy donors. These data could provide an important reference for analogous studies with disease samples.
Herein single cell mass cytometry has proven sensitive to enable quantitative cell cycle determinations across finely characterized cell sub-populations within immunophenotypically homogeneous or functionally complex samples. The analysis can be extended as additional unique isotopic CyTOF reagents become available, for instance in determinations of immunophenotypic surface markers or intracellular signaling proteins involved in cellular functions such as survival, proliferation, metabolism, DNA damage response, or apoptosis. Given the integral role of cell cycle phase to therapeutic response this type of comprehensive analysis could provide greater mechanistic understanding of drug action coupled to more accurate clinical diagnostics. The previously established utility of xenotransplant studies and colony formation assays for predicting outcomes in hematopoietic malignancies (6, 7, 9, 32) also suggests that the ability to measure proliferation among hematopoietic stem cells and other immature immunophenotypic subtypes could have potential prognostic value in treating hematologic malignancies. Finally this technology could also allow for improved detection of minimal residual disease, by simultaneously allowing both fine immunophenotypic resolution and discrimination of residual cells capable of entering the cell cycle from those that have become senescent as a result of treatment.
Supplementary Material
Acknowledgements
The authors wish to thank Angelica Trejo and Astrea Jager for technical assistance and support. The authors would also like to thank Eli Zunder, Tiffany Chen, Bernd Bodenmiller, Erin Simonds, Rachel Finck, and Sabrina Spencer for helpful discussions and sharing of unpublished data and reagents.
Footnotes
This work was supported by NIH/NCI grants U19 AI057229, P01 CA034233, HHSN272200700038C, 1R01CA130826, NCI RFA CA 09-011, NHLBI-HV-10-05(2); CIRM DR1-01477 and RB2-01592; European Commission HEALTH.2010.1.2-1; and the Bill and Melinda Gates Foundation (GF12141-137101) to G.P.N.. G.PN. is also supported by the Rachford and Carlota A. Harris Endowed Professorship. GKB is supported by a developmental research grant from the Stanford Cancer Center.
Conflict of Interest Disclosures:
Garry Nolan: Scientific advisory board of DVS Sciences, Board of directors of Nodality Inc. Wendy Fantl: Consultant for, and equity ownership of Nodality Inc.
References
- 1.Ornatsky O, Baranov VI, Bandura DR, Tanner SD, Dick J. Multiple cellular antigen detection by ICP-MS. J Immunol Methods. 2006 Jan 20;308:68. doi: 10.1016/j.jim.2005.09.020. [DOI] [PubMed] [Google Scholar]
- 2.Ornatsky OI, et al. Development of analytical methods for multiplex bioassay with inductively coupled plasma mass spectrometry. J Anal At Spectrom. 2008;23:463. doi: 10.1039/b710510j. [DOI] [PMC free article] [PubMed] [Google Scholar]
- 3.Bandura DR, et al. Mass cytometry: technique for real time single cell multitarget immunoassay based on inductively coupled plasma time-of-flight mass spectrometry. Anal Chem. 2009 Aug 15;81:6813. doi: 10.1021/ac901049w. [DOI] [PubMed] [Google Scholar]
- 4.Bendall SC, et al. Single-cell mass cytometry of differential immune and drug responses across a human hematopoietic continuum. Science. 2011 May 6;332:687. doi: 10.1126/science.1198704. [DOI] [PMC free article] [PubMed] [Google Scholar]
- 5.Qiu P, et al. Extracting a cellular hierarchy from high-dimensional cytometry data with SPADE. Nat Biotech. 2011;29:886. doi: 10.1038/nbt.1991. [DOI] [PMC free article] [PubMed] [Google Scholar]
- 6.Griffin J, Lowenberg B. Clonogenic cells in acute myeloblastic leukemia. Blood. 1986 Dec 1;68:1185. 1986. [PubMed] [Google Scholar]
- 7.Moore MA, Spitzer G, Williams N, Metcalf D, Buckley J. Agar culture studies in 127 cases of untreated acute leukemia: the prognostic value of reclassification of leukemia according to in vitro growth characteristics. Blood. 1974 Jul;44:1. [PubMed] [Google Scholar]
- 8.Raza A, et al. Cell cycle kinetic studies in 68 patients with myelodysplastic syndromes following intravenous iodo- and/or bromodeoxyuridine. Exp Hematol. 1997 Jun;25:530. [PubMed] [Google Scholar]
- 9.Pearce DJ, et al. AML engraftment in the NOD/SCID assay reflects the outcome of AML: implications for our understanding of the heterogeneity of AML. Blood. 2006 Feb 1;107:1166. doi: 10.1182/blood-2005-06-2325. 2006. [DOI] [PMC free article] [PubMed] [Google Scholar]
- 10.Hahne F, et al. flowCore: a Bioconductor package for high throughput flow cytometry. BMC Bioinformatics. 2009;10:106. doi: 10.1186/1471-2105-10-106. [DOI] [PMC free article] [PubMed] [Google Scholar]
- 11.Kotecha N, Krutzik PO, Irish JM. Web-based analysis and publication of flow cytometry experiments. Curr Protoc Cytom. 2010 Jul;:17. doi: 10.1002/0471142956.cy1017s53. Chapter 10, Unit10. [DOI] [PMC free article] [PubMed] [Google Scholar]
- 12.van Lochem EG, et al. Immunophenotypic differentiation patterns of normal hematopoiesis in human bone marrow: Reference patterns for age-related changes and disease-induced shifts. Cytometry Part B: Clinical Cytometry. 2004;60B:1. doi: 10.1002/cyto.b.20008. [DOI] [PubMed] [Google Scholar]
- 13.Ornatsky OI, et al. Study of cell antigens and intracellular DNA by identification of element-containing labels and metallointercalators using inductively coupled plasma mass spectrometry. Anal Chem. 2008 Apr 1;80:2539. doi: 10.1021/ac702128m. [DOI] [PubMed] [Google Scholar]
- 14.Rothaeusler K, Baumgarth N. Evaluation of intranuclear BrdU detection procedures for use in multicolor flow cytometry. Cytometry Part A. 2006 Apr;69A:249. doi: 10.1002/cyto.a.20252. [DOI] [PMC free article] [PubMed] [Google Scholar]
- 15.Ren S, Rollins BJ. Cyclin C/Cdk3 Promotes Rb-Dependent G0 Exit. Cell. 2004;117:239. doi: 10.1016/s0092-8674(04)00300-9. [DOI] [PubMed] [Google Scholar]
- 16.Darzynkiewicz Z, Gong J, Juan G, Ardelt B, Traganos F. Cytometry of cyclin proteins. Cytometry. 1996;25:1. doi: 10.1002/(SICI)1097-0320(19960901)25:1<1::AID-CYTO1>3.0.CO;2-N. [DOI] [PubMed] [Google Scholar]
- 17.Juan G, Darzynkiewicz Z. Detection of mitotic cells. Curr Protoc Cytom. 2004 May;:24. doi: 10.1002/0471142956.cy0724s28. Chapter 7, Unit 7. [DOI] [PubMed] [Google Scholar]
- 18.Jacobberger JW, Sramkoski RM, Stefan T. Multiparameter cell cycle analysis. Methods in molecular biology. 2011;699:229. doi: 10.1007/978-1-61737-950-5_11. [DOI] [PubMed] [Google Scholar]
- 19.Goto H, Yasui Y, Nigg EA, Inagaki M. Aurora-B phosphorylates Histone H3 at serine28 with regard to the mitotic chromosome condensation. Genes to Cells. 2002;7:11. doi: 10.1046/j.1356-9597.2001.00498.x. [DOI] [PubMed] [Google Scholar]
- 20.Hirata A, et al. Characterization of a monoclonal antibody, HTA28, recognizing a histone H3 phosphorylation site as a useful marker of M-phase cells. J Histochem Cytochem. 2004 Nov;52:1503. doi: 10.1369/jhc.4A6285.2004. [DOI] [PMC free article] [PubMed] [Google Scholar]
- 21.Darzynkiewicz Z, Juan G, Srour EF. Differential staining of DNA and RNA. Curr Protoc Cytom. 2004 Nov;:3. doi: 10.1002/0471142956.cy0703s30. Chapter 7, Unit 7. [DOI] [PubMed] [Google Scholar]
- 22.Cheshier SH, Prohaska SS, Weissman IL. The effect of bleeding on hematopoietic stem cell cycling and self-renewal. Stem Cells Dev. 2007 Oct;16:707. doi: 10.1089/scd.2007.0017. [DOI] [PubMed] [Google Scholar]
- 23.Bryder D, Rossi DJ, Weissman IL. Hematopoietic stem cells: the paradigmatic tissue-specific stem cell. Am J Pathol. 2006 Aug;169:338. doi: 10.2353/ajpath.2006.060312. [DOI] [PMC free article] [PubMed] [Google Scholar]
- 24.Darzynkiewicz Z, Crissman H, Jacobberger JW. Cytometry of the cell cycle: Cycling through history. Cytometry Part A. 2004;58A:21. doi: 10.1002/cyto.a.20003. [DOI] [PubMed] [Google Scholar]
- 25.Knudsen ES, Wang JY. Targeting the RB-pathway in cancer therapy. Clin Cancer Res. 2010 Feb 15;16:1094. doi: 10.1158/1078-0432.CCR-09-0787. [DOI] [PMC free article] [PubMed] [Google Scholar]
- 26.Dey-Guha I, et al. Asymmetric cancer cell division regulated by AKT. Proceedings of the National Academy of Sciences. 2011 Aug 2;108:12845. doi: 10.1073/pnas.1109632108. 2011. [DOI] [PMC free article] [PubMed] [Google Scholar]
- 27.Gong J, Ardelt B, Traganos F, Darzynkiewicz Z. Unscheduled Expression of Cyclin B1 and Cyclin E in Several Leukemic and Solid Tumor Cell Lines. Cancer Research. 1994 Aug 15;54:4285. 1994. [PubMed] [Google Scholar]
- 28.Chao MP, Seita J, Weissman IL. Establishment of a normal hematopoietic and leukemia stem cell hierarchy. Cold Spring Harb Symp Quant Biol. 2008;73:439. doi: 10.1101/sqb.2008.73.031. [DOI] [PubMed] [Google Scholar]
- 29.Cheshier SH, Morrison SJ, Liao X, Weissman IL. In vivo proliferation and cell cycle kinetics of long-term self-renewing hematopoietic stem cells. Proceedings of the National Academy of Sciences of the United States of America. 1999 Mar 16;96:3120. doi: 10.1073/pnas.96.6.3120. [DOI] [PMC free article] [PubMed] [Google Scholar]
- 30.Passegue E, Wagers AJ, Giuriato S, Anderson WC, Weissman IL. Global analysis of proliferation and cell cycle gene expression in the regulation of hematopoietic stem and progenitor cell fates. J Exp Med. 2005 Dec 5;202:1599. doi: 10.1084/jem.20050967. [DOI] [PMC free article] [PubMed] [Google Scholar]
- 31.Head DR, et al. Innovative Analyses Support a Role for DNA Damage and an Aberrant Cell Cycle in Myelodysplastic Syndrome Pathogenesis. Bone Marrow Research. 2011;2011 doi: 10.1155/2011/950934. [DOI] [PMC free article] [PubMed] [Google Scholar]
- 32.Preisler H. Prediction of response to chemotherapy in acute myelocytic leukemia. Blood. 1980 Sep 1;56:361. 1980. [PubMed] [Google Scholar]
Associated Data
This section collects any data citations, data availability statements, or supplementary materials included in this article.


