Abstract
List-mode processing provides an efficient way to deal with sparse projections in iterative image reconstruction for emission tomography. An issue often reported is the tremendous amount of computation required by such algorithm. Each recorded event requires several back- and forward line projections. We investigated the use of the programmable graphics processing unit (GPU) to accelerate the line-projection operations and implement fully-3D list-mode ordered-subsets expectation-maximization for positron emission tomography (PET). We designed a reconstruction approach that incorporates resolution kernels, which model the spatially-varying physical processes associated with photon emission, transport and detection. Our development is particularly suitable for applications where the projection data is sparse, such as high-resolution, dynamic, and time-of-flight PET reconstruction. The GPU approach runs more than 50 times faster than an equivalent CPU implementation while image quality and accuracy are virtually identical. This paper describes in details how the GPU can be used to accelerate the line projection operations, even when the lines-of-response have arbitrary endpoint locations and shift-varying resolution kernels are used. A quantitative evaluation is included to validate the correctness of this new approach.
Keywords: Graphics processing units, iterative image reconstruction, list-mode, ordered-subset expectation-maximization, positron emission tomography, single photon emission computed tomography
I. Introduction
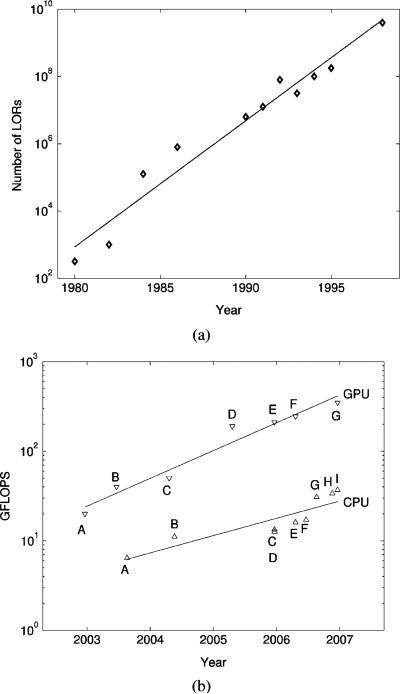
Over the years, the number of lines-of-response (LORs) (or detector pairs) in modern positron emission tomography (PET) systems has increased by orders of magnitude (Fig. 1(a) and [1]). This trend has been driven by smaller detector crystals, more accurate 3-D photon positioning, larger solid angle coverage, and 3-D acquisition. These advances have boosted the spatial resolution and the photon sensitivity of PET systems. However, they have made the task of reconstructing images from the collected data more difficult. The demand in computation and memory storage for high-resolution PET has exploded, outpacing the advances in memory capacity and processor performance [2]. Therefore, algorithms whose complexity and memory usage do not depend on the number of LORs are attractive for state-of-the-art PET systems. In this context, performing reconstruction directly from the raw list-mode data has proved to be particularly appealing and useful for dealing with the parameter complexity as well as sparseness of the dataset.
Fig. 1.
(a) Trend in the number of LORs for PET systems (Adapted from [1] with permission). (b) Trend in the computational performance P for CPUs and GPUs over five years: . GPUs: NVIDIA GeForce FX 5800 (A), FX 5950 Ultra (B), 6800 Ultra (C), 7800 GTX (D), Quadro FX 4500 (E), GeForce 7900 GTX (F) and 8800 GTX (G); CPUs: Athlon 64 3200+ (A), Pentium IV 560 (B), Pentium D 960 (C), 950 (D), Athlon 64 X2 5000+ (E), Core 2 Duo E6700 (F), Core 2 Quad Q6600 (G), Athlon 64 FX-74 (H) and Core 2 Quad QX6700 (I).
Statistical image reconstruction methods, such as ordered-subsets expectation-maximization (OSEM), account for the stochastic nature of the imaging process. These iterative algorithms have been shown to offer a better trade-off between noise and resolution in comparison to filtered backprojection [3], [4], but are computationally intensive. Memory usage is also a point of concern for the reconstruction. The system response matrix (SRM), which maps the image voxels to the scanner detectors and models the imaging process, can be gigantic [5].
These issues have been addressed using various methods. The SRM can be factored into the product of smaller components that are stored in memory [6]. Some implementations also compute parts (such as solid angle) of this factorization on-the-fly, which saves memory but adds workload to the processor. The SRM can also be compressed using symmetries and near-symmetries [7], and extracted only when needed to limit the memory profile.
Another approach to reduce the complexity of the reconstruction involves rebinning the 3-D projections into a stack of 2-D sinograms that can be reconstructed independently using a 2-D reconstruction method, such as filtered-backprojection (FBP) or 2D-OSEM. Fourier rebinning (FORE), combined with 2D-OSEM [8], is an order of magnitude faster than 3D-OSEM. Furthermore, it has been shown to produce images that are not significantly degraded compared to 3D-OSEM for whole-body clinical scanners [9]. However, for high-resolution pre-clinical PET systems, the average number of counts recorded per LOR is low (i.e., the data is sparse). As a consequence, the measured projections do not reflect the ideal line integral and the potential for resolution recovery is lost with this approach [6].
In list-mode, the focus of this paper, the LOR index and other physical quantities (e.g., time, energy, TOF, depth-of-interaction, or incident photon angle) are stored sequentially in a long list as the scanner records the events. The problem of reconstructing directly from the list-mode data lends itself to a maximum-likelihood formulation. Despite its computation burden, this processing method has gained popularity [2], [5], [10]–[14]. List-mode is an efficient format to process sparse data sets, such as dynamic or low count studies. It has additional benefits, namely: 1) additional information can be stored for each event, 2) complete subsets can be formed by splitting the events according to their arrival time, 3) the symmetries of the system are preserved, 4) image reconstruction can be started when the acquisition begins, 5) events can be positioned continuously in space and time, and 6) data can be converted to any other format.
Incorporation of an accurate spatially-variant resolution model for PET has been shown to help reduce quantitative errors [15], [16] and improve resolution by deconvolving the system blurring. Yet, including the contribution of voxels that are off of the LOR axis increases the number of voxels processed by an order of magnitude and slows the back- and forward line projection operations.
We investigated practical ways to accelerate list-mode 3D-OSEM reconstruction using programmable graphics hardware, namely the graphics processing unit (GPU) [17]. Primarily designed to deliver high-definition graphics for video games in real-time, GPUs are now increasingly being used as cost-effective high-performance coprocessors for scientific computing [18]. GPUs are characterized by massively parallel processing, fast clock-rate, high-bandwidth memory access, and hardwired mathematical functions. The size of their on-board memory (<1.5 Gb) may currently be the most limiting factor for performing accurate reconstruction with GPUs. Nevertheless, these characteristics make them particularly well suited for an on-the-fly scheme with high computational intensity.
As shown on Fig. 1(b), over the last five years, GPUs’ peak performance P has increased at a faster rate than CPU's: PGPU ≈ PCPU1.6. GPUs are single-instruction multiple-data (SIMD) processors but multicore CPUs are multiple-instruction multiple-data (MIMD). MIMD leads to more complex designs because multiple instruction decode blocks as well as special logic are required to avoid data read/write hazards. SIMD also dedicates less area to the data cache and more to the arithmetic logic units. As a result, the number of parallel SIMD processing units has been growing faster than has the number of MIMDs. It therefore appears likely that GPUs will continue to be increasingly useful for medical image reconstruction as the performance gap with CPUs widens.
Iterative reconstruction on GPU has been the focus of previous research. Texture mapping on nonprogrammable graphics hardware was first proposed in 1994 [19] as a way to accelerate cone-beam FBP. The same technique was later applied to port OSEM to a consumer-grade graphics architecture [20]. More accurate methods were developed once the GPU became programmable and handled floating-point textures. The general approach was first described for processing sinograms using FBP and EM [21], and the ordered subset convex reconstruction algorithm [22]. Attenuation correction and the incorporation of a point spread function were also addressed for SPECT [23]. A real-time GPU-based reconstruction framework was developed for X-ray CT [24]. These methods [19]–[24] have been successful because the GPU is efficient at applying the affine transformation that maps a slice through the volumetric image to any sinogram projection view, and vice-versa.
The main challenge in implementing list-mode OSEM on the GPU is that the list-mode LORs are not arranged in any regular pattern like sinogram LORs. The mapping between the list-mode data and the volumetric image is not affine, and as a result texture mapping cannot be used in this context. The projection operations must be line driven, which means that the back- and forward projections must be performed on a per LOR basis. This motivates the design and investigation of a novel GPU technique to back- and forward project individual LORs described by arbitrary endpoint locations, even when a shift-varying kernel is used to model the response of the system. No existing GPU projection technique has addressed the specific issues of list-mode processing. These issues also arise when data is processed in histogram-mode, in which case a weight, representing the measured projection, is passed to the GPU with each LOR. Even sinogram-based reconstruction can be performed in this new LOR-driven framework by describing each sinogram bin by its value and the two LOR endpoint locations; however this approach would be less efficient than the GPU texture mapping technique cited above. We also propose a novel framework to define arbitrary, shift-varying system response kernels that are evaluated on-the-fly by parallel units within the GPU. This feature is important to correct for the various resolution blurring factors in emission tomography.
The implementation on the GPU of list-mode 3D-OSEM with shift-varying kernels is challenging because the graphics pipeline architecture does not run efficiently unless the two main components (line back- and forward projections) are reformulated. This reformulation involves handling line backprojection using the GPU rasterizer and decomposing line forward projection into smaller elementary operations that run efficiently in parallel on the GPU. We proved, both mathematically and experimentally, that the reformulated operations replicate the correct line back- and forward projections. These two GPU-based approaches to image reconstruction are reported here for the first time.
II. Materials and Methods
A. List-Mode Ordered-Subset Expectation-Maximization
The list-mode 3D-OSEM algorithm is described in [11] and [14]. It can be formulated as
| (1) |
where is the 3-D reconstructed image after iteration m and subset l. Voxels are indexed by j = 1, . . . , J. The events are partitioned into subsets Sl, l = 1, . . . , L. The image estimate after iteration m is λm+1,1 = λm,L+1. For list-mode, the subsets are formed according to the arrival time of the events. The SRM coefficients pij model the probability that a positron emitted from voxel j will generate two annihilation photons detected along the LOR i. The sensitivity image
| (2) |
takes into account the nonuniform density of LORs throughout the volumetric image and the change in sensitivity wi along LOR i as caused by tissue attenuation and geometrical and intrinsic detection efficiency variations. This computation requires the time-consuming backprojection of all LORs, unless variance reduction techniques are used [25].
For the study reported here, corrections for photon attenuation, scatter, random coincidences and dead time were not implemented. In order to account for randoms and scatter in the reconstruction process, a scatter estimate sik and a random estimate rik are added to the forward projection. These estimates can be either loaded into the GPU together with the LOR attributes or directly computed on the GPU, in which case they are stored in video memory.
B. System Response Kernels
The spatial resolution in PET is degraded by physical processes associated with photon emission, transport and detection. These resolution blurring factors can be modeled in the SRM. This provides resolution recovery through deconvolution on condition that the model is accurate enough, the SNR is high enough and the number of iterations is sufficient. Several experiments have shown that incorporating a model of the system response can improve the performance of the reconstruction for certain tasks [6], [7], [16], [26].
In the GPU line-projection technique we have developed, we generalize the notion of system response matrix by modeling the system response using kernels. Kernels are nonnegative real-valued functions that model the contribution of each voxel to each LOR as a function of multiple variables. These variables include the indices of the current LOR and voxel, which allow any SRM to be represented with a kernel. Kernels can be described more generally by selecting another choice of parametrization, such as the center Vj of voxel j, the projection Lij of Vj on LOR i, the distance dij between the center of voxel j and LOR i, the distances between Lij and each of the two detectors and , the orientation ui and length li of LOR i, the time-of-flight τi, and the photon depth-of-interaction for each detector and . Kernels are smooth approximations of the SRM, independent of the voxel size. They allow for compact representations of the resolution-blurring process by taking advantage of the geometrical redundancies in the system.
The kernel is evaluated at all voxels that contribute significantly to LOR i. We call the set of such voxels the tube-of-response (TOR), further defined by a cylinder
| (3) |
where η is a user-defined constant which sets an upper bound on the distance dij between voxel j and LOR i. While SRMs are implemented by lookup tables, kernels allow for a mix of memory lookups and on-the-fly computations and lead to a higher computational intensity (defined as the ratio of arithmetic logic unit to memory usage). Kernels can also be evaluated at each voxel independently, in the GPU parallel processing units.
The results presented in this paper are based on a fixed-width Gaussian kernel centered on the LOR axis. The full-width half-maximum (FWHM) was chosen to match the average system-resolution blurring. The kernel K is parametrized by the distance dij between the center of voxel j and LOR i
| (4) |
and we have pij = K(dij). This kernel is not the perfect representation of the system response, but it is sufficient to demonstrate the GPU line-projection technique. More advanced kernels can be implemented on the GPU, for example, by varying σ as a function of the LOR orientation ui and the distance to the detectors and .
C. Hardware
The GeForce 8800 GT, G92 chipset (NVIDIA, Santa Clara, CA) has 112 parallel shading units clocked at 1.5 GHz. It allows 32-bit floating point processing throughout the entire pipeline. On-board video memory (512 Mb) is accessed through a 256-bit bus with a peak transfer rate of 64 Gb/s. The cost of this GPU is equivalent to the cost of a high-end dual-core CPU. For the implementation of list-mode 3D-OSEM on the GeForce 8800 GT, the Cg compiler 2.0 [27] served to compile programs for the shading units. The OpenGL 2.1 graphics API interfaced between the CPU and the GPU. We did not use the CUDA (compute unified device architecture) library. CUDA facilitates the development of high-performance computation on the GPU, but does not interface with all the features of the GPU. OpenGL and Cg allowed us to use the rasterizer, the blending units and texture mapping, which are key elements for our technique.
D. GPU Implementation
In order to use the GPU pipeline efficiently, we reformulated the projections to enhance parallelism and match the pipeline architecture.
1) Data Representation
GPU memory is organized in textures, which in computer graphics are used to store color images. A 2-D color texture forms an array of 32-bit floating-point quadruples, that can be accessed randomly by GPU shaders. We stored the volumetric images used for reconstruction in such textures by tiling the stack of slices.
The list-mode projection data, consisting of LOR endpoints and the projection value, were stored in another 2-D texture using the four color channels. This storage scheme allows for continuous positioning of the LORs in space.
We used the OpenGL framebuffer object (FBO) extension to enable shaders to write directly to texture.
2) Line Projection Stages
The forward projection of λj along LOR i and the backprojection of LOR i with weight ωi into volumetric image are mathematically represented as, respectively
| (5) |
| (6) |
Both operations can be conceptualized of as a sequence of three stages. In the first stage, the voxels Ti that contribute non-negligibly to LOR i are identified. In the second stage, further processing is performed on the voxels identified in the first stage. The kernel parameter variables are computed from LOR i and voxel j attributes and then used to evaluate the system response kernel pij. In the last stage, the data vector (image or projection data) is updated according to (5) and (6).
3) Voxel Identification for Line Forward Projection
The voxel identification stage consists of determining the voxels Ti that are to be processed during the line back- and forward projection of LOR i. In a typical CPU code, this task would be carried out by three levels of nested loops with variable bounds. On the GPU, this stage was the most problematic because pixel shaders can only write to the pixel on which they are called. GPUs also do not implement efficiently nested loops with variable bounds, unless the same constant number of iterations are executed in each parallel unit. When the number of iterations is constant, all parallel units run the same number of instructions and the loops can be unrolled. The line forward-projector was efficiently reformulated so that all loops run a constant number of iterations.
Let us assume that the LOR main direction is along ex, i.e.,
| (7) |
where ui denotes the direction vector for LOR i. This relationship can always be satisfied by switching dimensions if needed. As shown later, (7) is important to ensure that the number of iterations in distributed loops is bounded.
The line forward projection of the volumetric image λj along LOR i can be described equivalently as
| (8) |
where
| (9) |
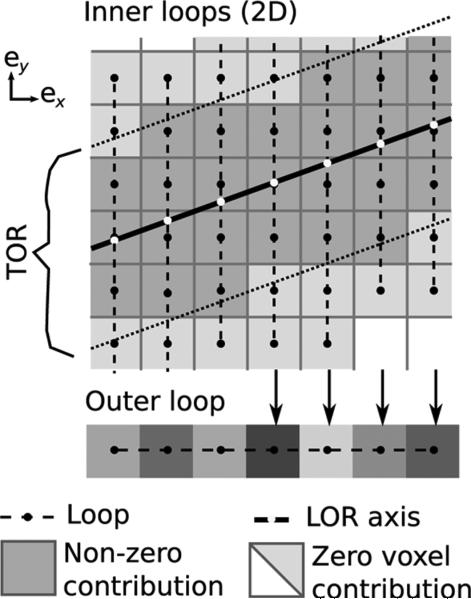
and represents a slice of the volumetric image along the ex axis, indexed by an index x = 1 . . . X where X is the number of slices. In this formulation, the outer loop distributes the computation across the dimension ex while the inner loop iterates over the two remaining dimensions. In Fig. 2, the inner and the outer loops are represented by vertical and horizontal dashed line, respectively.
Fig. 2.
In the line forward projection, voxels that contribute to LOR i are identified by performing an outer and an inner loop. The former iterates over the main dimension for the LOR (as defined in (7)—here ex), while the latter iterates over the two remaining dimensions (only ey is shown on the figure). The computation of the inner loops is done simultaneously in parallel shaders within the GPU. To make computation efficient, the inner loop bounds are increased (see Fig. 3) so that the number of iterations is constant. In a second pass, the outer loop sum is computed by a second shader (bottom).
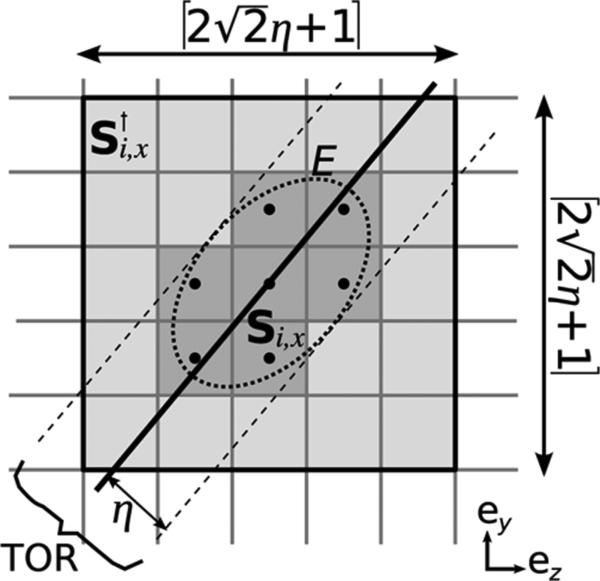
Si,x can be equivalently described by introducing the ellipse E defined by the set of all the points in slice that are at a distance η from LOR i (Fig. 3).
Fig. 3.
Voxel j ∈ Si,x (represented in dark gray) if and only if (yj, zj) is inside ellipse E (9). The size and shape of Si,x vary with i and x, which prevents efficient GPU loops over this set. However, Si,x is a subset of (light + dark gray), whose size is constant. Thus, loops on run efficiently on the GPU.
The computation of the inner loops (8) is distributed over parallel shading units. In the GPU, computation is done by drawing a horizontal line, that is X-pixels long, in a temporary texture while a custom shader is bound (represented in Fig. 2 by a horizontal line at the bottom). The inner loop computation is skipped when Si,x is empty.
The direct computation of the inner loop in (8) is inefficient because the bounds vary with the LOR and the slice index x (Fig. 3). Yet, when conditions (7) are satisfied, the number of iterations in the inner loop is bounded by because the angle between the LOR and the x axis is less than π/4. Conditions (7) can always be met by choosing the main dimension of the LOR to correspond to the outer loop.
Consequently, the inner loop can be performed in exactly iterations provided that an indicator function for TOR Ti is used
| (10) |
The indicator function ITi is efficiently evaluated by the GPU. For such that Si,x is not empty, the inner loop computation can be equivalently expressed as
| (11) |
where is the set of voxels shown on Fig. 3. The voxel set contains Si,x but has a constant number of elements. This technique processes more voxels than strictly needed but keeps the bounds of the inner loop constant.
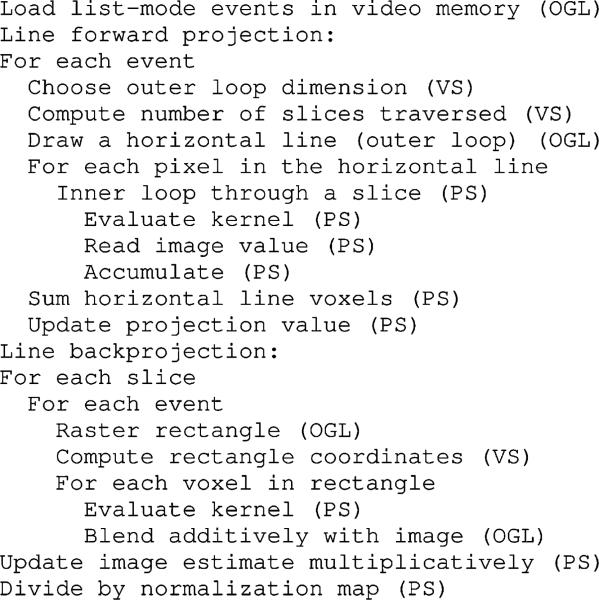
The description of this technique in OpenGL/Cg terms is the following: horizontal lines (shown on the bottom of Fig. 2) are drawn into a temporary 2-D buffer while a 1-D texture is applied onto these lines by mapping the horizontal line endpoints to the original LOR endpoints. The 1-D mapping generates texture look-up coordinates (shown as white dots in Fig. 2). Textures are filtered on-the-fly by custom shaders which performed the inner loop computation described in (11). This method generates the αi,x values and stores them in a temporary 2-D texture. In a second pass, a shader calculates the sum over x (Fig. 5).
Fig 5.
Simplified schematics for one sub-iteration of list-mode 3D-OSEM on the GPU. (OGL) indicates an OpenGL call, (VS) and (PS) denote programs running in the vertex and the pixel shader, respectively.
4) Voxel Identification for Line Backprojection
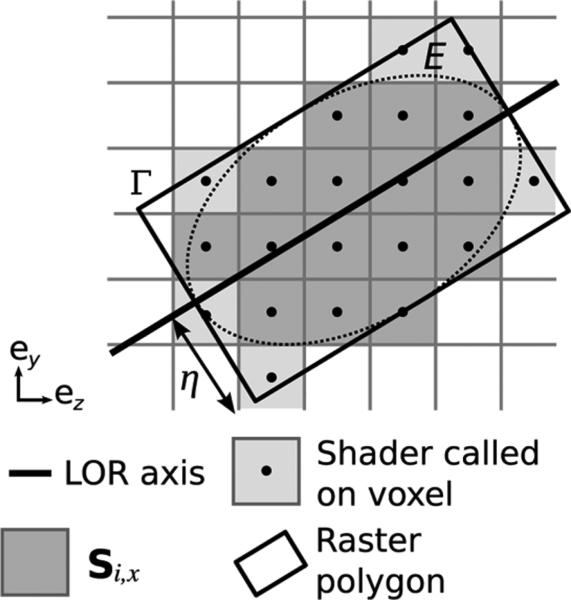
A different technique was used to perform voxel identification in the line backprojection. The GPU rasterizer was used to identify which voxels belong to the TOR and distribute the evaluation of the system response kernel.
The GPU rasterizer can convert a 2-D vectorial polygon Γ into a 2-D pixel image λj. In computer graphics, 2-D polygons come from the projection of 3-D vectorial primitives onto the plane of the display. Pixel j is rastered if its center (yj, zj) belongs to polygon Γ (Fig. 4). We call
| (12) |
the set of such voxels. A pixel shader Φ can be inserted in the graphics pipeline to compute the pixel value λ (i.e., color). This yields the raster equation
| (13) |
Fig. 4.
Pixels whose center (represented by a black dot) is comprised within the raster polygon Γ are selected by the GPU rasterizer (light + dark gray). When the coordinates of the raster polygon Γ are chosen to contain ellipse E, the set of such voxels includes Si,x. Rastering a rectangle provides an efficient way to identify contributing voxels in the backprojection.
GPUs can only raster 2-D vectorial objects, which hinders a straightforward implementation of 3-D line backprojection. Yet, it is possible to circumvent this obstacle by performing the line backprojection slice by slice. Color is used to encode the slice index and process four slices simultaneously. For each slice x and LOR i, a polygon Γ is generated and then rastered into the set of voxels RΓ (12). The best choice for Γ is the smallest rectangle that covers the ellipse E (Fig. 4). In that case, RΓ contains Si,x and all the voxels in Ti are processed. RΓ can be larger than Si,x, so an indicator function is necessary (10).
In OpenGL, rectangles are drawn into a 2-D texture while vertex and pixel shaders are bound, respectively, to define Γ's coordinates and to evaluate the value of the system response kernel at each pixel location. The result of the kernel evaluation, pij, is then assigned to the pixel color register and additively blended with the image texture (Fig. 5).
Identifying voxels using the GPU was implemented distinctly in the line forward and back- projections. In the forward projector, we used a constant-size square to bound the set Si(x) of the voxels that contributed to LOR i (Fig. 3), while in the backprojector we used a variable-size rectangle (Fig. 4). The latter method was more efficient because less voxels were needlessly processed, which was experimentally confirmed: the GPU line backprojector runs 40% faster than the forward projector. Unfortunately, due to GPU architecture constraints, it is not efficient to use the rasterizer in the line forward projector. Another fundamental difference is that parallelization in the forward projection was achieved by running computation simultaneously on multiple slices, while in the backprojection the voxels that belong to the same slice are processed in parallel.
5) Kernel Evaluation
The pixel shaders evaluate the value of the system response kernel. For each LOR, this evaluation is performed twice (once in the forward and once in the back projection) on all the voxels belonging to the associated TOR.
First, the kernel parameters are calculated using LOR and voxel attributes. LOR attributes are defined in the vertex shader and passed to the pixel shader. The voxel attributes are read from the Cg WPOS register.
For the fixed-width Gaussian system response kernel (4), the only parameter needed is the distance dij between LOR i and voxel j. This distance can be computed by forming the orthogonal projection of the voxel center Vj onto the LOR defined by a point Pi and a direction vector ui, i.e.,
| (14) |
This computation is fast because hardwired GPU functions for dot product and norm are used.
Following the calculation of the parameter variables, the kernel value pij for LOR i and voxel j is evaluated. The kernel evaluation can use texture look-ups and arithmetic functions such as exponentials (4), powers and linear interpolation. Texture lookups are useful, for example, to read out the coefficients of splines functions, which represent one parameter of the system response kernel. The kernel value is only computed when needed. This approach allows for implementation of arbitrary shift-varying kernels. The high-level shading language Cg [27] provides an important library of mathematical functions that are applicable to both scalar and vectorial floating-point registers.
6) Vector Data Update
The last stage of the projection consists of updating the data vector (either a volumetric image or a set of list-mode projections).
For the line forward projector, the partial sums (8) are summed (outer loop)
| (15) |
The resulting values fi are then inverted and written back to the projection data texture in preparation of the line backprojection.
In the line backprojector, the pixel shader called by the rasterizer directly writes to the correct voxel location. We enabled additive blending to add the shader output to the previous voxel value (13). Additive blending is performed in dedicated 32-bit floating-point units. The last step in OSEM consists of multiplying the update image by the previous volumetric image and dividing it by the sensitivity map (1). This is done by running the volumetric image through a pixel shader.
E. Evaluation: Simulated Data
1) High-Resolution CZT PET System
This work used data provided by a simulated small animal PET system design based on cross-strip 3-D CZT detectors that are under development in our laboratory [28], [29]. In this setup, the tangential interaction coordinate was determined by a pattern of 1 mm spaced anode strips; the axial coordinate, by the ratio between the recorded anode to cathode pulse height; and the depth-of-interaction coordinate, by a pattern of 5 mm spaced cathode strips. The 4 × 4 × 0.5 cm3 detector slabs were arranged edge-on with respect to incoming photons, in a square box geometry, with field-of-view (FOV) 8 × 8 × 8 cm3 [Fig. 6(a)]. Events were positioned with 1 mm resolution and an interaction depth resolution of 5 mm. The system has more than 8 billion LORs, which motivates list-mode processing.
Fig. 6.
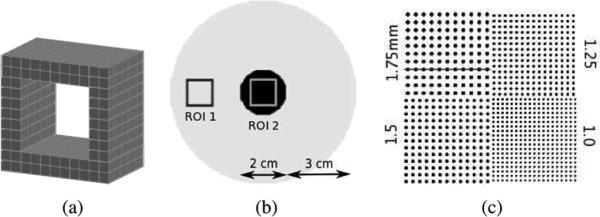
(a) 8 × 8 × 8 cm3 FOV small animal PET system based on 1 mm resolution, 3-D positioning CZT detectors. (b) Rod phantom used for contrast recovery comparison. (c) Sphere phantom used for resolution evaluation.
The Monte-Carlo package GATE was used to simulate the acquisition of two phantoms. To keep the simulation as realistic as possible, the output from the GATE hits file was used to position each photon event. Due to the low Z and low density of the CZT material, incoming photon events often interact multiple times in the detectors. Such photon events were positioned at the estimated location of the first interaction and binned to the nearest 1 × 5 × 1 mm3 bin. Consistent with measurements [29], we modeled the energy resolution by adding Gaussian noise with FWHM , where E is the energy of the single interaction in keV.
2) Phantoms and Reconstruction Protocol
A phantom comprising two large concentric rods (1 cm and 4 cm diameter) of activity [Fig. 6(b)] was simulated to assess the quantitative contrast recovery of the GPU-based reconstruction independently of the system resolution. Two regions of interest (ROI 1 and ROI 2) were defined in the 1 cm and the 4 cm radius rods as shown on Fig. 6(b). The activities in each rod were set up to create a 10:1 contrast between ROI 1 and ROI 2. The contrast C was measured on reconstructed images as a function of iteration
| (16) |
where and are the average image intensities over each ROI. Spatial variance in ROI 2 was also computed to approximate image noise N. Our figure of merit for noise in the images is
| (17) |
where is the spatial variance in ROI 2. Photons that scattered in the object as well as random coincidences were not included in the reconstruction to obtain the reconstructed contrast in an ideal case.
The phantom data were reconstructed using list-mode 3D-OSEM on a CPU and a GPU architecture. On the CPU, we used an inhouse C++ reconstruction package that supports arbitrary system response kernels. On the GPU, we used the novel technique described in Section II-D. For both platforms, the FWHM of the fixed-width Gaussian kernel was chosen to be 1 mm, a value equal to the detector pitch. The computation of the sensitivity image Nj (2) followed the same procedure for both reconstructions.
A high-resolution sphere phantom [Fig. 6(c)] was simulated to look at the effects of the GPU reconstruction on image resolution. The phantom comprised four quadrants of spheres, all in one central plane, placed in air. The spheres were 1, 1.25, 1.5, and 1.75 mm in diameter. Their centers were placed twice their diameter apart. Twenty million counts were acquired. The activity was placed all the way up to the edge of the 8 × 8 × 8 cm3 system FOV.
Finally, to provide a global measure of the deviation between images produced using GPU and CPU list-mode 3D-OSEM, we measured the average relative deviation
| (18) |
at different subiterations for both phantoms.
F. Experimental Preclinical Data
1) Vista DR PET
The GEHC eXplore Vista DR [30] is a preclinical PET scanner with two depth layers of 1.55 mm pitch crystals. The useful field-of-view is 6.7 cm transverse and 4.6 cm axial. Photons can be recorded by 6 084 crystal elements, providing 28.8 million LORs. Data is acquired in 3-D and stored in LOR histograms. We performed two phantom studies (hot rod and cold rod phantoms) to evaluate the performance of the GPU reconstruction on a real dataset.
2) Hot and Cold Rod Phantom
The hot rod phantom (Micro Deluxe phantom, Data Spectrum, Durham, NC) was filled with 110 μCi of 18F and imaged for 20 min. The cold rod phantom was filled with 200 μCi of 18F and imaged for 20 min. The rod diameters were 1.2, 1.6, 2.4, 3.2, 4.0 and 4.8 mm. The spacing between the centers was twice the diameter. For both experiments, data was collected in histogram-mode.
Reconstruction was performed on a GPU using 3D-OSEM with Gaussian kernel (1.4 mm FWHM) and on a CPU using FORE + 2D—OSEM, included with the Vista DR installation. Thirty-two subsets were formed and two iterations were run, the recommended value for the system. For 3D-OSEM, we formed a random partition by splitting the LORs into 32 subsets. We also modified our GPU-based list-mode reconstruction package to handle histogram-mode data by adding the capability to assign a projection value to each LOR.
G. Processing Time
The processing time for each reconstruction method was measured. CPU-based 3D-OSEM was benchmarked on a high-end Intel Core 2 Duo E6600 (2.4 GHz). The GPU used for the same task was the NVIDIA GeForce 8800GT GPU. The image size was 160 × 160 × 160 voxels for the simulated datasets and 175 × 175 × 60 voxels for Vista DR datasets. The measured time includes Fourier rebinning for FORE + 2D—OSEM. A 1 mm FWHM Gaussian kernel with a TOR cutoff of η = 1 mm was used for 3D-OSEM in the first experiment. In the second one, we chose a 1.1 mm FWHM kernel with a TOR η = 0.8 mm cutoff. Reconstruction time is provided for one million LORs processed (back- and forward projected).
III. Results
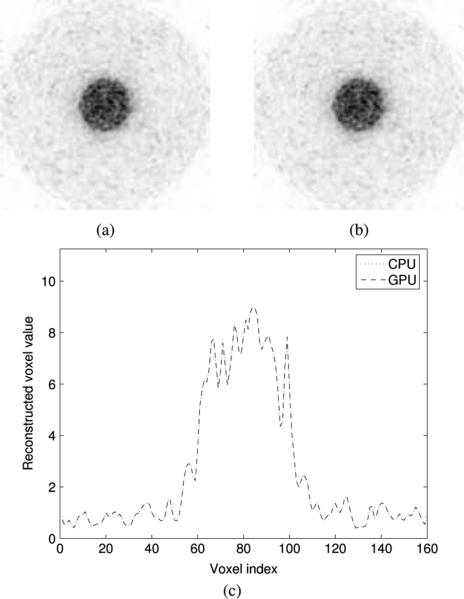
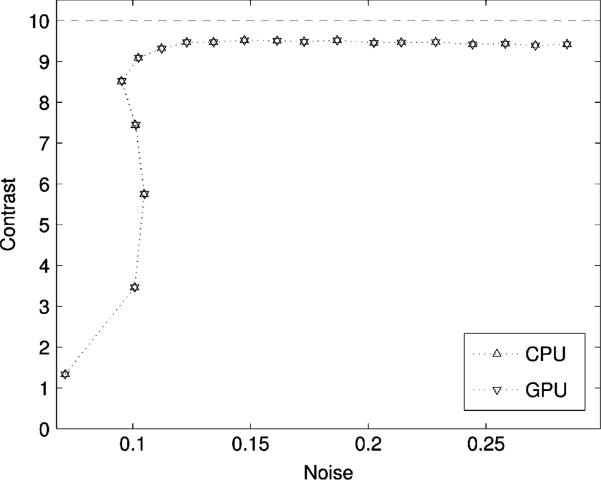
No significant difference was observed between the images generated using list-mode 3D-OSEM on the GPU and the CPU for the simulated rod contrast phantom (Fig. 7). This was further confirmed by a horizontal profile through the center of both images [Fig. 7(c)]. The contrast-noise trade-off at different subiterations was neither affected by the mathematical reformulation of line projections nor by the use of the GPU as a reconstruction platform (Fig. 8). The contrast, measured between ROI 1 and ROI 2, converged to 9.426 for the GPU and 9.428 for the CPU. Noise was virtually identical on both reconstruction (0.28440 versus 0.28435 rms).
Fig. 7.
Reconstruction of the rod phantom using list-mode 3D-OSEM on (a) the GPU and (b) the CPU. The rod radius is 1 and 4 cm [Fig. 6(b)]. The activity concentration ratio between the two rods is 10:1. (c) Horizontal profile through the center of both images.
Fig. 8.
Contrast-noise trade-off at different sub-iterations for the rod phantom (Fig. 7). Contrast is evaluated between ROI 1 and ROI 2 [Fig. 6(b)]. Noise is approximated by the spatial standard deviation in ROI 1.
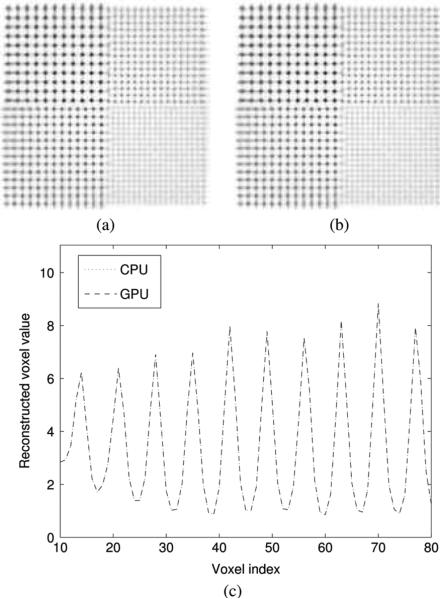
Inspection of the sphere phantom images revealed no significant difference between the two implementations (Fig. 9). Neither did the profile through one row of 1.75 mm spheres. The reconstructed sphere size was evaluated by fitting a mixture of Gaussians to 1-D profiles through the center of the 1.75 mm spheres. The sphere size on images reconstructed with 3D-OSEM on both GPU and CPU is 1.36 ± 0.32 mm. The difference in the reconstructed sphere size between the GPU and CPU implementations was on the order of 10–5 mm.
Fig. 9.
Sphere phantom in air reconstructed with 20 iterations of list-mode 3D-OSEM on (a) the GPU and (b) the CPU, using Gaussian kernel with 1 mm FWHM. The spheres extend to the edge of the 8 × 8 × 8 cm3 FOV and their size is 1, 1.25, 1.5, and 1.75 mm. The spacing between the centers is twice the diameter. (c) Profile through the 1.75 mm spheres for both reconstructions.
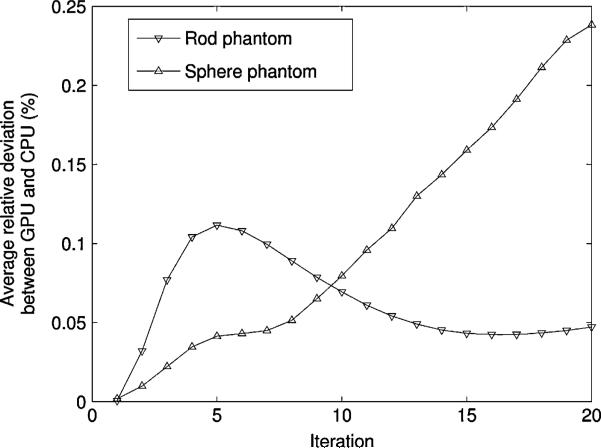
The global difference between images reconstructed using the GPU and the CPU was quantitatively evaluated by measuring the average relative deviation (18). The overall deviation ε between the two implementations was below 0.25% at 20 iterations. It was lower for the rod phantom than for the sphere phantom (Fig. 10).
Fig. 10.
Average relative deviation between the GPU and the CPU versions of list-mode 3D-OSEM for the rod phantom and the sphere phantom.
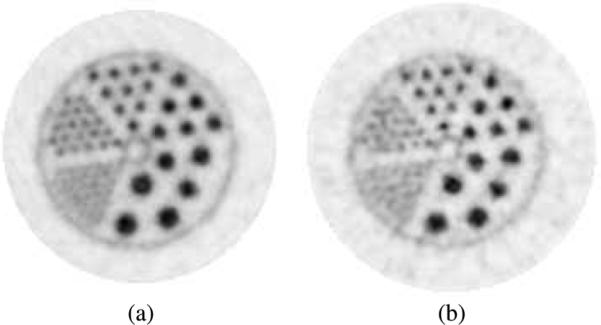
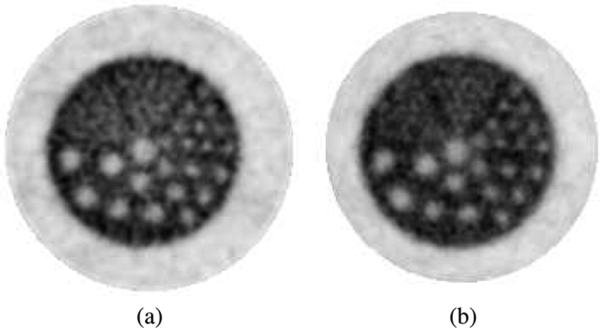
The GPU reconstruction package was benchmarked against an existing standard reconstruction package on high-resolution datasets acquired on the Vista DR. A comparison of GPU histogram-mode 3D-OSEM against CPU FORE + 2D—OSEM for the hot rod (Fig. 11) and the cold rod (Fig. 12) show visual differences. All of the 19 1.6 mm rods were resolved with when 3D-OSEM was used, compared to only ten with FORE + 2D—OSEM. The improvement is due to the limited potential of FORE for resolution recovery [6], [7], and not difference in processing between GPU and CPU.
Fig. 11.
Micro Deluxe hot rod phantom, acquired on the Vista DR system and reconstructed with (a) histogram-mode 3D-OSEM with 1.4 mm-FWHM Gaussian kernel on the GPU and (b) using FORE+2D-OSEM provided with the system. A single slice is shown. The rods diameters are 1.2, 1.6, 2.4, 3.2, 4.0, and 4.8 mm. Spacing is twice the diameter.
Fig. 12.
Micro Deluxe cold rod phantom, acquired on the Vista DR system and reconstructed with histogram-mode 3D-OSEM with (a) 1.4 mm FWHM Gaussian kernel on the GPU and also (b) using the FORE + 2D—OSEM provided with the Vista DR system. A single slice is shown. The rods diameters are 1.2, 1.6, 2.4, 3.2, 4.0, and 4.8 mm. Spacing between centers is twice the diameter.
The processing time was also measured for various implementations (Table I). The quoted time is in seconds per million LORs processed (back- and forward projected). For list-mode 3D-OSEM on the simulated PET system, the GPU reconstruction was 51 times faster than the CPU's. 3D-OSEM on the GPU was 2.3 times slower than CPU FORE + 2D—OSEM, but potentially more accurate. The computation of the sensitivity map (2) took 7 min 20 s for the simulated dataset and 1 min 14 s for the real dataset on the Vista DR.
TABLE I.
Reconstruction Time (Seconds Per Million LORs Processed)
| Algorithm | Recon. time (s) |
|---|---|
| GPU 3D-OSEM (160×160×160) | 8.8 |
| CPU 3D-OSEM (160×160×160) | 449 |
| GPU 3D-OSEM (175×175×61) | 5.3 |
| CPU FORE+2D-OSEM (175×175×61) | 2.3 |
IV. Discussion
Despite different projection formulations and hardware architecture, the GPU and the CPU versions of list-mode 3D-OSEM generated virtually identical images. Fig. 10 indicates that globally, at 20 iterations, the relative deviation ε between the gold standard CPU implementation and its GPU-based counterpart was, on average, on the order of 0.25%. This level of error is acceptable for PET and well beyond the accuracy needed. For example, for a scan with 100 million counts, a 100 × 100 × 100 voxels image will have at best 10% variance per voxel (based on Poisson statistics). The deviation between GPU and CPU reconstruction was also smaller for low resolution phantoms such as the rod phantom.
The agreement between the GPU and the CPU implementation was validated both in terms of the quantitative voxel values (Fig. 7) and the ability to resolve small features (Fig. 9). The contrast trade-off and the reconstructed sphere size were identical.
The computation of the distance dij between voxel j and LOR i (14) is the leading cause of error on the GPU. The error in dij is around 8.6 × 10⁻⁶ voxel RMS. This error might seem insignificant, however dij is computed and compared to the cutoff η 10 billion times per subiteration. As a result of these errors, 0.002% of the TOR voxels are misclassified. The difference in dij values stems from minuscule errors in the output of floating-point operations on graphics hardware.
Other less significant sources of deviation between GPU and CPU results occur during the evaluation of the kernel. The numerical values produced by GPU's hardwired functions, such as exponentials, are slighlty different from those produced by the CPU math libraries.
The Vista DR study shows that the GPU reconstruction performs well with data measured on an existing commercial system. We compared GPU 3D-OSEM with a Gaussian kernel to the standard reconstruction algorithm installed on this system, FORE + 2D—OSEM, in order to show that the GPU reconstruction produces acceptable results. The quality of the images meets our expectations and—if not exceeds—matches that of FORE + 2D—OSEM reconstruction.
As mentioned in Table I, FORE + 2D—OSEM on a CPU is 2.3 times faster than 3D-OSEM on the GPU, but potentially not as accurate because FORE uses several approximations to rebin the 28.8 million LORs into 1.4 million “effective” 2-D LORs (61 2-D sinograms with 175 spatial locations and 128 angles [30]). While FORE + 2D—OSEM trades off image quality for reconstruction speed, a GPU implementation does not pay a significant penalty for the acceleration.
It is also worth noting that the processing time for FORE + 2D—OSEM per million “effective” LORs is 47.3 s, which is 9 times longer than that for GPU 3D-OSEM. In addition, the rebinned 2-D LORs involve a smaller number of voxels because they are shorter and they do not incorporate a broad system kernel. The TORs that were used in Table I for 3D-OSEM involved on average 10 times more voxels than the LORs used for 2D-OSEM, the volumetric image size being equal. Thus, 3D-OSEM would run around 10 times faster if a narrow (i.e., η small) TOR was used.
A few other qualitative comments can be made. Concerning the hot rod phantom (Fig. 11), all of the 1.6 mm rods are clearly resolved for the GPU-based reconstruction with Gaussian kernel. In contrast, some the 1.6 mm rods at the edge of the FOV are not resolved on the FORE + 2D—OSEM image. The background noise is also lower by 27%. For the cold rod phantom (Fig. 12), we observed that 3D-OSEM provided greater uniformity throughout the FOV as well as higher contrast.
GPUs and CPUs both aims at executing the workload as fast as possible but they use different strategies to achieve that goal. CPUs excel at executing one long thread of computation, while GPUs are efficient at running thousands of independent threads. Therefore, it is necessary to adopt different reconstruction strategies on each platform. For example, Siddon's algorithm [31] is well suited to CPU architectures because it requires voxels to be processed sequentially, in long threads of computation. In kernel projection techniques, the SRM is evaluated at each voxel independently, so the computation can be broken down into many small threads. Besides, kernel projection techniques produce better images because Siddon's algorithm is based on the perfect line integral model which does not include the contribution of voxels that are off of the LOR axis.
V. Conclusion
The GPU is becoming increasingly useful as a computing platform for medical image reconstruction. Approaches based on texture mapping were applied successfully to parallel-beam [21] and cone-beam X-ray CT [24] and are applicable to PET reconstruction when the data is processed in a sinogram. However, list mode or histogram mode require a radically different approach.
We showed that GPUs can accelerate the line back- and forward projections for list-mode and histogram-mode 3D-OSEM. In this scheme, each LOR can be described by two arbitrary endpoints and incorporate any shift-varying kernel that models the system response blurring. Our technique can also reconstruct sinogram data, but a texture mapping approach is more efficient in this case.
This novel use of the GPU in reconstruction is 51 times faster than the same algorithm implemented on a CPU with virtually identical image quality and quantitative accuracy. High-resolution, time-of-flight and dynamic PET are three applications that could immediately benefit from the GPU-based line projectors.
The ability to incorporate any system response kernel in the reconstruction was demonstrated using a fixed-width Gaussian kernel. More accurate modelling will be researched as it will allow for greater quantitative accuracy in the reconstructed images.
Acknowledgment
The authors would like to thank S. Keren at Stanford University for help acquiring data on the Vista system, the NVIDIA corporation for providing research support, and L. Boos and C. Pie for help preparing the manuscript.
This work was supported in part by the National Institutes of Health (NIH) under Grants R01CA119056, R33EB003283, and R01CA120474, and fellowships from the Stanford Bio-X program and the NVIDIA Corporation.
Contributor Information
Guillem Pratx, Department of Radiology, Molecular Imaging Program, Stanford University, Stanford, CA 94305 USA..
Garry Chinn, Department of Radiology, Molecular Imaging Program, Stanford University, Stanford, CA 94305 USA..
Peter D. Olcott, Department of Radiology, Molecular Imaging Program, Stanford University, Stanford, CA 94305 USA..
Craig S. Levin, Department of Radiology, Molecular Imaging Program, Stanford University, Stanford, CA 94305 USA.
References
- 1.Brasse D, Kinahan PE, Clackdoyle R, Defrise M, Comtat C, Townsend D. Fast fully 3-D image reconstruction in PET using planograms. IEEE Trans. Med. Imag. 2004 Apr.23(4):413–425. doi: 10.1109/TMI.2004.824231. [DOI] [PubMed] [Google Scholar]
- 2.Rahmim A, Cheng JC, Blinder S, Camborde ML, Sossi V. Statistical dynamic image reconstruction in state-of-the-art high-resolution PET. Phys. Med. Biol. 2005 Oct.50:48874912. doi: 10.1088/0031-9155/50/20/010. [DOI] [PubMed] [Google Scholar]
- 3.Hudson H, Larkin R. Accelerated image reconstruction using ordered subsets of projection data. IEEE Trans. Med. Imag. 1994 Dec.13(4):601–609. doi: 10.1109/42.363108. [DOI] [PubMed] [Google Scholar]
- 4.Shepp LA, Vardi Y. Maximum likelihood reconstruction for emission tomography. IEEE Trans. Med. Imag. 1982 Oct.1(2):113–122. doi: 10.1109/TMI.1982.4307558. [DOI] [PubMed] [Google Scholar]
- 5.Carson RE, Barker C, Liow JS, Johnson CA. Design of a motion-compensation OSEM list-mode algorithm for resolution-recovery reconstruction for the HRRT. IEEE Nucl. Sci. Symp. Med. Imag. Conf. Rec. 2003:3281–3285. [Google Scholar]
- 6.Qi J, Leahy RM, Cherry SR, Chatziioannou A, Farquhar TH. High-resolution 3D bayesian image reconstruction using the microPET small-animal scanner. Phys. Med. Biol. 1998 Jul.43:1001–1013. doi: 10.1088/0031-9155/43/4/027. [DOI] [PubMed] [Google Scholar]
- 7.Herraiz JL, Espaa S, Vaquero JJ, Desco M, Udas JM. FIRST: Fast iterative reconstruction software for (PET) tomography. Phys. Med. Biol. 2006 Sep.51:4547–4565. doi: 10.1088/0031-9155/51/18/007. [DOI] [PubMed] [Google Scholar]
- 8.Defrise M, Kinahan P, Townsend D, Michel C, Sibomana M, Newport DF. Exact and approximate rebinning algorithms for 3-D PET data. IEEE Trans. Med. Imag. 1997 Apr.16(2):145–158. doi: 10.1109/42.563660. [DOI] [PubMed] [Google Scholar]
- 9.Liu X, Comtat C, Michel C, Kinahan PE, Defrise M, Townsend D. Comparison of 3-D reconstruction with 3D-OSEM, and with for FORE + OSEM for PET. IEEE Trans. Med. Imag. 2001 Aug.20(8):804–814. doi: 10.1109/42.938248. [DOI] [PubMed] [Google Scholar]
- 10.Huesman RH. List-mode maximum-likelihood reconstruction applied to positron emission mammography (PEM) with irregular sampling. IEEE Trans. Med. Imag. 2000 May;19(5):532–537. doi: 10.1109/42.870263. [DOI] [PubMed] [Google Scholar]
- 11.Reader AJ, Erlandsson K, Flower MA, Ott RJ. Fast accurate iterative reconstruction for low-statistics positron volume imaging. Phys. Med. Biol. 1998 Jul.43:1001–1013. doi: 10.1088/0031-9155/43/4/012. [DOI] [PubMed] [Google Scholar]
- 12.Reader AJ, Ally S, Bakatselos F, Manavaki R, Walledge RJ, Jeavons AP, Julyan PJ, Zhao S, Hastings DL, Zweit J. One-pass list-mode EM algorithm for high-resolution 3-D PET image reconstruction into large arrays. IEEE Trans. Nucl. Sci. 2002 Jun.49(3):693–699. [Google Scholar]
- 13.Parra L, Barrett HH. List-mode likelihood: EM algorithm and image quality estimation demonstrated on 2-D PET. IEEE Trans. Med. Imag. 1998 Apr.17(2):228–235. doi: 10.1109/42.700734. [DOI] [PMC free article] [PubMed] [Google Scholar]
- 14.Rahmim A, Lenox M, Reader A, Michel C, Burbar Z, Ruth TJ, Sossi V. Statistical list-mode image reconstruction for the high resolution research tomograph. Phys. Med. Biol. 2004 Aug.49:4239–4258. doi: 10.1088/0031-9155/49/18/004. [DOI] [PubMed] [Google Scholar]
- 15.Alessio A, Kinahan P, Lewellen T. Modeling and incorporation of system response functions in 3-D whole body PET. IEEE Trans. Med. Imag. 2006 Jul.25(7):828–837. doi: 10.1109/tmi.2006.873222. [DOI] [PubMed] [Google Scholar]
- 16.Panin V, Kehren F, Michel C, Casey M. Fully 3D pet reconstruction with system matrix derived from point source measurements. IEEE Trans. Med. Imag. 2006 Jul.25(7):907–921. doi: 10.1109/tmi.2006.876171. [DOI] [PubMed] [Google Scholar]
- 17.Pratx G, Chinn G, Olcott PD, Habte F, Levin CS. Accelerated list-mode 3D-OSEM reconstruction for PET on a graphics processing unit. J. Nucl. Med. Abstract Book. 2006 May;47(5):183. [Google Scholar]
- 18.Owens JD, Luebke D, Govindaraju N, Harris M, Krger J, Lefohn AE, Purcell TJ. A survey of general-purpose computation on graphics hardware. Computer Graphics Forum. 2007;26(1):80–113. [Google Scholar]
- 19.Cabral B, Cam N, Foran J. Accelerated volume rendering and tomographic reconstruction using texture mapping hardware. Symp. Volume Visualizat. 1994:91–98. [Google Scholar]
- 20.Chidlowy K, Mollerz T. Rapid emission tomography reconstruction. Vol. Graph. 2003:15–26. [Google Scholar]
- 21.Xu F, Mueller K. Accelerating popular tomographic reconstruction algorithms on commodity PC graphics hardware. IEEE Trans. Nucl. Sci. 2005 Jun.52(3):654–663. [Google Scholar]
- 22.Kole J, Beekman F. Evaluation of accelerated iterative X-ray CT image reconstruction using floating point graphics hardware. Phys. Med. Biol. 2006;51:875–889. doi: 10.1088/0031-9155/51/4/008. [DOI] [PubMed] [Google Scholar]
- 23.Wang Z, Han G, Li T, Liang Z. Speedup OS-EM image reconstruction by PC graphics card technologies for quantitative SPECT with varying focal-length fan-beam collimation. IEEE Trans. Nucl. Sci. 2005 Oct.52(5):1274–1280. doi: 10.1109/TNS.2005.858231. [DOI] [PMC free article] [PubMed] [Google Scholar]
- 24.Xu F, Mueller K. Real-time 3D computed tomographic reconstruction using commodity graphics hardware. Phys. Med. Biol. 2007;52:3405–3419. doi: 10.1088/0031-9155/52/12/006. [DOI] [PubMed] [Google Scholar]
- 25.Qi J. Calculation of the sensitivity image in list-mode reconstruction for PET. IEEE Trans. Med. Imag. 2006 Oct.53(5):2746–2751. [Google Scholar]
- 26.Alession AM, Kinahan PE. Improved quantitation for PET/CT image reconstruciton with system modeling and anatomical priors. Med. Phys. 2006 Nov.33(11):4095–4103. doi: 10.1118/1.2358198. [DOI] [PubMed] [Google Scholar]
- 27.Mark W, Glanville R, Akeley K, Kilgard M. Cg: A system for programming graphics hardware in C-like language. ACM Trans. Graphic. 2003;22:896–907. [Google Scholar]
- 28.Levin CS, Habte F, Foudray AMK, Zhang J, Chinn G. Impact of high energy resolution detectors on the performance of a PET system dedicated to breast cancer imaging. Physica Med. 2006;21:28–34. doi: 10.1016/S1120-1797(06)80020-7. [DOI] [PubMed] [Google Scholar]
- 29.Levin CS. New imaging technologies to enhance the molecular sensitivity of positron emission tomography. Proc. IEEE. 2008 Apr.96(3):439–467. [Google Scholar]
- 30.Wang Y, Seidel J, Tsui BMW, Vaquero JJ, Pomper MG. Performance evaluation of the GE healthcare eXplore Vista dual-ring small-animal PET scanner. J. Nucl. Med. 2006;47:1891–1900. [PubMed] [Google Scholar]
- 31.Siddon RL. Fast calculation of the exact radiological path for a three-dimensional CT array. Med. Phys. 1985 Mar.12(2):252–255. doi: 10.1118/1.595715. [DOI] [PubMed] [Google Scholar]


