

SUMMARY
Genomic imprinting leads to preferred expression of either the maternal or paternal alleles of a subset of genes. Imprinting is essential for mammalian development and its deregulation causes many diseases. However, the functional relevance of imprinting at the cellular level is poorly understood for most imprinted genes. We used Mosaic Analysis with Double Markers (MADM) in mice to create uniparental chromosomal disomies (UPDs) and to visualize imprinting effects with unprecedented single cell resolution. While Chr.12 UPD did not produce detectable phenotypes, Chr.7 UPD caused highly significant paternal growth dominance in the liver and lung but not the brain or heart. A single gene on Chr.7, encoding the secreted Insulin-like growth factor 2 (IGF2), accounts for most of the paternal dominance effect. Mosaic analyses implied additional imprinted loci on Chr. 7 acting cell-autonomously to transmit the IGF2 signal. Our study reveals chromosome- and cell-type specificity of genomic imprinting effects.
Keywords: MADM, genomic imprinting, genetic mosaic, chromosomal disomy, UPD, Igf2
INTRODUCTION
In diploid organisms, most genes are expressed from both parental chromosomes. However, a subset of genes in mammals and plants are subject to a unique mode of regulation called genomic imprinting (Barlow, 2011; Bartolomei and Ferguson-Smith, 2011), whereby either the maternal or paternal allele is preferentially silenced. Genomic imprinting is essential for embryonic development in mammals (Barton et al., 1984; McGrath and Solter, 1984; Surani et al., 1984). Deregulation of imprinting has been implicated in many diseases, including cancer and brain disorders such as Angelman and Prader-Willi syndromes (Feinberg, 2007; Mabb et al., 2011; Nicholls and Knepper, 2001). Despite the importance of imprinting in controlling prenatal growth, behavior, and metabolism of the whole organism (Ferguson-Smith, 2011; Wilkinson et al., 2007), the functional relevance of imprinting at the cellular level is poorly understood for most genes.
The analysis of mice carrying uniparental disomy (UPD) of whole chromosomes (somatic cells with two copies of either the maternal or paternal chromosome), as well as duplication and deficiency of defined chromosomal regions, has been fundamental for the identification and mapping of imprinted chromosomal regions and loci in the mouse genome (Cattanach and Kirk, 1985; Williamson CM, 2012). However, phenotypic analysis of mice with UPD, deletions and duplications is limited due to the lack of assays with cellular resolution. Only very recently, the analysis of paternally or maternally inherited mutations with concurrent cell marker labeling has begun to reveal tissue specific physiological functions for certain imprinted genes (Ferron et al., 2011; Garfield et al., 2011). Here, we use the MADM (Mosaic Analysis with Double Markers) system (Zong et al., 2005) to probe the effects of genomic imprinting at the whole chromosome level and with single cell resolution across many tissues and cell types in the mouse.
RESULTS AND DISCUSSION
MADM Can Assess Genomic Imprinting Phenotypes with Single Cell Resolution
MADM can generate Cre/LoxP-dependent mitotic recombination between homologous chromosomes, and at the same time label genetically defined progeny with distinct fluorescent markers. Specifically, mitotic recombination at G2 phase followed by X-segregation of recombined chromosomes can produce fluorescently labeled progeny with chromosomal compositions distinct from parental cells (Zong et al., 2005). Even for chromosomes that do not harbor any mutations, G2-X events produce near complete UPD for a particular chromosome carrying the MADM cassettes (Figures 1A and S1A). Consequently, imprinted genes located on such a chromosome will be homozygosed and either overexpressed by a factor of two or not expressed depending on their imprinting status. Further, cells with unipaternal disomy are fluorescently labeled with green fluorescent protein (GFP) and sister cells with unimaternal disomy with tandem dimer Tomato (tdTomato), or vice versa (Figures 1A and S1A). Thus, MADM provides in principle a unique experimental platform to systematically assay the consequences of genomic imprinting at the whole chromosome level by visualizing the single cell phenotypes of defined UPDs in genetic mosaic animals.
Figure 1. MADM Reveals a Chromosome-Specific Imprinting Phenotype with Single Cell Resolution.

(A) G2-X MADM events result in near complete uniparental chromosomal disomy labeled in green (PP) and red (MM) fluorescent colors, respectively.
(B) Chromosomal location of Hipp7 (Chr.7) and John12 (Chr.12) genomic loci with inserted MADM cassettes.
(C and D) P21 livers from MADM-7GT/TG;Hprt-Cre+/- mice with uniparental Chr.7 disomy.
(E and F) P21 livers from MADM-12GT/TG;Hprt-Cre+/- mice with uniparental Chr.12 disomy.
Depending on whether the GT and TG alleles were introduced from the father (blue) or the mother (pink), unipaternal disomy cells are labeled in green (C and E) or in red (D and F) as indicated. Scale bar: 200μm.
(G) Quantification of the PP/MM ratios of liver UPD hepatocytes in cryosections in P21 MADM-7GT/TG;HprtCre/+ [MADM-7] and MADM-12GT/TG;HprtCre/+ [MADM-12; n=16 from 3 individual male mice). For detailed methods of quantifying the PP/MM ratio in MADM-7 P21 liver, see also Figure 4 and Figure S4.
See also Figure S1.
Chr. 7 but not Chr. 12 UPD Leads to Drastic Paternal Growth Dominance in the Liver
To test the potential effect of imprinted genes on specific chromosomes, we produced MADM cassettes for mouse Chr. 7, since mouse Chr.7 is most enriched for imprinted genes, and harbors several well studied clusters of imprinted genes (Williamson CM, 2012). We inserted MADM cassettes near the centromere of Chr.7 (Figures 1B and S1B; see Experimental Procedures for details) using a similar knockin strategy as previously described (Hippenmeyer et al., 2010). We then used a ubiquitous Cre driver (Hprt-Cre) to induce Chr.7 UPD across the whole animal in a mosaic fashion. When using GFP to label unipaternal disomy cells (PP), we found a massive expansion of green hepatocytes in the liver (Figure 1C and 1G) when compared with unimaternal disomy cells (MM) labeled by tdTomato. In a separate experiment in which we switched colors of UPD cells (tdTomato for PP and GFP for MM), we found that red hepatocytes expanded as a consequence of the Chr.7 UPD (Figure 1D). Thus, unipaternal disomy of Chr. 7 leads to a massive expansion of hepatocytes when compared with unimaternal Chr.7 disomy.
We also created MADM cassettes near the centromere of mouse Chr. 12 for mosaic analysis of candidate genes on that chromosome (Figures 1B and S1C). Hprt-Cre together with the MADM transgenes on Chr. 12 also produced Chr.12 UPD cells in a mosaic fashion across the whole animal and including the liver. In contrast to Chr. 7 UPD, hepatocytes carrying either paternal or maternal Chr.12 UPD appeared similar in number (Figures 1E, 1F and 1G).
Imprinting Effects in Chr. 7 UPD Display Cell-type Specificity
We extended our analysis to additional tissues and cell types with mosaic Chr.7 or Chr.12 UPD. Qualitative (Figures 2A-C and 2E-G) and quantitative (Figure 2I) evaluation of hippocampal CA1 pyramidal neurons and cerebellar Purkinje cells in the brain, as well as cardiomyocytes in the heart, revealed no significant differences in cell number regardless of whether these cells carried unipaternal or unimaternal disomies for Chr.7 or Chr.12. By contrast, lung epithelia displayed a marked expansion of cells with unipaternal Chr.7 but not Chr.12 UPD (Figures 2D and 2H), similar to liver hepatocytes. We conclude that MADM-induced Chr.7 but not Chr.12 UPD results in cell-type specific expansion with unipaternal disomy.
Figure 2. Cell-Type Specific Paternal Dominance of Chr.7 UPD.
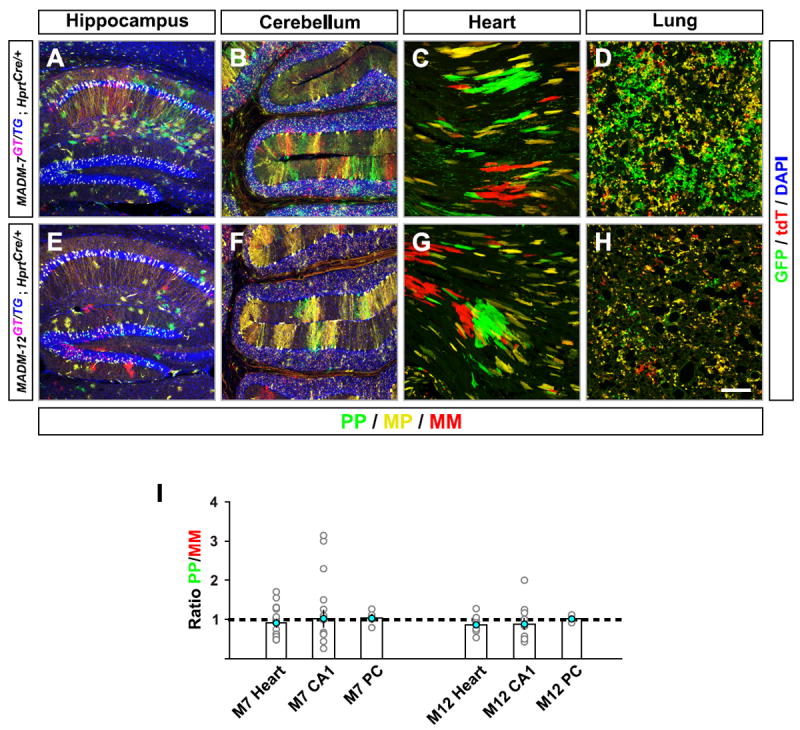
(A-H) MADM labeling of Chr.7 (A-D) and Chr.12 (E-H) in the hippocampus (A and E), cerebellum (B and F), heart (C and G), and lung (D and H) at P21. PP cells are green and MM cells are red. DAPI stainings (blue) outline the general organization of the hippocampus (A and E) and cerebellum (B and F). Scale bar: 200 μm.
(I) Quantification of the ratios of green PP to red MM cells in cryosections: cardiomyocytes in the heart [(n=16 for M7; n=10 for M12) from male animals (n=3 each)], CA1 pyramidal neurons in hippocampus [(n=16 for M7; n=11 for M12) from individual male animals (n=3 each)], Purkinje cells (PC) in cerebellum from entire male half brains (n=4 for M7 and n=3 for M12).
See also Figure S2.
To exclude the possibility that the MADM markers on Chr.7 themselves were selectively silenced due to imprinting, we generated mice containing constitutively expressed, reconstituted GFP (Hipp-7GG/+) and tdTomato (Hipp-7TT/+) markers, respectively, and intercrossed them to generate Hipp-7GG/TT animals. All cells in every organ analyzed at postnatal day (P) 21 in Hipp-7GG/TT expressed both markers uniformly (Figure S2). Therefore, the unequal ratio of hepatocytes and lung epithelia with unipaternal over unimaternal Chr.7 UPD did not result from selective silencing of one marker in putative GFP+/tdTomato+ cells but reflects an imprinting phenotype whereby cells with unipaternal disomy have a growth advantage over unimaternal disomy.
Paternal Growth Advantage in Chr. 7 UPD Commences During Embryogenesis
What is the developmental origin of cell number expansion in unipaternal Chr.7 disomy? To address this question, we carried out a developmental time course analysis focusing on liver hepatocytes with MADM-induced Chr.7 UPD. At embryonic day (E) 12, no expansion of the hepatocyte population with unipaternal disomy was apparent (Figure 3A). However, four days later at E16, unipaternal Chr.7 disomy cells already outnumbered unimaternal Chr.7 disomy cells (Figure 3B). We validated this result by clonal analysis using tamoxifen-induced CreER (Figures 3J and 3K). In liver clones induced at E12, the size of clone harboring PP cells already exceeded that of MM by more than 2 fold by E16. These findings are consistent with previous reports showing that the embryonic liver has a remarkable capacity for growth (Stanger et al., 2007).
Figure 3. Paternal Dominance of Chr.7 UPD Initiates During Embryogenesis.
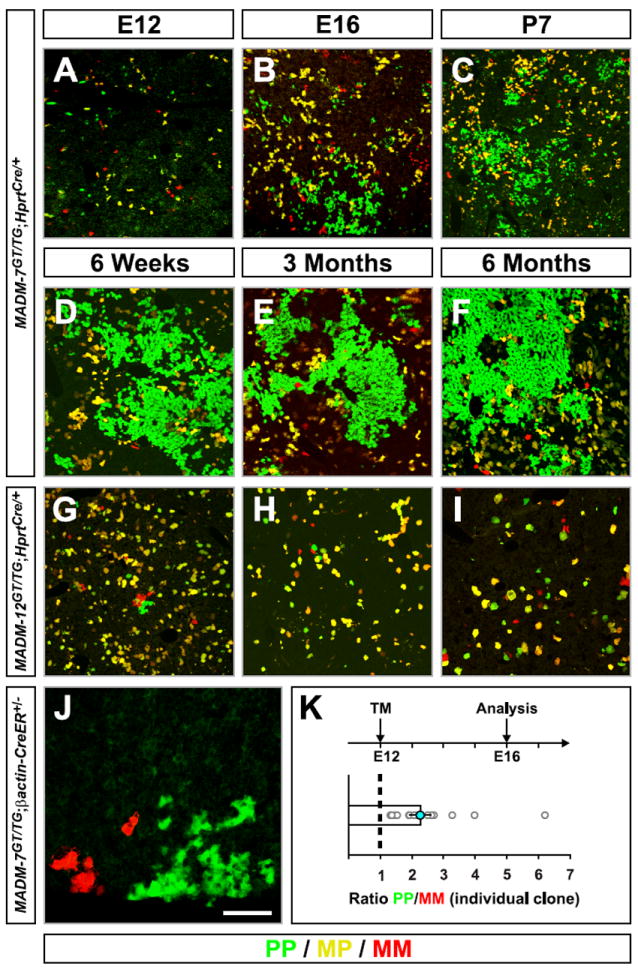
(A-I) Time course analysis of liver at times indicated in MADM-7GT/TG;Hprt-Cre+/- (A-F) and MADM-12GT/TG;Hprt-Cre+/- (G-I).
(J and K) Clonal analysis in MADM-7GT/TG;βactin-CreER+/- liver. (J) A representative image of a single G2-X MADM clone at E16 with tamoxifen (TM) injected at E12. Note the increased expansion of green PP when compared to red MM Chr.7 cells. (K) Quantification of G2-X MADM clones. The geometric mean of the PP/MM ratio is 2.3±0.3, n=15.
In all panels, PP cells are green and MM cells are red. Scale bar: 180μm (A); 200μm (B); 250μm (C); 300μm (D-I); 50μm (J).
Expansion of the MADM-labeled domains with unipaternal Chr.7 hepatocytes became more apparent at postnatal stages (Figures 3C-3F). Nevertheless, mosaic MADM-7 livers were neither larger than wild-type nor displayed any signs of tumors in mice of up to six months of age, suggesting that cell expansion due to unipaternal disomy still follows organ size control mechanism as in wild-type hepatocytes (Stanger, 2008). In contrast to hepatocytes with unipaternal Chr.7 disomy, hepatocytes with either uniparental disomy for Chr.12 displayed equal numbers postnatally up to 6 months (Figures 3G-3I).
Ablation of a Single Gene on Chr.7, Igf2, Largely Mitigates Paternal Growth Advantage of Chr. 7 UPD
The paternal dominance of Chr.7 disomy cells could, in principle, reflect the consequence of homozygosing many or just a few imprinted genes on Chr.7. Since the ‘imprintome’ of Chr.7 in the liver is currently unknown, we pursued a candidate gene approach to identify the causal gene. Chr.7 harbors several clusters of imprinted genes that either promote or antagonize growth, including paternally expressed Igf2 (Insulin-like growth factor 2) (DeChiara et al., 1991), as well as maternally expressed H19 (Bartolomei et al., 1991) and Cdkn1c (Cyclin-dependent kinase inhibitor 1C, aka p57kip2) (Hatada and Mukai, 1995; Matsuoka et al., 1995). The growth advantage of unipaternal disomy can be caused by overexpression of paternally expressed growth-promoting gene(s), absence of maternally expressed growth antagonizing gene(s), or a combination of both. We began by assessing the involvement of Igf2 and introduced a null allele from the father into our MADM analysis. Since Igf2 is paternally expressed in most cells (DeChiara et al., 1991), Igf2m/- (m stands for the wild-type allele inherited from the mother) should in principle be equivalent to homozygous Igf2-/-. Remarkably, we found a striking reduction of the large clusters of unipaternal Chr.7 disomy cells at P21 in Igf2m/--MADM (Figures 4A and 4D compared with 4B and 4E; Figures S3A and S3B).
Figure 4. Igf2 Accounts for Most of the Paternal Dominance in Chr. 7 UPD.
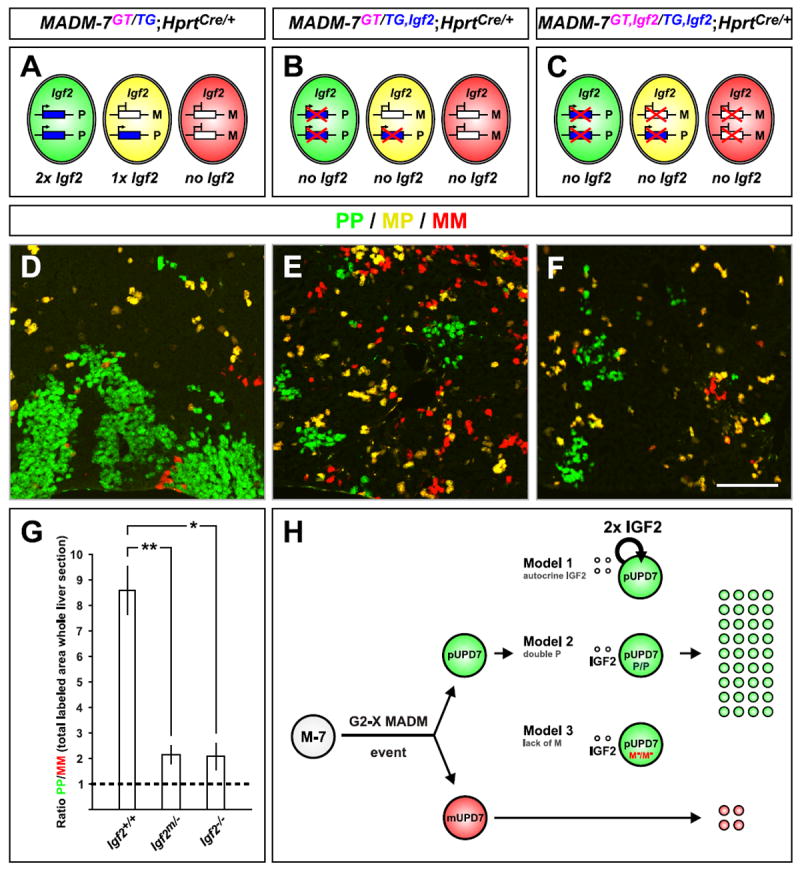
(A-C) Schematic of Igf2 expression in MADM-7GT/TG;Hprt-Cre+/-. (A) Control-MADM-7. (B) Igf2 mutation on paternal chromosome. (C) Igf2 mutation on both, paternal and maternal, chromosomes. Note that due to Igf2 imprinting, most cells in (B) do not express Igf2.
(D-F) Labeling of uniparental Chr.7 disomy (PP cells are green and MM cells are red) in P21 control, paternal Igf2 mutant, or homozygous Igf2-/- mutant MADM animals corresponding to the schemes in (A-C). Scale bar: 110μm.
(G) Quantification of PP/MM ratio in whole liver sections from P21 MADM animals with genotypes indicated. Values represent mean ±SEM, *p<0.05 and **p<0.01.
(H) Three possible models to account for expansion of cells with unipaternal disomy in sparsely generated MADM-7 clones in wild-type animal. Assuming the crossing scheme in Figure 1A, cells with unipaternal Chr.7 disomy (pUPD7) are labeled in green and cells with unimaternal Chr.7 disomy (mUPD7) in red upon a G2-X MADM event. Green pUPD7 cells express a double dose of Igf2 and P factor(s) but lack M factor(s), where P or M factors represent additional imprinted genes on Chr. 7 that could act cell-autonomously to promote or inhibit IGF2 signaling, respectively. In Model 1, IGF2 (double dose) signals strictly autocrine to only pUPD7 but not to mUPD7. In Model 2, the double dose of additional imprinted P factor(s) act in concert with secreted IGF2 to convey the growth advantage in pUPD7. In Model 3, the lack of M factor(s), which normally would tune down the IGF2 signal to a certain extent, promotes increased IGF2 growth signaling in pUPD7 cells. The cell-type specificity of UPD7 effects we observed may be a consequence of cell-type specific expression of the M or P factors, or cell type-specific interactions of these factors with IGF2.
See also Figures S3 and S4.
To compare hepatocyte expansion with unipaternal Chr.7 disomy produced by MADM in control mice and mice with paternal loss of Igf2, we quantified all green and red cells in entire liver sections to avoid selection bias, and calculated their ratios (Figure 4G; Figures S4A and S4B). We found an 8.6±0.9 fold paternal expansion in control-MADM. The PP/MM ratio was reduced to 2.2±0.4 fold in animals with Igf2m/--MADM. To test whether the residual paternal dominance was due to IGF2 from a possible reactivation of the silenced maternal Igf2 allele, or in serum from distinct sources not subjected to imprinting (DeChiara et al., 1991), we also examined the liver from homozygous Igf2-/- mutants with MADM labeling (Figures 4C and S3C). We found a reduction of the PP/MM ratio (Fig. 4F) to the same level (2.1±0.5) as when the Igf2 mutation was introduced only from the father. By contrast, maternal transmission of the Igf2 mutation had no effect on paternal dominance (Figures S3D, S4C and S4D). Thus, the loss of the paternally inherited Igf2 fully accounts for the imprinting effect.
To extend our findings to other tissues, we also examined the effect of IGF2 on the paternal growth dominance in the lung epithelia. We found that paternal transmission of the Igf2 mutation also resulted in marked reduction of paternal growth dominance in the lung (Figures S4E-S4H), highlighting a general role of Igf2 imprinting in distinct cell types. Taken together, these findings indicate that Igf2 is a major factor driving unipaternal Chr.7 growth dominance in the liver and lung.
Evidence that Additional Imprinted Factor(s) on Chr. 7 Act Cell-Autonomously to Receive the IGF2 Signal
Although Chr. 7 harbors many imprinted genes controlling growth, we found that mutation of just one paternally expressed gene - Igf2 - mitigates the majority of the paternal dominance effect. Our findings are in line with previous chimera studies implicating that duplication of distal Chr. 7 (where Igf2 is located) and Igf2 itself are responsible for causing overgrowth (Ferguson-Smith et al., 1991; McLaughlin et al., 1997). We further extended these studies with single cell resolution by producing and visualizing UPD through rare mitotic recombination events enabled by MADM.
However, it is surprising that a secreted factor should be a major contributor in our experimental setting. Under the control-MADM-7 condition, all unipaternal disomy cells that overexpress Igf2 originate from mitotic recombination events in a single cell and are surrounded by a vast majority of cells with regular paternal Igf2 expression. Even with paternal growth dominance, unipaternal cells represent only a small fraction of the whole liver (see Figure S4A). We envision three possibilities to explain the paternal growth dominance that we observed in MADM-7 mice (Figure 4H). First, despite being a secreted factor, IGF2 acts predominantly cell-autonomously. Furthermore, a two-fold increase in IGF2 levels should greatly facilitate the growth of the unipaternal cells. We consider the first possibility unlikely, since IGF2 is well known to bind IGF-binding proteins, enabling IGF2 distribution in the bloodstream and thus to signal growth of neighboring cells in paracrine and endocrine manners (Chao and D’Amore, 2008). Second, in addition to IGF2, another paternally expressed P factor acts cell-autonomously to positively regulate IGF2 signal transmission. Again, this P factor should act in a dose-dependent fashion to account for the growth of unipaternal Chr.7 disomy cells in a mostly wild-type background, as it would also be present in two-fold higher dosage levels, similar to IGF2. Third, a maternally expressed M factor acts cell-autonomously to negatively regulate IGF2 signal transmission. In unipaternal Chr.7 disomy cells, the lack of the negative M factor results in greatly amplified IGF2 growth signaling.
In both the second and third possibilities above, the additional Chr.7 P or M imprinted factors contribute, at most, a 2-fold difference independent of IGF2, and their major actions are manifested in the context of cell-autonomous IGF2 signal transmission. We favor the third model because it requires the least number of assumptions; indeed Cdkn1c could represent an attractive candidate for the M factor, as genetic interactions have been demonstrated between Igf2 and Cdkn1c (Caspary et al., 1999).
While Igf2 displays a highly specific expression pattern in the brain, it is broadly expressed in peripheral embryonic tissues such as the liver, lung and heart (Davies et al., 2002; DeChiara et al., 1991; Lehtinen et al., 2011). Since we have only detected a significant proliferation advantage in the liver and lung but not in the heart or the brain, it is highly unlikely that the cell-type specific effect of imprinting is accounted for by tissue-specific Igf2 expression patterns. Rather, the tissue specificity of the imprinting effect is likely caused by tissue-specific expression of the M or P factors, or their tissue-specific interactions with IGF2.
CONCLUSIONS
We have used the MADM strategy to create, and concomitantly visualize with distinct fluorescent colors, cells with unipaternal and unimaternal near whole chromosomal disomy. Consequently, it is possible to assay the phenotype of genomic imprinting at the unprecedented single cell resolution in virtually any tissue or organ and potentially for every chromosome in the mouse. The results from MADM of Chr.7 and Chr.12 revealed chromosome- as well as cell-type specific imprinting phenotypes. The cell-type specificity of genomic imprinting indicates that certain genes exploit parentally controlled expression regulation in order to fulfill their appropriate physiological functions.
A salient advantage of the MADM method is the controlled generation of defined unipaternal and unimaternal disomic cells that are labeled by two distinct fluorescent colors at the single cell resolution. This provides a sensitive means to detect phenotypes for homozygosing imprinted genes controlling cell proliferation (such as Igf2 presented in our study), size, and morphogenesis. An important feature is that MADM-induced UPD cells always display the combined phenotype of the entire cohort of imprinted genes located on a particular chromosome. This could be a limitation when it comes to identifying specific genes on the chromosome that contributes to the imprinting phenotypes. Therefore, the MADM approach complements rather than replaces conventional and/or conditional knockout experiments to study the function of imprinted genes. We presented an example of combining MADM to analyze whole chromosome UPD with mutation in a selected candidate gene, Igf2, and deduced the quantitative contribution of Igf2 to the imprinting effect of the entire chromosome.
Finally, MADM analysis has been critical to study cell-autonomous functions of candidate genes (besides Igf2 described in this study) in cell proliferation, neuronal migration, dendrite morphogenesis, and tumor growth (Espinosa et al., 2009; Hippenmeyer et al., 2010; Liu et al., 2011; Muzumdar et al., 2007). The establishment of MADM cassettes on Chr. 7 and Chr. 12 now allows mosaic analysis of vast majority of genes (~2500 on Chr.7 and ~950 on Chr.12) on two new chromosomes in addition to our previous efforts (Hippenmeyer et al., 2010; Tasic et al., 2012; Zong et al., 2005). These new MADM-7 and MADM-12 together almost double the total number of mouse genes that can be subjected to MADM analysis.
EXPERIMENTAL PROCEDURES
Generation of MADM-7 and MADM-12 Mice and Mouse Genetic Techniques
MADM-7 and MADM-12 mice were generated following a previously described strategy (Hippenmeyer et al., 2010). In brief, for MADM-7 and MADM-12 targeting constructs, we identified suitable genomic loci on Chr.7 (Hipp-7 located at 2.13cM; ~0.7kb downstream of exon 5 of the Rps9 gene) and Chr.12 (John-12 located at 1.71cM; ~16kb downstream of exon 1 of the Rab10 gene). The Hipp-7 and John-12 genomic loci were cloned, GT and TG MADM-cassettes (Hippenmeyer et al., 2010; Liu et al., 2011) inserted, and targeting vectors constructed using standard molecular biology procedures (details are available upon request). Linearized targeting vectors were then electroporated into R1 ES cells and two correctly targeted GT and TG clones for each MADM-7 and MADM-12, respectively, injected into blastocysts to generate chimeric mice. Homozygous MADM-7GT/GT, MADM-7TG/TG, MADM-12GT/GT, MADM-12TG/TG; and transheterozygous MADM-7GT/TG and MADM-12GT/TG were born at Mendelian frequencies, had a normal lifespan, were fertile, showed no obvious averse phenotype, and did not exhibit GFP/tdT marker expression in the absence of Cre recombinase.
Heterozygote Igf2+/- (DeChiara et al., 1990), βactin-CreER+/- (Guo et al., 2002) and hemizygote HprtCre/Y (Tang et al., 2002) mice have been described. Timed pregnancies were setup to generate embryos at defined developmental stages. For the generation of recombinant MADM-7GT,Igf2/TG or MADM-7GT/TG,Igf2, we followed a standard breeding strategy as previously described (Hippenmeyer et al., 2010). The MADM experiments described in this study were carried out in mixed 129/C57Bl6/CD1 genetic background and all experimental procedures were carried out in accordance with the APLAC (Administrative Panel on Laboratory Animal Care) protocol and the institutional guidelines by the Veterinary Service Center (VSC) at Stanford University. MADM-7GT, MADM-7TG, MADM-12GT, and MADM-12TG mice are available at Jackson Laboratory Repository (http://jaxmice.jax.org).
Analysis of Marker Expression in MADM Animals
Experimental MADM mice at various ages were perfused, organs removed and processed for cryosections essentially as described (Hippenmeyer et al., 2010). Typically, we isolated the whole brain, heart, and the largest leaflets of the lung and liver from postnatal mice. Whole embryos were isolated and left intact for processing except that the body was separated from the head and the limbs removed. The brain, heart and lung were cryosectioned sagittally at 60μm (brain) and 14μm (heart and lung); coronal sections were acquired from the liver at 14μm. The fluorescent tdT and GFP signals were usually not amplified by antibody staining but tissue sections were stained with DAPI (Invitrogen) to visualize nuclei and confocal images acquired using a LSM 510 (Zeiss).
Generation and Analysis of MADM Clones in Liver
For the induction of G2-X MADM clones in liver, we setup timed pregnancies, injected tamoxifen (TM) intraperitoneally at E12, and isolated embryos at E16. Embryos were fixed in 4% PFA/PB overnight, cryoprotected in 30% sucrose/PBS, embedded in OCT and sectioned in the sagittal plane at 30μm. The frequency of MADM clone generation was extremely low and varied between cohorts with slightly different genetic background.
Computation of PP/MM Ratios
Pyramidal cells in hippocampal area CA1 were counted in confocal images from 16 (MADM-7GT/TG;Hprt-Cre+/-) and 11 (MADM-12GT/TG;Hprt-Cre+/-) cryosections (derived from n=3 animals for each genotype) encompassing the whole CA1 area. Purkinje cells in cerebella were counted in all consecutive sections from 4 (MADM-7GT/TG;Hprt-Cre+/-) and 3 (MADM-12GT/TG;Hprt-Cre+/-) entire half brains derived from n>2 animals each. For quantification of heart cardiomyocyte and liver hepatocyte populations, the green (GFP) and red (tdT) MADM signals were first extracted manually from confocal images derived from cryosections to separate them from the yellow GFP+/tdT+ signal. The total areas of green and red signals, respectively, were then computed from binary images using a custom MATLAB script. The geometric means ±SEM of the paternal/maternal ratios were calculated in Excel and significance was determined using Student’s t-test: *p<0.05 and **p<0.01.
Supplementary Material
Highlights.
Extension of Mosaic Analysis with Double Markers (MADM) to chromosomes 7 & 12.
Probing genomic imprinting with single cell resolution using chromosome disomy.
Discovery of chromosome- and cell-type specificity of imprinting effects.
Key roles of IGF2 signaling in paternal growth dominance in Chr.7 disomy.
Acknowledgments
We thank H. Zong for FLLFL MADM cassettes and discussions about MADM; Y. Chen-Tsai and the Stanford Transgenic Facility for generating knockin mice; A. Efstratiadis and C. Walsh for providing Igf2 mutant mice; C. Manalac, J. Zhong, K. Jaeckle, C. Nguyen and M. Shu for technical support; and H. Chang, N. Makki, B. Weissbourd and T. Mosca for helpful comments on the manuscript. This work was supported by the European Molecular Biology Organization ALTF 851-2005 (S.H.), Human Frontier Science Program Organization LT00805/2006-L (S.H.), Swiss National Science Foundation PA00P3_124160 and PA00P3_136482 (S.H.), and NIH grants R01-NS050835 (L.L) and R01-HD060579 (R.L.J). L.L. is an investigator of the Howard Hughes Medical Institute.
Footnotes
Publisher's Disclaimer: This is a PDF file of an unedited manuscript that has been accepted for publication. As a service to our customers we are providing this early version of the manuscript. The manuscript will undergo copyediting, typesetting, and review of the resulting proof before it is published in its final citable form. Please note that during the production process errors may be discovered which could affect the content, and all legal disclaimers that apply to the journal pertain.
References
- Barlow DP. Genomic imprinting: a mammalian epigenetic discovery model. Annu Rev Genet. 2011;45:379–403. doi: 10.1146/annurev-genet-110410-132459. [DOI] [PubMed] [Google Scholar]
- Bartolomei MS, Ferguson-Smith AC. Mammalian genomic imprinting. Cold Spring Harb Perspect Biol. 2011;3 doi: 10.1101/cshperspect.a002592. [DOI] [PMC free article] [PubMed] [Google Scholar]
- Bartolomei MS, Zemel S, Tilghman SM. Parental imprinting of the mouse H19 gene. Nature. 1991;351:153–155. doi: 10.1038/351153a0. [DOI] [PubMed] [Google Scholar]
- Barton SC, Surani MA, Norris ML. Role of paternal and maternal genomes in mouse development. Nature. 1984;311:374–376. doi: 10.1038/311374a0. [DOI] [PubMed] [Google Scholar]
- Caspary T, Cleary MA, Perlman EJ, Zhang P, Elledge SJ, Tilghman SM. Oppositely imprinted genes p57(Kip2) and igf2 interact in a mouse model for Beckwith-Wiedemann syndrome. Genes Dev. 1999;13:3115–3124. doi: 10.1101/gad.13.23.3115. [DOI] [PMC free article] [PubMed] [Google Scholar]
- Cattanach BM, Kirk M. Differential activity of maternally and paternally derived chromosome regions in mice. Nature. 1985;315:496–498. doi: 10.1038/315496a0. [DOI] [PubMed] [Google Scholar]
- Chao W, D’Amore PA. IGF2: epigenetic regulation and role in development and disease. Cytokine Growth Factor Rev. 2008;19:111–120. doi: 10.1016/j.cytogfr.2008.01.005. [DOI] [PMC free article] [PubMed] [Google Scholar]
- Davies K, Bowden L, Smith P, Dean W, Hill D, Furuumi H, Sasaki H, Cattanach B, Reik W. Disruption of mesodermal enhancers for Igf2 in the minute mutant. Development. 2002;129:1657–1668. doi: 10.1242/dev.129.7.1657. [DOI] [PubMed] [Google Scholar]
- DeChiara TM, Efstratiadis A, Robertson EJ. A growth-deficiency phenotype in heterozygous mice carrying an insulin-like growth factor II gene disrupted by targeting. Nature. 1990;345:78–80. doi: 10.1038/345078a0. [DOI] [PubMed] [Google Scholar]
- DeChiara TM, Robertson EJ, Efstratiadis A. Parental imprinting of the mouse insulin-like growth factor II gene. Cell. 1991;64:849–859. doi: 10.1016/0092-8674(91)90513-x. [DOI] [PubMed] [Google Scholar]
- Espinosa JS, Wheeler DG, Tsien RW, Luo L. Uncoupling dendrite growth and patterning: single-cell knockout analysis of NMDA receptor 2B. Neuron. 2009;62:205–217. doi: 10.1016/j.neuron.2009.03.006. [DOI] [PMC free article] [PubMed] [Google Scholar]
- Feinberg AP. Phenotypic plasticity and the epigenetics of human disease. Nature. 2007;447:433–440. doi: 10.1038/nature05919. [DOI] [PubMed] [Google Scholar]
- Ferguson-Smith AC. Genomic imprinting: the emergence of an epigenetic paradigm. Nat Rev Genet. 2011;12:565–575. doi: 10.1038/nrg3032. [DOI] [PubMed] [Google Scholar]
- Ferguson-Smith AC, Cattanach BM, Barton SC, Beechey CV, Surani MA. Embryological and molecular investigations of parental imprinting on mouse chromosome 7. Nature. 1991;351:667–670. doi: 10.1038/351667a0. [DOI] [PubMed] [Google Scholar]
- Ferron SR, Charalambous M, Radford E, McEwen K, Wildner H, Hind E, Morante-Redolat JM, Laborda J, Guillemot F, Bauer SR, et al. Postnatal loss of Dlk1 imprinting in stem cells and niche astrocytes regulates neurogenesis. Nature. 2011;475:381–385. doi: 10.1038/nature10229. [DOI] [PMC free article] [PubMed] [Google Scholar]
- Garfield AS, Cowley M, Smith FM, Moorwood K, Stewart-Cox JE, Gilroy K, Baker S, Xia J, Dalley JW, Hurst LD, et al. Distinct physiological and behavioural functions for parental alleles of imprinted Grb10. Nature. 2011;469:534–538. doi: 10.1038/nature09651. [DOI] [PMC free article] [PubMed] [Google Scholar]
- Guo C, Yang W, Lobe CG. A Cre recombinase transgene with mosaic, widespread tamoxifen-inducible action. Genesis. 2002;32:8–18. doi: 10.1002/gene.10021. [DOI] [PubMed] [Google Scholar]
- Hatada I, Mukai T. Genomic imprinting of p57KIP2, a cyclin-dependent kinase inhibitor, in mouse. Nat Genet. 1995;11:204–206. doi: 10.1038/ng1095-204. [DOI] [PubMed] [Google Scholar]
- Hippenmeyer S, Youn YH, Moon HM, Miyamichi K, Zong H, Wynshaw-Boris A, Luo L. Genetic mosaic dissection of Lis1 and Ndel1 in neuronal migration. Neuron. 2010;68:695–709. doi: 10.1016/j.neuron.2010.09.027. [DOI] [PMC free article] [PubMed] [Google Scholar]
- Lehtinen MK, Zappaterra MW, Chen X, Yang YJ, Hill AD, Lun M, Maynard T, Gonzalez D, Kim S, Ye P, et al. The cerebrospinal fluid provides a proliferative niche for neural progenitor cells. Neuron. 2011;69:893–905. doi: 10.1016/j.neuron.2011.01.023. [DOI] [PMC free article] [PubMed] [Google Scholar]
- Liu C, Sage JC, Miller MR, Verhaak RG, Hippenmeyer S, Vogel H, Foreman O, Bronson RT, Nishiyama A, Luo L, et al. Mosaic analysis with double markers reveals tumor cell of origin in glioma. Cell. 2011;146:209–221. doi: 10.1016/j.cell.2011.06.014. [DOI] [PMC free article] [PubMed] [Google Scholar]
- Mabb AM, Judson MC, Zylka MJ, Philpot BD. Angelman syndrome: insights into genomic imprinting and neurodevelopmental phenotypes. Trends Neurosci. 2011;34:293–303. doi: 10.1016/j.tins.2011.04.001. [DOI] [PMC free article] [PubMed] [Google Scholar]
- Matsuoka S, Edwards MC, Bai C, Parker S, Zhang P, Baldini A, Harper JW, Elledge SJ. p57KIP2, a structurally distinct member of the p21CIP1 Cdk inhibitor family, is a candidate tumor suppressor gene. Genes Dev. 1995;9:650–662. doi: 10.1101/gad.9.6.650. [DOI] [PubMed] [Google Scholar]
- McGrath J, Solter D. Completion of mouse embryogenesis requires both the maternal and paternal genomes. Cell. 1984;37:179–183. doi: 10.1016/0092-8674(84)90313-1. [DOI] [PubMed] [Google Scholar]
- McLaughlin KJ, Kochanowski H, Solter D, Schwarzkopf G, Szabo PE, Mann JR. Roles of the imprinted gene Igf2 and paternal duplication of distal chromosome 7 in the perinatal abnormalities of androgenetic mouse chimeras. Development. 1997;124:4897–4904. doi: 10.1242/dev.124.23.4897. [DOI] [PubMed] [Google Scholar]
- Muzumdar MD, Luo L, Zong H. Modeling sporadic loss of heterozygosity in mice by using mosaic analysis with double markers (MADM) Proc Natl Acad Sci U S A. 2007;104:4495–4500. doi: 10.1073/pnas.0606491104. [DOI] [PMC free article] [PubMed] [Google Scholar]
- Nicholls RD, Knepper JL. Genome organization, function, and imprinting in Prader-Willi and Angelman syndromes. Annu Rev Genomics Hum Genet. 2001;2:153–175. doi: 10.1146/annurev.genom.2.1.153. [DOI] [PubMed] [Google Scholar]
- Stanger BZ. Organ size determination and the limits of regulation. Cell Cycle. 2008;7:318–324. doi: 10.4161/cc.7.3.5348. [DOI] [PubMed] [Google Scholar]
- Stanger BZ, Tanaka AJ, Melton DA. Organ size is limited by the number of embryonic progenitor cells in the pancreas but not the liver. Nature. 2007;445:886–891. doi: 10.1038/nature05537. [DOI] [PubMed] [Google Scholar]
- Surani MA, Barton SC, Norris ML. Development of reconstituted mouse eggs suggests imprinting of the genome during gametogenesis. Nature. 1984;308:548–550. doi: 10.1038/308548a0. [DOI] [PubMed] [Google Scholar]
- Tang SH, Silva FJ, Tsark WM, Mann JR. A Cre/loxP-deleter transgenic line in mouse strain 129S1/SvImJ. Genesis. 2002;32:199–202. doi: 10.1002/gene.10030. [DOI] [PubMed] [Google Scholar]
- Tasic B, Miyamichi K, Hippenmeyer S, Dani VS, Zeng H, Joo W, Zong H, Chen-Tsai Y, Luo L. Extensions of MADM (mosaic analysis with double markers) in mice. PLoS One. 2012;7:e33332. doi: 10.1371/journal.pone.0033332. [DOI] [PMC free article] [PubMed] [Google Scholar]
- Wilkinson LS, Davies W, Isles AR. Genomic imprinting effects on brain development and function. Nat Rev Neurosci. 2007;8:832–843. doi: 10.1038/nrn2235. [DOI] [PubMed] [Google Scholar]
- Williamson CM, B A, Thomas S, Beechey CV, Hancock J, Cattanach BM, Peters J. MRC Harwell; Oxfordshire: 2012. World Wide Web Site - Mouse Imprinting Data and References - http://www.har.mrc.ac.uk/research/genomic_imprinting/ [Google Scholar]
- Zong H, Espinosa JS, Su HH, Muzumdar MD, Luo L. Mosaic analysis with double markers in mice. Cell. 2005;121:479–492. doi: 10.1016/j.cell.2005.02.012. [DOI] [PubMed] [Google Scholar]
Associated Data
This section collects any data citations, data availability statements, or supplementary materials included in this article.