Abstract
Bifunctional catalase-peroxidases (KatGs) are heme oxidoreductases widely spread among bacteria, archaea and among lower eukaryotes. In fungi, two KatG groups with different localization have evolved, intracellular (KatG1) and extracellular (KatG2) proteins. Here, the cloning, expression analysis and subcellular localization of two novel katG1 genes from the soil fungi Chaetomium globosum and Chaetomium cochliodes are reported. Whereas, the metalloenzyme from Ch. globosum is expressed constitutively, Ch. cochliodes KatG1 reveals a slight increase in expression after induction of oxidative stress by cadmium ions and hydrogen peroxide. The intronless open reading frames of both Sordariomycetes katG1 genes as well as of almost all fungal katG1s possess two peroxisomal targeting signals (PTS1 and PTS2). Peroxisomal localization of intracellular eukaryotic catalase-peroxidases was verified by organelle separation and immunofluorescence microscopy. Co-localization with the peroxisomal enzyme 3-ketoacyl-CoA-thiolase was demonstrated for KatGs from Magnaporthe grisea, Chaetomium globosum and Chaetomium cochliodes. The physiological role of fungal catalase-peroxidases is discussed.
Electronic supplementary material
The online version of this article (doi:10.1007/s00203-013-0887-5) contains supplementary material, which is available to authorized users.
Keywords: Catalase-peroxidase (KatG), Chaetomium, Oxidative stress, Peroxisomal targeting, Thiolase, Real-time PCR
Introduction
Catalase-peroxidases (mostly abbreviated as KatGs) represent a widespread protein family of heme b containing oxidoreductases (EC 1.11.1.21) capable of both efficient dismutation of hydrogen peroxide to oxygen and water as well as classical peroxidase activity with physiologically unknown endogenous electron donor(s) (Smulevich et al. 2006; Zamocky et al. 2008). These unique peroxidases evolved in ancestral bacteria revealing a complex gene-duplicated structure. Besides being found in numerous bacteria of all phyla, katG genes were also detected in genomes of lower eukaryotes, most prominently of sac and club fungi (Klotz and Loewen 2003; Zamocky and Obinger 2010). Phylogenetic analyses revealed that the corresponding gene was transferred during later steps of katG evolution via horizontal gene transfer (HGT) most probably from Bacteroidetes to ancestral fungal genomes (Zamocky et al. 2010, 2012a).
Genomic analysis demonstrated the occurrence of two gene paralogs coding for two distinct fungal catalase-peroxidases (KatG1 and KatG2) that differ in localization, structural and functional properties (Zamocky et al. 2009a, b). All KatG-containing fungi have an intracellular enzyme (KatG1), whereas, only phytopathogenic fungi have in addition a secreted (extracellular) species (KatG2) that seems to be involved in host attack (Zamocky et al. 2012b). Both the role and localization of eukaryotic KatG1 are unknown so far. Its catalatic activity suggests a role in H2O2 degradation, the latter being permanently produced as by-product of aerobic metabolism in the cells. Due to the presence of several (oxidative) catabolic pathways, peroxisomes that play a key role in redox signaling and lipid homeostasis (Gabaldón 2011; Schlüter et al. 2010) typically contain high amounts of monofunctional catalases (EC 1.11.1.6). Peroxisomes of filamentous fungi are rather scarcely investigated organelles, although their involvement in β-oxidation of fatty acids, oxidative stress response (Gabaldón 2011) and even in production of penicillin was already demonstrated (Kiel et al. 2000). Peroxisomes do not possess their own genetic apparatus, and all organelle proteins must be imported including monofunctional catalases. This was also demonstrated for yeast and fungal peroxisomes (Kragler et al. 1993). Recently, it was indicated that also bifunctional catalase-peroxidases could be imported into peroxisomes (Kiel et al. 2009).
In this contribution, we have analyzed the expression pattern and subcellular localization of three different intracellular ascomycetous catalase-peroxidases, namely KatG1s from Magnaporthe grisea, Chaetomium globosum and Chaetomium cochliodes, respectively. Cloning and expression analysis of katG1 genes from the two soil fungi from the abundant family Chaetomiaceae are reported for the first time. Expression of catalase-peroxidases has been reported in related saprotrophic fungi Podospora anserina (Bourdais et al. 2012) and Neurospora crassa (Peraza and Hansberg 2002), but their subcellular localization has not been addressed so far. Analysis of the intracellular catalase-peroxidases clearly demonstrated the presence of two peroxisomal targeting signals (PTS1 and PTS2). Peroxisomal co-localization with the marker enzyme 3-ketoacyl-CoA-thiolase is demonstrated in this contribution by organelle separation as well as immunofluorescence microscopy. The physiological role of fungal KatG1s is discussed.
Materials and methods
Organisms and cultivation
Chaetomium globosum was obtained from cultivated isolates taken from medieval art objects deposited in Slovak National Gallery in Bratislava, Slovakia (Pangallo et al. 2009). Chaetomium cochliodes CCM F-232 was obtained from Czech Collection of Microorganisms at the Masaryk University, Faculty of Natural Sciences in Brno, Czech republic. Magnaporthe grisea (synonym Pyricularia grisea) was obtained from the culture collection of BOKU—University of Natural Resources and Life Sciences in Vienna, Austria. During experiments, all three mentioned fungi were maintained on potato dextrose (PD) medium (4 g potato extract, 20 g glucose/L pH 5.6) or on PD-agar plates (PD medium with 15 g agar/L) at 30 °C.
Growth conditions and isolation of genomic DNA and mRNA
The three fungal strains were grown in 100-mL PD medium and incubated at 30 °C for 2–5 days with continuous shaking at 200 rpm. For probing the effect of oxidative stress on katG1 expression, after 48 h of growth, the fungi were exposed to following agents for 1 h: hydrogen peroxide (0.01 M final), peroxyacetic acid (0.05 M final), paraquat (0.1 mM) and Cd2+ (5 mg/mL). Afterward the mycelia were separated from the broth by filtration through sterile filter paper (Whatman No. 1) and frozen at −80 °C for DNA and RNA extraction. The DNA was extracted with DNeasy Tissue Kit (QIAGEN, Hilden, Germany) and the RNA with Spectrum Plant Total RNA Kit (Sigma-Aldrich) according to the manufacturer’s instructions.
Total RNA (~3 μg) was reverse-transcribed in the presence of oligo(dT)20 primer in a \ volume of 20 μl by applying the Cloned AMV First-strand cDNA synthesis Kit (Invitrogen). Obtained product was used as template for RT-PCR. Primers CgkatGNterFWD + CgkatGintREV2 (Table 1) were used to study the level of expression of katG genes, and primers CgTIMfwd and CgTIMrev were used as a control of expression levels. For obtaining the complete sequences of Ch. globosum and Ch. cochliodes katG1 genes, the primer pair CgkatGNtermFWD and CgtermREV was used. All PCR constructs were cloned in pCR-Blunt vector (Invitrogen). For quantification of the expression levels, real-time PCR was performed on 7900HT Fast Real-Time PCR System from Applied Biosystems with FastStart SYBR Green master mix (Roche) and special real-time PCR primers (Table 1). DNA sequencing of obtained RT-PCR clones and genomic PCR clones was performed at Comenius University Bratislava, Slovakia. Obtained novel DNA sequences were submitted to GenBank.
Table 1.
List of DNA primers used in this work
| Name of primer | Sequence in 5′ → 3′direction |
|---|---|
| CgkatGNterFWD | ATGGGTGAGTGCCCTGTCAACCATG |
| CgkatGintREV2 | GAGATCAGCTTAGCAGGAGCAACGC |
| CgtermREV | CAACTTCGGTCCCGAAGATCCAGGC |
| CgtermrevB | CGTAACGGTCGAGGTTCATCACCTTG |
| CgkatGrtFWD1 | CTCTTATGGCCTGTCAAGCA |
| CgkatGrtREV1 | AAGCCAAACGTCTTGAAACC |
| CgTIMfwd | GAACCAAGGAGTCCATCAAGAG |
| CgTIMrev | ATGACGATCTTCTTCCAGTCGT |
| CgTIMRTrev | CTTGCGCAAGCTGGAGGTAGAG |
Electrophoresis of isolated genomic DNA and of cDNA clones was performed in 1.0 % agarose run in TAE buffer. For staining of DNA bands, GoldView (SBS Genetech) was used.
Homogenization of fungal cultures and measurement of enzymatic activity
Mechanical disruption of frozen fungal mycelia was performed in 50 mM sodium phosphate, 2 mM EDTA (pH 8.2) at 4 °C with glass beads (diameter 0.4 μm). The homogenates were centrifuged at 15,000 g for 10 min. Supernatants were used for the determination of enzymatic activity and protein concentration. Catalase activity was determined spectrophotometrically at pH 7.0 by monitoring the decomposition of H2O2 at 240 nm with an extinction coefficient of 43.6 M−1 cm−1. One unit of catalase activity (1 U) was defined as the amount of enzyme that catalyzes the decomposition of 1 μmol of H2O2 per min (Roggenkamp et al. 1974). Peroxidase was assayed spectrophotometrically at pH 5.5 by monitoring the oxidation of o-dianisidine dihydrochloride at 460 nm (ε460 nm = 11.3 × 10³ M−1 cm−1). One unit of peroxide activity (1 U) was defined as the amount of activity that produces 1 μmol of oxidized o-dianisidine per min (Zou and Schrempf 2000). Total soluble protein in crude extracts was quantified using a Coomassie stain-based assay (Pierce, Rockford, IL). All measurements in this study were performed at room temperature in triplicates and analyzed individually. An average standard deviation was calculated. The bars shown in the figures indicate a standard error of the mean (n = 3).
Isolation of fungal peroxisomes
The method for isolation of fungal peroxisomes originally developed for Penicillium chrysogenum (Kiel et al. 2009) was used with following modifications. The filaments of the three fungi (grown in PD medium) were filtered using a Whatman filter paper No.1 and washed with a KC buffer (0.8 M KCl, 10 mM sodium citrate pH 6.2). They were further protoplasted for 3 h at 25 °C in KC buffer containing 20 mg/mL lysing enzymes from Trichoderma (Sigma-Aldrich). The protoplasts were consecutively washed in KC buffer with 1 mM PMSF, with a mixture of 50 % KC buffer and 50 % sorbitol buffer (1.2 M sorbitol and 1 mM PMSF) and, finally, with 100 % sorbitol buffer containing 1 mM PMSF. Obtained samples were subjected to differential centrifugation comprising three consecutive steps (4 °C): 10 min at 4,000 g, 10 min at 6,000 g and 20 min at 30,000 g, respectively. The pellet from the last centrifugation step was resuspended in ice-cold 40 % saccharose in B buffer (5 mM MES 1 mM MgCl2, 1 mM EDTA, pH 5.5) and applied to ultracentrifugation at 32,000 g for 2.5 h. Up to 20 fractions with the size of 1,5 ml were obtained from each gradient. These fractions were precipitated with equal volume of 50 % TCA and frozen at −20 °C overnight. After 5-min centrifugation at 20,000g, resulting pellets were resuspended in a minimal volume of a solution containing 1 % SDS and 0.1 M NaOH for protein electrophoresis.
Protein electrophoresis and Western blot
Protein electrophoresis of sucrose gradient fractions under denaturing conditions was performed in Mini-Protean Tetra Cell apparatus from BioRad. Ten percentage SDS gels were either stained with Coomassie Brilliant Blue or were used for Western blotting. Western blots were run in Mini Trans-blot cells from BioRad. KatG-specific bands were detected with a polyclonal antibody raised against Synechocystis KatG, as described previously (Zamocky et al. 2012b). Detection of peroxisomal-specific fractions of sucrose gradient was monitored with anti-Fox3 antibody raised against the peroxisomal enzyme 3-ketoacyl-CoA-thiolase from yeast (in the same manner as for anti-KatG antibody).
Native polyacrylamide gels with a linear gradient of acrylamide (4–18 %) were stained for either catalase or peroxidase activity. Catalase activity was visualized after a brief incubation in 0.003 % hydrogen peroxide followed by addition of a freshly prepared mixture of 2 % potassium ferricyanide and 2 % ferric chloride (Woodbury et al. 1971). Peroxidase activity was visualized with 3,3΄-diaminobenzidine tetrahydrochloride (DAB) using the method described by Wayne and Diaz 1986.
Immunofluorescence microscopy
Localization of expressed KatG1 from Chaetomium globosum, Chaetomium cochliodes and Magnaporthe grisea was tested by means of immunofluorescence staining with concomitant fluorescence microscopy. For this purpose, the three fungal strains were cultivated on PD-agar plates. Besides the fungal samples grown aerobically with no additives, positive controls were generated by induction of peroxisome proliferation with the addition of 0.2 ml olive oil/plate for 1 h. Anaerobically grown fungi incubated in the Anaerocult kit (Merck chemicals), served as peroxisome-negative controls.
Anti-KatG-antisera were tested by Western blot analysis for specificity prior to labeling experiments. Oleic acid-induced positive controls were washed once with pure acetone and together with the other samples were fixed in pure ethanol for 15 min at −70 °C. Samples were washed once with PBS (phosphate buffered saline) buffer, and unspecific binding sites were blocked (1 h, 25 °C, constant stirring) in PBS containing 2 % BSA. Subsequently to another washing step with PBS, the samples were exposed to primary polyclonal rabbit anti-αFox3 antiserum (gift from Prof. Kunau, Bochum Germany) diluted 1:100 with PBS (1 h, 25 °C, constant stirring). After removal of unspecific binders by washing the fungal samples three times with tris-buffered saline containing 1 % Tween-20 (TBST), the secondary anti-rabbit TRITC (tetramethyl rhodamine isothiocyanate) conjugate antibody (Sigma-Aldrich) was diluted to a final concentration of 0.03–0.06 mg/mL with PBS and added to the samples, followed by exposure for 1 h at 25 °C under constant stirring. Unbound antibodies were removed by washing three times with 1 ml TBST, and the samples were further labeled with anti-SynKatG (Agrisera)-FITC-conjugated antibody (1 h, 25 °C, constant stirring). In detail, 1 mg of lyophilized anti-KatG antibody was resuspended in 500 μl of 0.05 M borate buffer and labeled with Pierce® FITC (fluorescein isothiocyanate) Antibody Labelling Kit (Thermo Scientific) according to the manufacturer’s instructions. Unbound antibodies were removed by three washing steps with TBST and one washing step with PBS. Analysis of the samples was performed with an Eclipse TE2000-S fluorescence microscope (Nikon, Vienna, Austria). Pictures were taken with a DS-Qi1 Mc-camera (Nikon), and the same image section was recorded in bright field, as well as in the FITC and the TRITC channel, the respective overlay was generated with NIS Elements BR software (Nikon).
Sequence alignment and analysis of peroxisomal targeting signals
Multiple sequence alignment of protein sequences was conducted with ClustalX (Larkin et al. 2007). KatG-optimized parameters were as follows: for pairwise alignment gap opening penalty 9, gap extension penalty 0.15, and for multiple alignment gap opening penalty 8, gap extension penalty 0.2. Gonet protein weight matrix was applied, and the gap-separation distance was set to 4. Peroxisomal targeting signals were predicted in the obtained KatG protein sequences with two prediction programs. For the presence of peroxisomal targeting signal 1 on the C-termini, the PTS1 predictor (Neuberger et al. 2003) was used with fungi-specific function. For the occurrence of peroxisomal targeting signal 2 near the N-termini, the prediction algorithm for the presence of a canonical motif within an amphipathic helix (Kunze et al. 2011) was used. The secondary structure of KatGs was predicted with PSIPRED method version 3.0 (McGuffin et al. 2000).
Results and discussion
Recently, the first eukaryotic intracellular catalase-peroxidase (KatG1) from the rice blast fungus Magnaporthe grisea was cloned and heterologously expressed in E. coli. Its biochemical properties were shown to be similar to those determined for prokaryotic KatGs (Zamocky et al. 2009a). However, several questions remained open including subcellular localization and physiological relevance. In order to clarify these issues in general for the group of KatG1 proteins, we have additionally cloned two novel katG genes from important soil-borne fungi (Ch. globosum and Ch. cochliodes) and compared them with the already known enzyme from M. grisea. Table 2 lists all accession numbers of gene & protein sequences made available within this work.
Table 2.
NCBI accession numbers of clones investigated in this work
| NCBI entry | Description |
|---|---|
| JF937065 | Chaetomium cochliodes katG1 DNA-complete |
| AEQ54765 | Chaetomium cochliodes KatG1 protein-complete |
| CH408031.1 | Chaetomium globosum genomic DNA with katG1 |
| EAQ88655 | Chaetomium globosum KatG1 protein-complete |
| CH476831.1 | Magnaporthe grisea genomic DNA with katG1 |
| EDJ99644 | Magnaporthe grisea KatG1 protein-complete |
The 2,250-bp-long genomic sequence of Chaetomium globosum strain CBS 148.51 (sequenced at Broad institute in USA, genomic scaffold_3) contains the complete katG1 ORF, and translation of this DNA sequence into corresponding amino acid sequence reveals that there are no introns. We have completely sequenced the homologous gene from Ch. cochliodes and found also no introns after translation. Schematic presentation of both genes with location of primers is presented in Fig. 1. RT-PCR (Fig. 2) yielded a gene fragment of cDNA of the same size that would be expected in the genomic DNA. The size of PCR products from genomic DNA for the entire coding region (Fig. 3, 2,250 bp) confirms the intronless state of katG1 in Ch. globosum and Ch. cochliodes. This is typical for almost all sequences from the KatG1 group and underlines the proposed HGT event from Bacteroidetes to ancestral fungal genomes (Zamocky et al. 2012a, b). The new 2,253-bp coding sequence from yet undescribed sac fungus Ch. cochliodes differs only marginally from the genomic sequence of Ch. globosum (91 % identity, 95 % overall homology and 1 gap in the whole ORF). However, these katG1 coding regions reveal a higher overall variability than, for example, the ITS1 noncoding DNA regions routinely used for fungal taxonomical purposes where there is up to 99 % identity (within a 500-bp region) between the two soil fungi. In contrast to Chaetomia genomes, the corresponding genomic region of KatG1 from M. grisea contains one intron near its 3′-terminus dividing the region coding for one of the peroxisomal targeting sequences (PTS1) from the remaining part of the gene (see below).
Fig. 1.
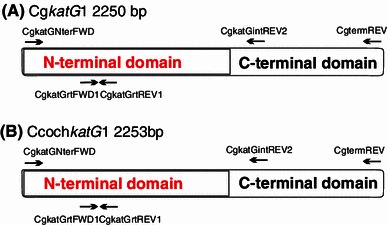
Schematic presentation of two katG1 genes from Chaetomiaceae analyzed in this work. The division of coding regions in two major parts coding for two distinct domains is indicated as well as location of all primers used for PCR
Fig. 2.
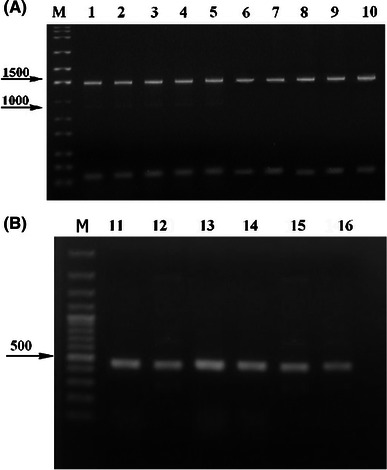
DNA gel electrophoresis of various Chaetomium samples. a DNA electrophoresis in 1 % agarose of RT-PCR products isolated from Ch. globosum grown under standard conditions (lane 1, PD medium with no oxidative stress) or oxidative stress induced by addition of 0.1 mM paraquat (lane 2), or 0.05 M peroxyacetic acid (lane 3), or 5 mg/mL Cd2+ (lane 4), or 10 mM H2O2 (lane 5). In lanes 1–5, the same reaction volume of RT-PCR product from Ch. globosum was loaded for comparison. Products isolated from Ch. cochliodes grown under standard conditions (lane 6) or oxidative stress induced by addition of 0.1 mM paraquat (lane 7) or 0.05 M peroxyacetic acid (lane 8), or 5 mg/ml Cd2+ (lane 9), or 10 mM H2O2 (lane 10). In lanes 6–10, the same reaction volume of RT-PCR product was loaded. For all samples loaded in lanes 1–10, the combination of primers CgkatGNterFWD & CgkatGintREV2 was used for amplification (Table 1). B) DNA electrophoresis in 1 % agarose of control RT-PCR products from Ch. cochliodes (lanes 11–13) and Ch. globosum (lanes 14–16). The same reaction volume of RT-PCR product was loaded in lanes 11–16 in different growth phases: lanes 11 and 14 after 1 day of cultivation, lanes 12 and 15 after 2 days of cultivation and lanes 13 and 16 after 3 days of cultivation; For all samples loaded in lanes 11–16 the combination of primers CgTIMfwd & CgTIMrev was used for amplification (Table 1). Lanes M molecular mass standards with size given in base pairs (bp)
Fig. 3.
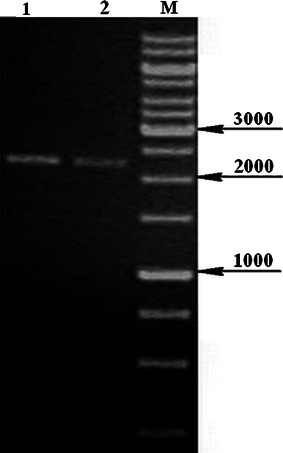
DNA electrophoresis in 1 % agarose of PCR products from genomic DNA of Ch. globosum (lane 1) and Ch. cochliodes CCM F232 (lane 2) containing whole katG genes; lane M molecular mass standard with size given in base pairs (bp)
In the next step, we have analyzed katG1-mRNA occurrence and KatG1 expression pattern of the soil fungi. RT-PCR data clearly demonstrate a constitutive mode of expression for katG1 gene in both Ch. globosum and Ch. cochliodes. Upon induction of oxidative stress by hydrogen peroxide, peroxyacetic acid, and paraquat or Cd2+, no significant increase above the basal expression level was observed (Fig. 2a). This was compared with parallel control RT-PCRs for both Chaetomia based on TIM primers (Fig. 2b) coding for constitutively expressed triose phosphate isomerase from glycolysis (Table 1). Real-time PCR results (Table 3) revealed a constitutive level of katG1-mRNA expression for Ch. globosum, and for Ch. cochliodes, there was a small increase in cadmium samples (typical example is presented in Supplemental Fig. 1). Obtained results are in good agreement with previous analyses performed under comparative conditions for KatG from M. grisea (Zamocky et al. 2009a), where only the induction of mycelia with PQ also led to a slight increase in katG1-mRNA expression.
Table 3.
Quantification of katG1 expression with real-time PCR using internal standard dilutions series (an internal fragment of C. globosum katG1 gene, 1012 bp long cloned in plasmid pRb3)
| Sample | Ct value | cinit DNA [ng/μl] |
|---|---|---|
| Ch. globosum control | 31.81 | 26.2 |
| Ch. globosum H2O2 | 32.32 | 25.7 |
| Ch. globosum PAA | 32.01 | 26.0 |
| Ch. globosum PQ | 32.55 | 25.5 |
| Ch. globosum Cd2+ | 32.48 | 25.6 |
| Ch. cochliodes control | 43.91 | 18.1 |
| Ch. cochliodes H2O2 | 43.09 | 18.5 |
| Ch. cochliodes PAA | 44.50 | 17.8 |
| Ch. cochliodes PQ | 48.94 | 16.0 |
| Ch. cochliodes Cd2+ | 40.70 | 19.7 |
For each sample, average values of triplicate determinations are given
We have further analyzed the expression pattern for intracellular catalase and peroxidase activities in crude extracts of Ch. globosum and Ch. cochliodes (Fig. 4). Recorded activities were highest in the exponential phase of growth (Fig. 4a) in both cases. The highest level of specific activities in samples induced with paraquat could be detected for Ch. globosum (Fig. 4b). For Ch. cochliodes, the highest specific activities were obtained for cadmium- and hydrogen peroxide-induced samples (Fig. 4b). Apparently, intracellular catalase-peroxidases are produced constitutively in the fast aerobically growing mycelia, ready for decomposition of the cellular ROS. The presence of an oxidative stressor further increases their production but only to a slightly higher level. Native gradient protein electrophoresis (Fig. 5) demonstrated the typical bifunctionality of these new eukaryotic KatG1s. The same protein band of a homodimer (calculated MW of around 165 kDa) stained positively by inhibiting the formation of Berlin blue in catalase assay (Fig. 5a) as well as oxidizing DAB in peroxidase assay (Fig. 5b).
Fig. 4.
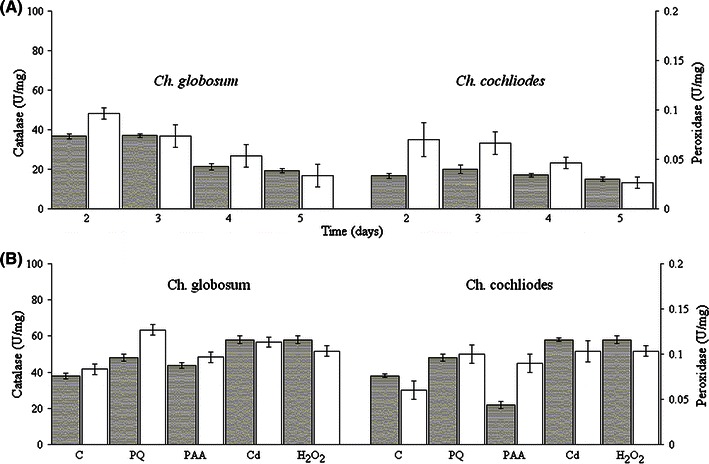
Catalatic (gray columns) and peroxidatic activities (empty columns) in crude extracts of Ch. globosum and Ch. cochliodes grown in PD medium. a Specific activities in various phases of growth at 30 °C (noninduced samples). b Specific activities in the exponential phase of growth with applied stress inductors incubated for 1 h at 30 °C. All presented data are mean values ± SD of three replicates
Fig. 5.
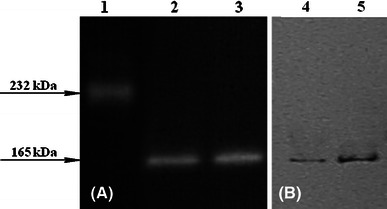
Catalase (a) and peroxidase (b) activity staining in 4–18 % native polyacrylamide gradient gel for Ch. globosum (lane 2 and 4) and Ch. cochliodes CCM F232 (lane 3 and 5). Bovine liver catalase (232 kDa) was used as a monofunctional tetrameric catalase standard (Lane 1)
Furthermore, we probed the subcellular localization of eukaryotic KatG1 starting with gene analysis. Multiple sequence alignment of 20 full-length sequences coding for (ascomycetous) catalase-peroxidases (complete in Suppl. Fig. 2) demonstrated the presence of two peroxisomal targeting signals (PTS) predicted by two independent algorithms (Fig. 6). For comparison, we have included also two extracellular KatG2 sequences (lower sequence pair) that cannot be imported in the peroxisomes. From remaining 18 KatG1 sequences, only Penicilium chrysogenum catalase-peroxidase falls in the “twilight zone” due to PTS1 prediction, and all others are clearly classified. However, this KatG was already suggested to be located in peroxisomes due to evidence from LC–MS/MS (to 32 % coverage) (Kiel et al. 2009). Very interestingly, the KatG1 sequences from two thermophilic fungi (Thielavia terrestris and Chaetomium thermophilum) do not fulfill the criteria for peroxisome import due to lack of PTS1 signal (Fig. 6b), but the import of at least KatG1 from Ch. thermophilum cannot be ruled out according to a rather high conservation of the canonical PTS2 motif (Fig. 6a). The third presented KatG1 from a thermophilic fungus, MthKatG1 possesses both PTS1 and PTS2 signals, but the subcellular location of these technologically interesting oxidoreductases needs to be verified experimentally. All remaining sequences of KatG1s from mesophilic organisms, mainly from phytopathogenic fungi revealed a high level of conservation of both PTS signals. Most intriguingly, the translated cDNA sequence from Hordeum vulgare (Matsumoto et al. 2011) reveals the highest prediction score for fungal PTS1 (Fig. 6b) and PTS2 (Fig. 6a). Thus, it is tempting to speculate whether this sequence originates from Hordeum vulgare or from its yet unknown fungal parasite (also the remaining parts of the sequence resemble fungal KatG1—Supplemental Fig. 2). The sequences of the three KatGs investigated in this work revealed a good level of PTS1 and PTS2 conservation (Fig. 6a, b) and thus, must be considered as targeted into peroxisomes.
Fig. 6.
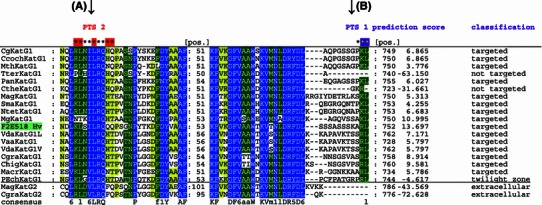
Protein multiple sequence alignment showing the presence (or absence) of PTS1 and PTS2 signals in 20 selected KatG sequences. Color scheme in columns: blue, highest level of conservation; green, intermediate level of conservation; yellow, low level of conservation. Left side region around PTS2 near the N-terminus of KatG proteins. Right side region on the C-terminus with PTS1 comprising last 12 amino acids. For complete alignment see Supplemental Figure 2
These findings prompted us to verify the in vivo localization of the three ascomycetous KatG1s experimentally. Crude extracts of Ch. globosum and Ch. cochliodes were subjected to differential centrifugation and consecutively to sucrose gradient ultracentrifugation. Sucrose gradient fractions were TCA-precipitated (Kiel et al. 2009) loaded on SDS-PAGE and analyzed by Western blot (Fig. 7). In order to verify peroxisomal localization, both KatG and the peroxisomal marker protein 3-ketoacyl-CoA-thiolase (EC 2.3.1.16) (Goh et al. 2011; Lee et al. 2009) were probed by polyclonal anti-KatG (Fig. 7b) and anti-Fox3 antibodies (Fig. 7c), respectively. With both organisms (Ch. globosum and Ch. cochliodes), the two antibodies were bound to proteins from the same fraction at ~83 kDa (KatG) and ~59 kDa (molar mass of peroxisomal thiolase subunit according to UniProt Entry G3MEU1) (Fig. 7b, c).
Fig. 7.
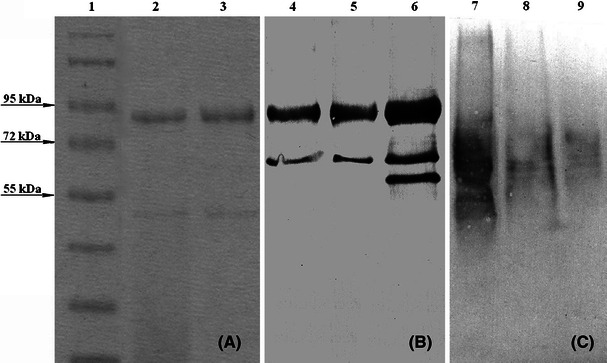
SDS-PAGE (10 %) and Western blot of peroxisomal fractions (from sucrose gradient centrifugation) of Chaetomium samples. a Coomassie brilliant blue stain; b Western blot with anti-KatG antibody; c Western blot with anti-Fox3 antibody. Lanes: 1—molecular weight standard (Fermentas), 2—Ch. cochliodes CCMF232 gradient fraction 5–6, 3—Ch. globosum gradient fraction 5–6, 4 - Ch. cochliodes CCMF232 gradient fraction 5-6, 5 – Ch. globosum gradient fraction 5-6, 6 – M. grisea affinity purified KatG1, 7 – Ch. globosum gradient fraction 5-6, 8 – fraction 7-8, 9 – fraction 9-10 of the same sucrose gradient as in lane 3
Furthermore, the co-localization of thiolase and KatG1 in peroxisomes of fungi could be confirmed by immunofluorescence microscopy and double-staining for localization of KatG1 and thiolase (Fig. 8). Additionally, we tested induction of formation of peroxisomes by addition of 0.1 % (v/v) oleic acid. Here a different behavior of Magnaporthe and Chaetomia in various growth media could be observed. Whereas, for Magnaporthe grisea, a clear difference between noninduced and oleic acid-induced sample is obvious (Fig. 8a, b), in case of Ch. cochliodes and Ch. globosum, no increase in the number of peroxisomes occurred (Fig. 8c–e). This is also consistent with recorded activity profiles (Fig. 4b and (Zamocky et al. 2009a). Increased formation of peroxisomes and their matrix proteins in phytopathogenic M. grisea in oleic acid-enriched medium could be explained by direct involvement of a lipid component (i.e., glycerol) in the first steps of pathogenic invasion in rice tissue, namely during formation of the specialized infection structure, the appressorium (Caracuel-Rios and Talbot 2007; Goh et al. 2011).
Fig. 8.
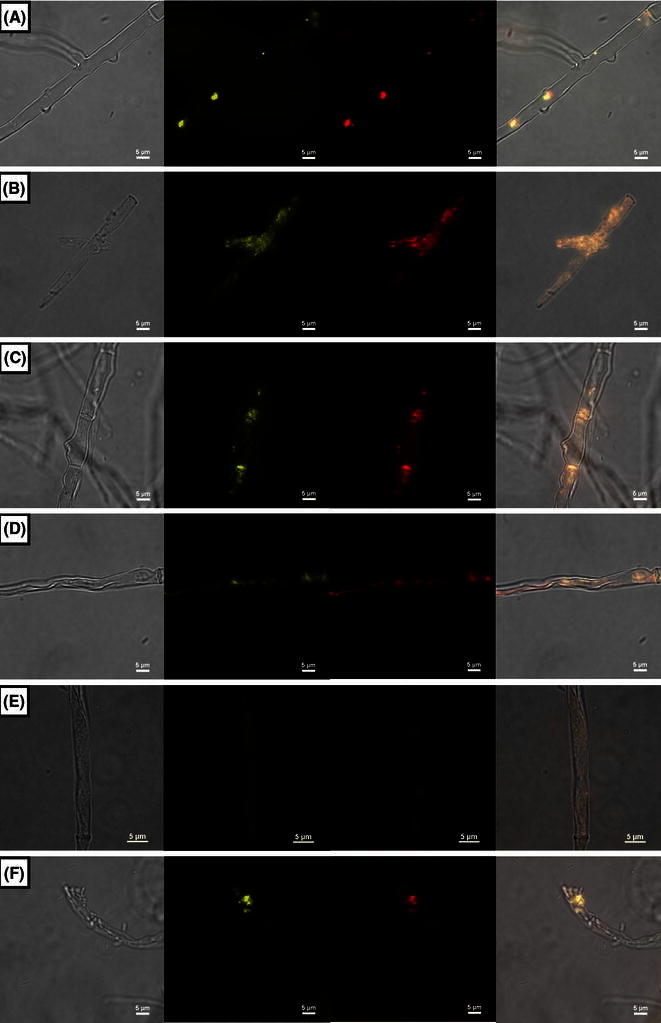
Co-localization of KatG and 3-ketoacyl-CoA thiolase detected with immunofluorescence microscopy. A, B – Magnaporthe grisea; C,D – Chaetomium cochliodes; E,F- Chaetomium globosum. A,C,E – noninduced samples; B,D,F – samples after induction with oleic acid. Presentation of panels from left to right: bright field (no fluorescence), FITC channel, TRITC channel, merged picture, respectively
For MagKatG1 the co-localization data also support the presence of a short intron predicted on the C-terminus, which is rare for fungal katG1 genes. The PTS1 signal is located on the short exon 2. Previous biochemical characterization (Zamocky et al. 2009a) was performed without C-terminal exon 2, suggesting that it has no impact on the overall catalase and peroxidases activity of the purified protein.
Summing up, intracellular fungal catalase-peroxidases (KatG1s) are constitutively expressed and even upon addition of oxidative stressors, the mRNA concentration of katG1 as well as the bifunctional activity remain at a constant level. In prokaryotes, KatGs are located in the cytosol, whereas, in eukaryotic organisms, two signals target these bifunctional metalloenzymes to peroxisomes. This was so far described for monofunctional (typical) catalases that often represent the major protein in peroxisomes. Their apparent role is efficient decomposition of hydrogen peroxide (Ozimek et al. 2005; Pollegioni et al. 2007). Most probably, KatG1 plays a similar role because of its unique and efficient catalatic activity. Fungi are known to have a broad armory of enzymes especially in oxidative defence reactions and thus some fungi apparently have both catalases and catalase-peroxidases located in peroxisomes for H2O2 degradation. Remains the question of the role of the relatively unspecific peroxidase activity of KatG1 (Smulevich et al. 2006; Zamocky et al. 2008). Generally, there is no significant difference between prokaryotic and eukaryotic KatGs, suggesting that the putative endogenous one-electron donor is not a metabolite specific for a distinct prokaryotic or eukaryotic metabolic pathway.
Electronic supplementary material
Below is the link to the electronic supplementary material.
A typical profile of real-time PCR obtained with 7900HT Fast Real-Time PCR System from Applied Biosystems. Combination of primers CgkatGrtFWD1 & CgkatGrtREV1 was used for these samples (PDF 1838 kb)
Complete multiple sequence alignment of twenty ascomycetous catalase-peroxidases (KatGs) obtained with ClustalX. Color scheme is the same as in Fig. 6 (PDF 131 kb)
Acknowledgments
Our investigations were supported by grant VEGA 2/0149/11 from the Slovak grant agency and by the Austrian Science Foundation (FWF projects P20996-B11, P20605-B12) and Research & Development Operational Program funded by the ERDF No. 26240220010. We thank Prof. Andreas Hartig for support on PTS1 analysis and Dr. Markus Kunze for support on PTS2 analysis.
Abbreviations
- BSA
Bovine serum albumin
- Ch. globosum
Chaetomium globosum
- Ch. cochliodes
Chaetomium cochliodes
- DAB
3,3′-diaminobenzidine tetrachloride
- Fox3
Yeast 3-ketoacyl-CoA-thiolase
- HGT
Horizontal gene transfer
- KatG1
Intracellular catalase-peroxidase
- KatG2
Secreted (extracellular) catalase-peroxidase
- M. grisea
Magnaporthe grisea
- ORF
Open reading frame
- PAA
Peroxyacetic acid
- PMSF
Phenylmethyl sulfonyl fluoride
- PQ
Paraquat
- PTS1
Peroxisomal targeting signal 1
- PTS2
Peroxisomal targeting signal 2
- TCA
Trichloroacetic acid
References
- Bourdais A, Bidard F, Zickler D, Berteaux-Lecellier V, Silar P, Espagne E. Wood utilization is dependent on catalase activities in the filamentous fungus Podospora anserina. PLoS ONE. 2012;7:e29280. doi: 10.1371/journal.pone.0029820. [DOI] [PMC free article] [PubMed] [Google Scholar]
- Caracuel-Rios Z, Talbot NJ. Cellular differentiation and host invasion by the rice blast fungus Magnaporthe grisea. Curr Opin Microbiol. 2007;10:339–345. doi: 10.1016/j.mib.2007.05.019. [DOI] [PubMed] [Google Scholar]
- Gabaldón T. Peroxisome diversity and evolution. Phil Trans R Soc B. 2011;365:765–773. doi: 10.1098/rstb.2009.0240. [DOI] [PMC free article] [PubMed] [Google Scholar]
- Goh J, Jeon J, Kim KS, Park J, Park SY, Lee YH. The PEX7-mediated peroxisomal import system is required for fungal development and pathogenicity in Magnaporthe oryzae. PLoS ONE. 2011;6:e28220. doi: 10.1371/journal.pone.0028220. [DOI] [PMC free article] [PubMed] [Google Scholar]
- Kiel JA, Hilbrands RE, Bovenberg RAL, Veenhuis M. Isolation of Penicillium chrysogenum PEX1 and PEX6 encoding AAA proteins involved in peroxisome biogenesis. Appl Microbiol Biotechnol. 2000;54:238–242. doi: 10.1007/s002530000378. [DOI] [PubMed] [Google Scholar]
- Kiel JA, van den Berg MA, Fusetti F, Poolman B, Bovenberg RAL, Veenhuis M, van der Klei IJ. Matching the proteome to the genome: the microbody of penicillin- producing Penicillium chrysogenum cells. Funct Integr Genomics. 2009;9:167–184. doi: 10.1007/s10142-009-0110-6. [DOI] [PubMed] [Google Scholar]
- Klotz M, Loewen PC. The molecular evolution of catalatic hydroperoxidases: evidence for multiple lateral transfer of genes between prokaryota and form bacteria into eukaryota. Mol Biol Evol. 2003;20:1098–1112. doi: 10.1093/molbev/msg129. [DOI] [PubMed] [Google Scholar]
- Kragler F, Langeder A, Raupachová J, Binder M, Hartig A. Two independent peroxisomal targeting signals in catalase A of Saccharomyces cerevisiae. J Cell Biol. 1993;120:665–673. doi: 10.1083/jcb.120.3.665. [DOI] [PMC free article] [PubMed] [Google Scholar]
- Kunze M, Neuberger G, Maurer-Stroh S, Ma J, Eck T, Braverman N, Schmid J, Eisenhaber F, Berger J. Structural requirements for the interaction of peroxisomal targeting signal 2 and its receptor PEX7. J Biol Chem. 2011;286:45048–45062. doi: 10.1074/jbc.M111.301853. [DOI] [PMC free article] [PubMed] [Google Scholar]
- Larkin MA, Blackshields G, Brown NP, Chenna R, McGettigan PA, McWilliam H, Valentin F, Wallace IM, Wilm A. Clustal W and Clustal X version 2.0. Bioinformatics. 2007;23:2947–2948. doi: 10.1093/bioinformatics/btm404. [DOI] [PubMed] [Google Scholar]
- Lee JR, Kim SY, Chae HB, Jung JH, Lee SY. Antifungal activity of Saccharomyces cerevisiae peroxisomal 3-ketoacyl-CoA thiolase. BMB reports. 2009;42:281–285. doi: 10.5483/BMBRep.2009.42.5.281. [DOI] [PubMed] [Google Scholar]
- Matsumoto T, Tanaka T, Sakai H, Amano N, Kanamori H, Kurita K, Kikuta A, Kamiya K, Yamamoto M, et al. Comprehensive sequence analysis of 24,783 barley full-length cDNAs derived from 12 clone libraries. Plant Physiol. 2011;156:20–28. doi: 10.1104/pp.110.171579. [DOI] [PMC free article] [PubMed] [Google Scholar]
- McGuffin LJ, Bryson K, Jones DT. The PSIPRED protein structure prediction server. Bioinformatics. 2000;16:404–405. doi: 10.1093/bioinformatics/16.4.404. [DOI] [PubMed] [Google Scholar]
- Neuberger G, Maurer-Stroh S, Eisenhaber B, Hartig A, Eisenhaber F. Prediction of peroxisomal targeting signal 1 containing proteins from amino acid sequence. J Mol Biol. 2003;328:581–592. doi: 10.1016/S0022-2836(03)00319-X. [DOI] [PubMed] [Google Scholar]
- Ozimek P, Veenhuis M, van der Klei IJ. Alcohol oxidase: a complex peroxisomal, oligomeric flavoprotein. FEMS Yeast Res. 2005;5:975–983. doi: 10.1016/j.femsyr.2005.06.005. [DOI] [PubMed] [Google Scholar]
- Pangallo D, Chovanová K, Simonovicová A, Ferianc P. Investigation of microbial community isolated from indoor artworks and air environment: identification, biodegradative abilities, and DNA typing. Can J Microbiol. 2009;55:277–287. doi: 10.1139/w08-136. [DOI] [PubMed] [Google Scholar]
- Peraza L, Hansberg W. Neurospora crassa catalases, singlet oxygen, and cell differentiation. Biol Chem. 2002;383:569–575. doi: 10.1515/BC.2002.058. [DOI] [PubMed] [Google Scholar]
- Pollegioni L, Piubelli L, Sacchi S, Pilone MS, Molla G. Physiological functions of D-amino acid oxidases: from yeast to humans. Cell Mol Life Sci. 2007;64:1373–1394. doi: 10.1007/s00018-007-6558-4. [DOI] [PMC free article] [PubMed] [Google Scholar]
- Roggenkamp R, Sahm J, Wagner F. Microbial assimilation of methanol and function of catalase in Candida boidinii. FEBS Lett. 1974;41:283–286. doi: 10.1016/0014-5793(74)81230-5. [DOI] [PubMed] [Google Scholar]
- Schlüter A, Real-Chicharro A, Gabaldón T, Sanchez-Jimenez F, Pujol A. PeroxisomeDB 2.0: an integrative view of the global peroxisomal metabolome. Nucleic Acids Res. 2010;38:D800–D805. doi: 10.1093/nar/gkp935. [DOI] [PMC free article] [PubMed] [Google Scholar]
- Smulevich G, Jakopitsch C, Droghetti E, Obinger C. Probing the structure and bifunctionality of catalase-peroxidase (KatG) J Inorg Biochem. 2006;100:568–585. doi: 10.1016/j.jinorgbio.2006.01.033. [DOI] [PubMed] [Google Scholar]
- Wayne LG, Diaz GA. A double staining method for differentiating between two classes of mycobacterial catalase in polyacrylamide electrophoresis gels. Anal Biochem. 1986;157:89–92. doi: 10.1016/0003-2697(86)90200-9. [DOI] [PubMed] [Google Scholar]
- Woodbury WA, Spencer K, Stahlmann MA. An improved procedure using ferricyanide for detecting catalase isozymes. Anal Biochem. 1971;44:301–305. doi: 10.1016/0003-2697(71)90375-7. [DOI] [PubMed] [Google Scholar]
- Zamocky M, Obinger C. Molecular phylogeny of heme peroxidases. In: Ayala M, Torres E, editors. Biocatalysis Based on Heme Peroxidases. New York: Springer; 2010. [Google Scholar]
- Zamocky M, Furtmüller PG, Obinger C. Evolution of catalases from bacteria to humans. Antioxid Redox Signal. 2008;10:1527–1547. doi: 10.1089/ars.2008.2046. [DOI] [PMC free article] [PubMed] [Google Scholar]
- Zamocky M, Furtmüller PG, Bellei M, Battistuzzi G, Stadlmann J, Vlasits J, Obinger C. Intracellular catalase/peroxidase from the phytopathogenic rice blast fungus Magnaporthe grisea: expression analysis and biochemical characterization of the recombinant protein. Biochem J. 2009;418:443–451. doi: 10.1042/BJ20081478. [DOI] [PubMed] [Google Scholar]
- Zamocky M, Furtmüller PG, Obinger C. Two distinct groups of fungal catalase/peroxidases. Bioch Soc Trans. 2009;37:772–777. doi: 10.1042/BST0370772. [DOI] [PMC free article] [PubMed] [Google Scholar]
- Zamocky M, Furtmüller PG, Obinger C. Evolution of structure and function of Class I peroxidases. Arch Biochem Biophys. 2010;500:45–57. doi: 10.1016/j.abb.2010.03.024. [DOI] [PubMed] [Google Scholar]
- Zamocky M, Gasselhuber B, Furtmüller PG, Obinger C. Molecular evolution of hydrogen peroxide degrading enzymes. Arch Biochem Biophys. 2012;525:131–144. doi: 10.1016/j.abb.2012.01.017. [DOI] [PMC free article] [PubMed] [Google Scholar]
- Zamocky M, Droghetti E, Bellei M, Gasselhuber B, Pabst M, Furtmüller PG, Battistuzzi G, Smulevich G, Obinger C. Eukaryotic extracellular catalase-peroxidase from Magnaporthe grisea—Biophysical/chemical characterization of the first representative from a novel phytopathogenic KatG group. Biochimie. 2012;94:673–683. doi: 10.1016/j.biochi.2011.09.020. [DOI] [PMC free article] [PubMed] [Google Scholar]
- Zou P, Schrempf H. The heme independent manganese peroxidase activity depends on the presence of the C-terminal domain within the Streptomyces reticuli catalase-peroxidase. Eur J Biochem. 2000;267:2840–2849. doi: 10.1046/j.1432-1327.2000.01259.x. [DOI] [PubMed] [Google Scholar]
Associated Data
This section collects any data citations, data availability statements, or supplementary materials included in this article.
Supplementary Materials
A typical profile of real-time PCR obtained with 7900HT Fast Real-Time PCR System from Applied Biosystems. Combination of primers CgkatGrtFWD1 & CgkatGrtREV1 was used for these samples (PDF 1838 kb)
Complete multiple sequence alignment of twenty ascomycetous catalase-peroxidases (KatGs) obtained with ClustalX. Color scheme is the same as in Fig. 6 (PDF 131 kb)


