

Abstract
Background
Huanglongbing (HLB) is a highly destructive citrus disease which threatens citrus production worldwide and ‘Candidatus Liberibacter asiaticus’ (Las), a non-culturable phloem-limited bacterium, is an associated causal agent of the disease. To better understand the physiological and molecular processes involved in host responses to Las, 2-DE and mass spectrometry analyses, as well as ICP spectroscopy analysis were employed to elucidate the global protein expression profiles and nutrient concentrations in leaves of Las-infected grapefruit plants at pre-symptomatic or symptomatic stages for HLB.
Results
This study identified 123 protein spots out of 191 spots that showed significant changes in the leaves of grapefruit plants in response to Las infection and all identified spots matched to 69 unique proteins/peptides. A down-regulation of 56 proteins including those associated with photosynthesis, protein synthesis, and metabolism was correlated with significant reductions in the concentrations of Ca, Mg, Fe, Zn, Mn, and Cu in leaves of grapefruit plants in response to Las infection, particularly in symptomatic plants. Oxygen-evolving enhancer (OEE) proteins, a PSI 9 kDa protein, and a Btf3-like protein were among a small group of proteins that were down-regulated in both pre-symptomatic and symptomatic plants in response to Las infection. Furthermore, a Las-mediated up-regulation of 13 grapefruit proteins was detected, which included Cu/Zn superoxide dismutase, chitinases, lectin-related proteins, miraculin-like proteins, peroxiredoxins and a CAP 160 protein. Interestingly, a Las-mediated up-regulation of granule-bound starch synthase was correlated with an increase in the K concentrations of pre-symptomatic and symptomatic plants.
Conclusions
This study constitutes the first attempt to characterize the interrelationships between protein expression and nutritional status of Las-infected pre-symptomatic or symptomatic grapefruit plants and sheds light on the physiological and molecular mechanisms associated with HLB disease development.
Keywords: Grapefruit, Huanglongbing, Proteomics, Nutrients, Host response
Background
Citrus Huanglongbing (HLB) or citrus greening disease is considered to be one of the most devastating diseases threatening citrus production worldwide, and all cultivated citrus species are susceptible or highly susceptible to the disease [1,2]. Orchard trees usually die in about 3–8 years after becoming symptomatic and yield losses of up to 65% have been reported [3]. Typically observed symptoms include asymmetric blotchy mottling and chlorosis of matured leaves, twig-dieback, small and misshapen fruits unsuitable for sale as fresh fruit or for juice; starch accumulation and phloem damage [1,2,4].
HLB was first reported in Asian countries in the 1870s [5]. Although Koch’s postulates are yet to be determined, the etiology of the disease has been associated with ‘Candidatus Liberibacter spp.’, a member of gram-negative, fastidious, phloem-limited α-proteobacteria. Taxonomically, there are three HLB-associated species namely, ‘Candidatus Liberibacter asiaticus’ (Las), ‘Ca. L. africanus’ and ‘Ca. L. americanus’ [1,2], which is based on their presumptive origins from the Asian, African and American continents, respectively, as well as distinctive 16S rDNA sequences. Among these three Liberibacter species, Las-associated HLB is the most prevalent and has been associated with increasing economic losses to citrus production worldwide [1,2]. Las is transmitted by and disseminated naturally by the Asian citrus psyllid (Diaphorina citri). In addition, there is a significantly extended latency period between times of infection and symptom development, which greatly complicates control strategies [2], making it crucial to develop fast, reliable and efficient methods for early detection of infected plants.
An important aspect of disease-associated plant-microbe interactions are the host responses induced at pre-symptomatic and symptomatic stages of disease development [6]. Identification of the host responses especially at the infection or pre-symptomatic stage can be critical towards understanding the initial processes involved in disease development and could be exploited in the formulation of efficient disease management practices [7-9]. High-throughput “omics” analyses provide fast, economical, efficient and holistic methods of understanding the molecular responses of biological systems to biotic and abiotic stress [10-12]. At least three separate but complementary transcriptomics studies using microarray technology have been performed to elucidate the effect of Las infection on the total mRNA expression levels in tissues of sweet orange (Citrus sinensis) plants [4,13,14]. However, differential gene expression at the transcriptional (mRNA) level do not necessarily correlate with differential gene expression at the translational (protein) level as posttranscriptional translational and/or posttranslational modifications; alternative splicing of mRNA transcripts; and mRNA stability and interference factors play important roles in regulating gene expression [15-18]. Proteins are the final products of gene expression and their expression levels directly correlate with cellular function. Thus, in order to fully understand the molecular mechanisms involved in the response of citrus plants to Las-infection, it is imperative to inquire beyond the transcriptional level and into the proteomic level of gene expression.
Furthermore, disease symptoms frequently reflect the altered nutritional status of plants and nutrient-disease interactions are well documented in plant systems [19]. A malfunctioning or blocked vascular system such as that implicated in HLB-disease development [4,13] can induce a systemic or localized nutrient sufficiency or deficiency. Physiological symptoms of HLB is suggested to resemble that of Zn-deficiency [20] and the productive life of diseased plants, including HLB-affected plants, has been shown to be extendable by fertilizer application [19,21]. Nutrient homeostasis forms part of a delicately balanced interdependent system with plant gene regulation; however, there is limited information on the relationships between the nutritional status and protein expression profiles of citrus plants during HLB development.
In this study we used a proteomic approach based on two-dimensional electrophoresis (2-DE) and mass spectrometry to characterize the comparative changes in the total leaf proteomes of Las-infected grapefruit plants that are pre-symptomatic or symptomatic for HLB. Inductively-coupled plasma (ICP) spectroscopy was also employed to resolve the nutrient concentrations in leaves of the same set of Las-infected leaf samples. Our results highlight molecular and physiological processes associated with HLB disease development.
Results and discussion
Effects of Las-infection on the leaf protein profile of pre-symptomatic and symptomatic grapefruit plants
There was no visible difference in leaf morphology between the uninfected control for pre-symptomatic (UP) plants and the infected pre-symptomatic (IP) plants but the uninfected control for symptomatic (US) plants was visibly different from the infected symptomatic (IS) plants (Figure 1). A total protein yield of over 10 mg g-1 was extracted from leaves and there was no significant difference in the total protein yield across treatments (Additional file 1: Table S1). A high resolution 2-DE separation of total leaf proteins from grapefruit plants was visualized in a pI range of 4–7 and Mr range of 10,000 -150,000 (Additional file 2: Figure S1). Using PDQuest analysis software, over 700 spots per gel and over 440 reproducible spots within replicate gels were detected (Additional file 1: Table S1). Out of 191 differentially produced spots detected by PDQuest analysis, mass spectrometry analysis via MALDI-TOF- or LC-MS identified 123, which according to identical protein matches and spot proximity on the gel was summarized into 97 spots (Figure 2). A magnified view of the profiles of identified spots in representative gels from each treatment group is shown in Additional file 3: Figure S2.
Figure 1.

Morphological characterization of grapefruit plants infected or uninfected with Las and pre-symptomatic or symptomatic for huanglongbing. (A) Representative plant of uninfected control for pre-symptomatic (UP) plants; (B) Representative plant of infected pre-symptomatic (IP) plants; (C) Representative plant of uninfected control for symptomatic (US) plants; (D) Representative plant of infected symptomatic (IS) plants. Two-year old healthy plants were either graft-inoculated with side shoots from PCR-confirmed Las-infected bud sticks or uninoculated and leaf samples were analyzed at three months post-inoculation (for pre-symptomatic plants) or six months post-inoculation (for symptomatic plants).
Figure 2.
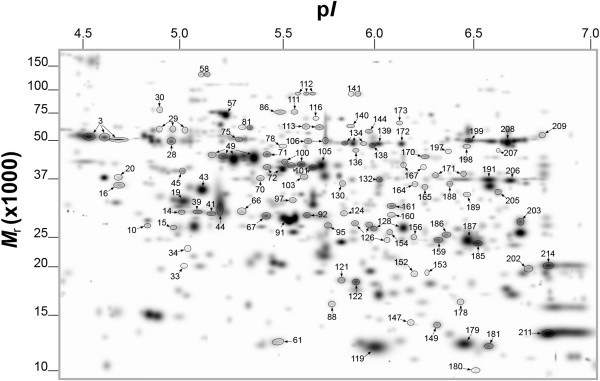
PDQuest-generated master gel image showing the general pattern of matched protein spots from the total leaf proteome of grapefruit plants that were Las-infected or uninfected and pre-symptomatic or symptomatic for HLB. Labeled protein spots were differentially produced in response to Las-infection and described in Tables 1, 2, and 3. Two-year old healthy plants were either graft-inoculated with side shoots from PCR-confirmed Las-infected bud sticks or uninoculated and leaf samples were analyzed at three months post-inoculation (for pre-symptomatic plants) or six months post-inoculation (for symptomatic plants). A total of 200 μg of protein was loaded on a pH 4–7 IpG strip and protein spots were visualized by staining with Coomassie Brilliant Blue (CBB). Mr, relative molecular weight; pI, isoelectric point.
In certain instances more than one spot was matched to a given protein, which as previously suggested, could be due to a combination of factors including multimerism/protein isoforms, maturation state, degradation and/or post-translational modifications [15,16]. Furthermore, although majority of the differential protein expression identified in this study was induced by Las infection, in certain instances, we observed a significant difference in protein expression between the uninfected control for pre-symptomatic (UP) plants and the uninfected control for symptomatic (US) plants (example see Table 1, spots 86 and 205). This could be due to developmental difference in leaf age between UP and US plants, which is supported by results from previous reports [22,23].
Table 1.
Other identified proteins in citrus grapefruit leaves that were down-accumulated in response to Las-infection
| Spota |
ASVb |
Protein function/namec | Accession #c |
Theoreticald |
Se | Mf | Eg | |
|---|---|---|---|---|---|---|---|---|
| UP IP US IS | Mr | pI | ||||||
| |
|
Energy/Metabolisms |
|
|
|
|
|
|
| 121 |
 |
Putative thioredoxin-dependent peroxidase |
gi|119367465 |
17443 |
5.15 |
119 |
7 |
70 |
| 128 |
 |
Ascorbate peroxidase 2 |
gi|221327589 |
27724 |
5.55 |
162 |
15 |
74 |
| 161 |
 |
L-ascorbate peroxidase T, chloroplastic-like isoform 2 |
gi|359492510 |
42300 |
8.61 |
223 |
18 |
50 |
| 188 |
 |
Coproporphyrinogen III oxidase, putative |
gi|255554717 |
39324 |
7.66 |
162 |
17 |
47 |
| 189h |
 |
Isoflavone reductase related protein |
gi|3243234 |
34281 |
5.92 |
54 |
4 |
19 |
| 205 |
 |
Cinnamoyl-CoA reductase, putative |
gi|255556687 |
35554 |
6.16 |
67 |
9 |
39 |
| 209 |
 |
Catalase |
gi|19070130 |
57669 |
6.64 |
110 |
13 |
35 |
| |
|
Regulation/Protein synthesis |
|
|
|
|
|
|
| 16 |
 |
31 kDa ribonucleoprotein, chloroplastic |
gi|225456840 |
38020 |
4.55 |
64 |
8 |
29 |
| 58 |
 |
Elongation factor Ts |
gi|357500731 |
82705 |
4.68 |
77 |
11 |
23 |
| 97 |
 |
Proteasome subunit alpha type, putative |
gi|255538698 |
29940 |
5.15 |
109 |
10 |
49 |
| 100 |
 |
Glutamine synthetase plant, putative |
gi|255551511 |
48172 |
6.29 |
183 |
21 |
68 |
| 105 |
 |
Glutamine synthetase plant, putative |
gi|255551511 |
48172 |
6.29 |
218 |
17 |
59 |
| 116 |
 |
ATP-dependent zinc metalloprotease FTSH 2, chloroplastic-like |
gi|225446693 |
75921 |
6.44 |
197 |
28 |
51 |
| 136 |
 |
26S protease regulatory subunit 6b, putative |
gi|255565346 |
44701 |
5.49 |
69 |
9 |
30 |
| 138 |
 |
Mitochondrial processing peptidase alpha subunit, putative |
gi|255546263 |
50379 |
5.91 |
163 |
20 |
58 |
| 149 |
 |
Nucleoside diphosphate kinase 1 |
gi|19570344 |
16349 |
5.93 |
80 |
7 |
56 |
| 152h |
 |
Transcription factor homolog (Btf3-like) protein |
gi|33945882 |
17821 |
5.93 |
61 |
3 |
35 |
| 165 |
 |
Serine-type peptidase |
gi|270342123 |
46267 |
8.24 |
128 |
8 |
30 |
| 170 |
 |
S-adenosylmethionine synthetase, putative |
gi|255548295 |
43620 |
5.65 |
217 |
26 |
71 |
| 178 |
 |
Nucleoside diphosphate kinase, putative |
gi|255540363 |
14819 |
6.92 |
68 |
4 |
35 |
| 185 |
 |
DHAR class glutathione transferase DHAR2 |
gi|283135906 |
23962 |
6.18 |
110 |
8 |
45 |
| 198 |
 |
Alanine aminotransferase 2 isoform 2 |
gi|359495900 |
54000 |
6.00 |
92 |
13 |
34 |
| 206 |
 |
mRNA binding protein precursor |
gi|350534514 |
43638 |
7.70 |
97 |
14 |
51 |
| 207 |
 |
Alanine aminotransferase 2 isoform 2 |
gi|359495900 |
54000 |
6.00 |
188 |
24 |
57 |
| |
|
Chaperones |
|
|
|
|
|
|
| 10h |
 |
Putative FKBP-type peptidyl-prolyl cis-trans isomerase |
gi|51471872 |
22889 |
4.78 |
46 |
6 |
35 |
| 30 |
 |
Heat shock protein, putative |
gi|255555659 |
73678 |
5.10 |
96 |
13 |
22 |
| 45 |
 |
Peptidyl-prolyl cis-trans isomerase, putative |
gi|255552604 |
48362 |
5.04 |
99 |
14 |
36 |
| 57 |
 |
Chloroplast HSP70 |
gi|124245039 |
76759 |
5.31 |
168 |
22 |
35 |
| 81 |
 |
Chaperonin-60alpha |
gi|15226314 |
55491 |
4.86 |
210 |
22 |
60 |
| 86 |
 |
Heat shock protein 70 |
gi|211906496 |
71346 |
5.10 |
118 |
22 |
47 |
| 111 |
 |
70 kDa heat shock cognate protein 1 |
gi|45331281 |
71381 |
5.11 |
75 |
9 |
21 |
| 140 |
 |
Chaperonin-60kD, ch60, putative |
gi|255554262 |
56809 |
5.19 |
79 |
12 |
32 |
| |
|
Unknown |
|
|
|
|
|
|
| 144 |
 |
Uncharacterized protein |
gi|225443738 |
66158 |
8.50 |
78 |
7 |
20 |
| 197 |  |
Hypothetical protein VITISV_021486 | gi|147834040 | 44041 | 5.98 | 68 | 7 | 24 |
a The spot numbers correspond to the numbers given in Figure 2 and Additional file 3: Figure S2.
b Average spot volume per treatment group; UP, uninfected reference for pre-symptomatic plants; IP, infected pre-symptomatic plants; US, uninfected reference for symptomatic plants; IS, infected symptomatic plants. Average spot volumes separated by letters to show significant difference are presented in Additional file 6: Appendix S1.
c Protein function/name was determined by http://www.ncbi.nlm.nih.gov/BLAST/.
d Theoretical relative molecular weight (Mr) and isoelectric point (pI) were calculated by http://www.expasy.org/. Observed Mr and pI can be extrapolated from Figure 1.
e Mascot score of protein hit.
f Number of matched peptide masses. The sequences of PMF-matched peptides per spot are provided in Additional file 7: Appendix S2.
g Percent sequence coverage of matched peptides.
h Protein identification confirmed by MALDI-TOF-MS/MS. Sequencing information is provided in Additional file 7: Appendix S2.
i Protein identification confirmed by LC-MS/MS.
The differentially expressed 97 protein spots presented in Figure 2 matched to 69 proteins/peptides (Additional file 4: Table S2) and were broadly grouped into six categories according to putative physiological functions (Figure 3A) namely: (i) CO2 assimilation/photosynthesis-related (16.3%), (ii) redox homeostasis-related (9.2%), (iii) regulation/protein synthesis-related (18.4%), (iv) pathogen response-related (20.4%), (v) chaperones (8.2%), and (vi) energy/metabolisms-related (25.5%). Among the identified protein spots, the volumes of 27 spots significantly changed (16 up-accumulated and 11 down-accumulated) in infected pre-symptomatic (IP) plants compared to UP plants, while the volumes of 92 spots significantly changed (21 up-accumulated and 71 down-accumulated) in infected symptomatic (IS) plants compared to US plants (Figure 3B). Additionally, the volumes of 30 spots significantly changed (12 up-accumulated and 18 down-accumulated) in US plants compared to UP plants, while the volumes of 87 spots significantly changed (17 up-accumulated and 70 down-accumulated) in IS plants compared to IP plants (Figure 3B). The spots that were differentially produced according to treatment comparisons described in Figure 3B are presented in Additional file 5: Table S3. A ranking of the most increased or up-regulated to the most decreased or down-regulated protein in IP or IS plants compared to UP or US plants, respectively, shows that pathogen response-related proteins showed the most increase in fold change in response to Las infection while photosynthesis-related proteins showed the most decrease in response to Las infection (Figure 4). Average spot volumes separated by letters to show significant difference are presented in Additional file 6: Appendix S1, while the sequences of PMF-matched peptides per spot are provided in Additional file 7: Appendix S2.
Figure 3.
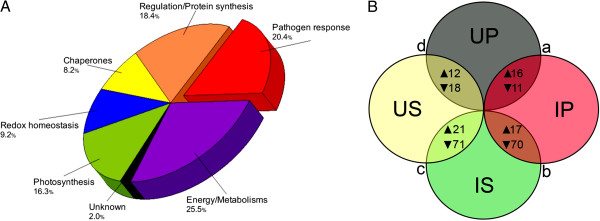
Categorization of differentially produced proteins in grapefruit plants in response to Las-infection. (A) Functional category distribution of all identified differentially produced protein spots from comparing 2-DE gel images of the total leaf proteome of grapefruit plants that were Las-infected or uninfected and symptomatic or pre-symptomatic for HLB. (B) Venn diagram with intersections a, b, c and d, showing the number of identified protein spots that were significantly up- (▲) or down- (▼) regulated in (a) infected pre-symptomatic (IP) plants compared to uninfected control for pre-symptomatic (UP) plants; (b) infected symptomatic (IS) plants compared to IP plants; (c) IS plants compared to uninfected control for symptomatic (US) plants; (d) US plants compared to UP plants.
Figure 4.

A sorted categorization of differentially produced proteins in grapefruit plants in response to Las-infection. (A) Sorting of the most increased or up-regulated proteins (green bars) to the most decreased or down-regulated proteins (red bars) in IP plants compared to UP plants. (B) Sorting of the 20 most increased proteins and 20 most decreased proteins in IS plants compared to US plants. The actual fold increase or decrease (−) is presented on the right or left side of green or red bars, respectively, and can also be extrapolated from Additional file 6 Appendix S1. Bars with “on” or “off” represent proteins that were “only detected” or “not detected”, respectively, in IP plants compared to UP plants or in IS plants compared to US plants. UP refer to uninfected control for pre-symptomatic plants. IP refers to infected pre-symptomatic plants. US refers to uninfected control for symptomatic plants. IS refers to infected symptomatic plants.
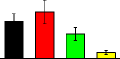
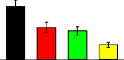
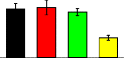
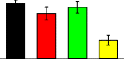
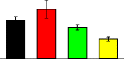
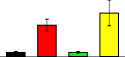
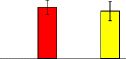
Effects of Las-infection on the nutrient status of pre-symptomatic and symptomatic grapefruit plants
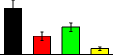
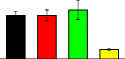
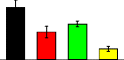
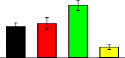
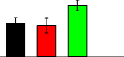
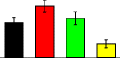
HLB symptoms are similar to those of Zn-deficiency [20] and the life expectancy of HLB-affected plants may be extendable by fertilizer application [21]. Additionally, plant nutrients are actively involved in gene regulation and several metabolically active proteins form co-enzymes with nutrients, which prompted our inquiry into the effects of HLB on the nutrient status of grapefruit plants in tandem with our proteomic analyses. In this study, Las infection was accompanied by a general reduction in the concentrations of Ca, Mg, Fe, Mn, Zn and Cu in leaves of grapefruit plants (Figure 5). However, the concentrations of Ca, Mg, and Mn were not significantly reduced in IP plants compared to UP plants but the concentrations of Fe, Zn and Cu showed significant 49%, 35% and 34% reductions, respectively, in IP plants compared to UP plants (Figure 5). This suggests an early inhibition of micronutrient availability in leaves of citrus plants during HLB disease development and is congruent with Zn-deficiency-like symptoms observed in HLB-affected plants [20]. Interestingly, the concentration of K was increased by 12% (P > 0.05) and 21% (P < 0.05) in IP and IS plants, respectively, compared to their corresponding control plants (Figure 5). Nutrient-disease interactions in plants have been well documented [19]. Low Ca in plant tissues was associated with susceptibility to macerating diseases caused by Erwinia carotovora, Fusarium solani, Pythium myriotylum, Rhizoctonia solani, Sclerotinia minor, and Sclerotium rolfsii[19]. Wheat tissues with higher Zn concentrations were shown to be less susceptible to spring blight [24]. Since the nutrients analyzed in this study are known to be directly involved in the regulation of plant metabolic processes, including protein expression, the potential consequences of Las-mediated effects on the nutrient status of grapefruit plants are further discussed below in relation with Las-mediated regulation of protein expression.
Figure 5.
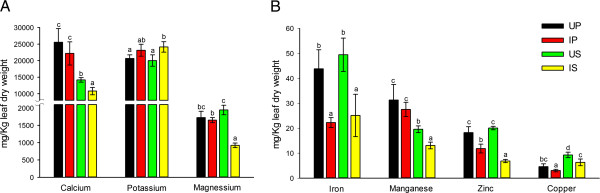
The concentrations of macro- and micro-nutrients in leaves of grapefruit plants that were Las-infected or uninfected and pre-symptomatic or symptomatic for HLB. (A) macronutrients calcium, potassium and magnesium; (B) micronutrients iron, manganese, zinc, and copper. UP, uninfected control for pre-symptomatic plants; IP, infected pre-symptomatic plants; US, uninfected control for symptomatic plants; IS, infected symptomatic plants. Two-year old healthy plants were either graft-inoculated with side shoots from PCR-confirmed Las-infected bud sticks or uninoculated and leaf samples were analyzed at three months post-inoculation (for pre-symptomatic plants) or six months post-inoculation (for symptomatic plants). Bars within an elemental group with the same lower case letter are not significantly different from each other (P > 0.05).
CO2 Assimilation/photosynthesis
We observed a significant down-accumulation of ribulose-1, 5-bisphosphate carboxylase oxygenase (RuBisCO) (Table 2,spots 3, 28, 208 and 211), RuBisCO activase (Table 2, spots 49, 71, 72, and 101), carbonic anhydrase (Table 2, spots 126, 159), a photosystem (PS) II stability assembly factor HCF136 (Table 2, spot 164) in IS plants compared to US plants but not in IP plants compared to UP plants. This suggests that these proteins are not initially affected by Las-infection during early stage of HLB development. RuBisCO catalyzes the conversion of Ribulose-1, 5-bisphophate and inorganic CO2 to an unstable 6 carbon compound (3-keto-2-carboxyarabinitol-1, 5-bisphosphate) that disintegrates almost instantaneously into two molecules of glycerate-3-phosphate. Carbonic anhydrase catalyzes the rapid interconversion of carbon dioxide and water to bicarbonate and protons while RuBisCO activase catalyzes the rapid formation of the critical carbamate in the active site of RuBisCO.
Table 2.
Photosynthesis- and Energy/Metabolisms-related citrus grapefruit leaf proteins that were down-accumulated in response to Las-infection
| Spota |
ASVb |
Protein function/namec | Accession #c |
Theoreticald |
Se | Mf | Eg | |
|---|---|---|---|---|---|---|---|---|
| UP IP US IS | Mr | pI | ||||||
| |
|
CO2 assimilation/Photosynthesis |
|
|
|
|
|
|
| 3 |
 |
Ribulose 1,5-bisphosphate carboxylase/oxygenase large subunit(chloroplast) |
gi|114329664 |
53950 |
6.19 |
143 |
19 |
41 |
| 28 |
 |
Ribulose 1,5-bisphosphate carboxylase/oxygenase large subunit(chloroplast) |
gi|114329664 |
53950 |
6.19 |
94 |
14 |
36 |
| 49 |
 |
Chloroplast ribulose-1,5-bisphosphate carboxylase/oxygenase activase large protein isoform |
gi|115334977 |
41738 |
5.07 |
150 |
24 |
56 |
| 67 |
 |
Oxygen evolving enhancer protein 1 |
gi|326467059 |
29262 |
5.32 |
133 |
14 |
67 |
| 71 |
 |
Ribulose bisphosphate carboxylase/oxygenase activase 1, chloroplast precursor, putative |
gi|255584538 |
51073 |
5.33 |
145 |
20 |
50 |
| 72 |
 |
Ribulose bisphosphate carboxylase/oxygenase activase 1, chloroplast precursor, putative |
gi|255584538 |
47200 |
5.94 |
144 |
21 |
55 |
| 91 |
 |
Oxygen evolving enhancer protein 1 |
gi|326467059 |
29262 |
5.32 |
134 |
15 |
70 |
| 101 |
 |
Chloroplast ribulose-1,5-bisphosphate carboxylase/oxygenase activase small protein isoform |
gi|115334975 |
47200 |
5.94 |
148 |
26 |
63 |
| 113 |
 |
Rubisco subunit binding-protein beta subunit, putative |
gi|255564820 |
65086 |
5.85 |
211 |
25 |
50 |
| 126 |
 |
Carbonic anhydrase, putative |
gi|255568812 |
28499 |
5.51 |
135 |
13 |
56 |
| 159 |
 |
Carbonic anhydrase 1 |
gi|30678350 |
28483 |
6.39 |
78 |
8 |
38 |
| 164 |
 |
Photosystem II stability/assembly factor HCF136, chloroplast precursor, putative |
gi|255559812 |
45094 |
8.46 |
147 |
10 |
38 |
| 180h |
 |
PSI 9 kDa protein |
gi|224365649 |
9545 |
6.67 |
51 |
3 |
43 |
| 208 |
 |
Ribulose 1,5-bisphosphate carboxylase/oxygenase large subunit (chloroplast) |
gi|114329664 |
53950 |
6.19 |
106 |
17 |
41 |
| 211 |
 |
Ribulose-1,5-bisphosphate carboxylase/oxygenase small subunit |
gi|24940138 |
20521 |
9.16 |
92 |
8 |
41 |
| 214h |
 |
Oxygen-evolving enhancer protein 2, chloroplastic |
gi|225446775 |
26777 |
8.63 |
48 |
6 |
32 |
| |
|
Energy/Metabolisms |
|
|
|
|
|
|
| 20 |
 |
Protein grpE-like |
gi|225439145 |
24749 |
4.61 |
67 |
8 |
47 |
| 70 |
 |
Sedoheptulose-1,7-bisphosphatase, chloroplast, putative |
gi|255579134 |
42768 |
5.82 |
67 |
15 |
31 |
| 75 |
 |
Beta-tubulin |
gi|223018283 |
50941 |
4.76 |
197 |
27 |
60 |
| 78 |
 |
Alpha-tubulin |
gi|134035496 |
42534 |
5.82 |
102 |
15 |
59 |
| 95 |
 |
Caffeoyl CoA O-methyltransferase 1 |
gi|229368458 |
20972 |
5.39 |
74 |
8 |
57 |
| 103 |
 |
Phosphoribulose kinase, putative |
gi|255555933 |
45558 |
5.97 |
141 |
17 |
61 |
| 106 |
 |
ATP synthase beta subunit, putative |
gi|255582911 |
59862 |
6.06 |
152 |
22 |
51 |
| 112 |
 |
Transitional endoplasmic reticulum ATPase, putative |
gi|255556938 |
90244 |
5.14 |
265 |
27 |
47 |
| 122h |
 |
Bis(5'-adenosyl)-triphosphatase-like |
gi|356539734 |
16962 |
6.07 |
48 |
4 |
40 |
| 130 |
 |
Pyruvate dehydrogenase, putative |
gi|255543140 |
39870 |
5.95 |
67 |
11 |
29 |
| 132 |
 |
Alcohol dehydrogenase, putative |
gi|255568816 |
41894 |
8.77 |
141 |
11 |
42 |
| 134 |
 |
ATP synthase beta subunit, putative |
gi|255582911 |
59862 |
6.06 |
278 |
27 |
63 |
| 139 |
 |
2-phospho-D-glycerate hydrolase |
gi|289600010 |
48059 |
5.54 |
142 |
15 |
53 |
| 154 |
 |
Carboxymethylenebutenolidase, putative |
gi|255567721 |
30236 |
7.10 |
74 |
7 |
37 |
| 167 |
 |
Phosphoglycerate kinase, putative |
gi|255544584 |
38338 |
9.37 |
108 |
10 |
38 |
| 171 |
 |
Sorbitol dehydrogenase-like protein |
gi|21553353 |
39923 |
6.33 |
119 |
11 |
36 |
| 172 |
 |
2-phospho-D-glycerate hydrolase |
gi|289600010 |
48059 |
5.54 |
235 |
20 |
64 |
| 173 |
 |
Putative 2-3 biphosphoglycerate mutase |
gi|239056191 |
61119 |
5.65 |
170 |
16 |
42 |
| 186 |
 |
Triosphosphate isomerase-like protein type II |
gi|262410515 |
27160 |
5.74 |
150 |
11 |
65 |
| 191 |
 |
Malate dehydrogenase |
gi|211906490 |
35859 |
6.10 |
196 |
19 |
66 |
| 199 | 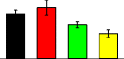 |
Aldehyde dehydrogenase, putative | gi|255540719 | 52969 | 5.92 | 198 | 19 | 52 |
a The spot numbers correspond to the numbers given in Figure 2 and Additional file 3: Figure S2.
b Average spot volume per treatment group; UP, uninfected reference for pre-symptomatic plants; IP, infected pre-symptomatic plants; US, uninfected reference for symptomatic plants; IS, infected symptomatic plants. Average spot volumes separated by letters to show significant difference are presented in Additional file 6: Appendix S1.
c Protein function/name and accession number was determined by http://www.ncbi.nlm.nih.gov/BLAST/.
d Theoretical relative molecular weight (Mr) and isoelectric point (pI) were calculated by http://www.expasy.org/. Observed Mr and pI can be extrapolated from Figure 1.
e Mascot score of protein hit.
f Number of matched peptide masses. The sequences of PMF-matched peptides per spot are provided in Additional file 7: Appendix S2.
g Percent sequence coverage of matched peptides.
h Protein identification confirmed by MALDI-TOF-MS/MS. Sequencing information is provided in Additional file 7: Appendix S2.
i Protein identification confirmed by LC-MS/MS.
Our results agree with those of Albrecht and Bowman [13], which showed a significant Las-mediated reduction in the expression of photosynthesis-related genes transcripts such as chlorophyll A-B and photosystem II 5 kDa protein. Fan et al. [25] proposed that Las-induced inhibition of photosynthesis could be due to an accumulation of photosynthates such as sucrose and fructose, which might suppress photosynthetic activity via a negative feedback mechanism. Additionally, the general reduction in nutrient content due to Las infection can lead to a reduction in the production of “housekeeping” proteins as well as the cannibalization of proteins such as RuBisCO for nutrients [19]. During periods of biotic or abiotic stress the regulation of general protein production is usually skewed towards the production of stress-response related factors at the expense of “housekeeping” proteins [26]. The reducing energy generated in the light-dependent reactions of photosynthesis is also important in the reduction of sulfate and nitrate, which are necessary for protein biosynthesis and the Las-mediated inhibition of photosynthesis could play a role in the down-regulation of the expression levels of a diverse group of grapefruit leaf proteins (Table 2).
Furthermore, Las-infection was associated with a down-regulation of oxygen-evolving enhancer (OEE) proteins 1 and 2 (Table 2, spots 67, 91 and 214) as well as a PSI 9 kDa protein (Table 2, spot 180) in both IP and IS compared to the respective control plants. This suggests these proteins might be early targets during HLB disease development. OEE proteins 1 and 2 are subunits of the oxygen-evolving system of PSII and involved in stabilizing the Mn cluster [27]. However, unlike Fe, Zn and Cu, the elemental concentration of Mn was not significantly reduced in IP plants compared to UP plants (Figure 5), which suggests that a mechanism other than a canonical response to HLB-mediated reduction in nutrient availability might be associated with the early down-regulation of OEE proteins after Las-infection. Pathogens have been suggested to oxidize Mn from the reduced, plant available form, to the oxidized, non-available form as a virulence mechanism and isolates of Gaeumannomyces graminis and Magnaporthe grisea that cannot oxidize Mn have been shown to be avirulent [28]. HLB-affected trees generally show leaf yellowing (chlorosis) which is likely due to a reduction in chlorophyll biosynthesis [29,30] and Mg is important in chlorophyll biosynthesis. Thus, a Las-mediated reduction of the Mg content together with a reduction in Fe content of leaves of grapefruit plants (Figure 5) could play a role in HLB-associated chlorosis.
Energy/metabolism
There was a general Las-mediated down-accumulation of energy production and metabolism-related proteins including ATP synthase beta subunit (Table 2, spots 106 and 134), sedoheptulose-1, 7-bisphosphatase (Table 2, spot 70), beta-tubulin (Table 2, spot 75), pyruvate dehydrogenase (Table 2, spot 130), alcohol dehydrogenase (Table 2, spot 132), and malate dehydrogenase (Table 2, spot 191) especially in IS plants compared to US plants. Interestingly, we observed a significant up-accumulation of granule-bound starch synthase (Table 3, spots 29, 33, 61) in IP and IS plants compared to the respective control plants. Several enzymes important in energy production and metabolism possess Fe-S clusters and the production of these proteins could be limited under reduced Fe availability as observed in this study (Figure 5). Additionally, Fe-S proteins act as Fe reservoirs in the cell and their degradation could be facilitated to release Fe [31].
Table 3.
Citrus grapefruit leaf proteins that were up-accumulated in response to Las-infection
| Spota |
ASVb |
Protein function/namec | Accession # |
Theoreticald |
Se | Mf | Eg | |
|---|---|---|---|---|---|---|---|---|
| UP IP US IS | Mr | pI | ||||||
| |
|
Energy/Metabolisms |
|
|
|
|
|
|
| 29i |
 |
Granule-bound starch synthase |
gi|223029784 |
67320 |
8.56 |
|
|
|
| 33i |
 |
Granule-bound starch synthase |
gi|223029784 |
67320 |
8.56 |
|
|
|
| 61i |
 |
Granule-bound starch synthase |
gi|223029784 |
67320 |
8.56 |
|
|
|
| |
|
Redox homeostasis |
|
|
|
|
|
|
| 34i |
 |
Peroxiredoxins, prx-1, prx-2, prx-3, putative |
gi|255578581 |
29299 |
8.38 |
|
|
|
| 119i |
 |
Cu/Zn superoxide dismutase |
gi|2274917 |
12784 |
5.82 |
|
|
|
| 147i |
 |
2Fe-2S ferredoxin-like protein |
gi|18397961 |
17602 |
7.75 |
|
|
|
| |
|
Pathogen response |
|
|
|
|
|
|
| 14i |
 |
Chloroplastic light/drought-induced stress protein |
gi|22261807 |
35216 |
5.24 |
|
|
|
| 15i |
 |
Acidic class I chitinase |
gi|23496445 |
34123 |
4.70 |
|
|
|
| 19 |
 |
Acidic class I chitinase |
gi|23496445 |
36735 |
4.81 |
64 |
8 |
24 |
| 39 |
 |
Lectin-related protein precursor |
gi|11596188 |
29272 |
5.10 |
72 |
7 |
32 |
| 41h |
 |
Chitinase |
gi|1220144 |
32459 |
5.06 |
53 |
5 |
20 |
| 43 |
 |
Chitinase |
gi|1220144 |
36735 |
4.81 |
73 |
11 |
41 |
| 44 |
 |
Lectin-related protein precursor |
gi|11596188 |
29272 |
5.10 |
85 |
7 |
32 |
| 66i |
 |
Chitinase |
gi|1220144 |
31909 |
5.06 |
|
|
|
| 88i |
 |
Chitinase |
gi|1220144 |
31909 |
5.06 |
|
|
|
| 92i |
 |
Chitinase |
gi|1220144 |
31909 |
5.06 |
|
|
|
| 124 |
 |
Chitinase |
gi|1220144 |
36735 |
4.81 |
110 |
11 |
45 |
| 141i |
 |
CAP160 protein |
gi|22327778 |
65970 |
5.07 |
|
|
|
| 153 |
 |
Putative miraculin-like protein 2 |
gi|119367468 |
17806 |
6.74 |
105 |
7 |
49 |
| 156i |
 |
Miraculin-like protein 2 |
gi|11596180 |
25652 |
6.10 |
|
|
|
| 160i |
 |
Chitinase |
gi|1220144 |
31909 |
5.06 |
|
|
|
| 179i |
 |
PR-4 type protein |
gi|3511147 |
15227 |
5.50 |
|
|
|
| 181i |
 |
Miraculin-like protein 2 |
gi|87299377 |
24120 |
5.61 |
|
|
|
| 187i |
 |
Miraculin-like protein 2 |
gi|87299377 |
24120 |
5.61 |
|
|
|
| 202 |
 |
Putative miraculin-like protein 2 |
gi|119367468 |
23610 |
8.18 |
126 |
9 |
54 |
| 203i |  |
Miraculin-like protein 2 | gi|87299377 | 24120 | 5.61 | |||
a The spot numbers correspond to the numbers given in Figure 2 and Additional file 3: Figure S2.
b Average spot volume per treatment group; UP, uninfected reference for pre-symptomatic plants; IP, infected pre-symptomatic plants; US, uninfected reference for symptomatic plants; IS, infected symptomatic plants. Average spot volumes separated by letters to show significant difference are presented in Additional file 6: Appendix S1.
c Protein function/name was determined by http://www.ncbi.nlm.nih.gov/BLAST/.
d Theoretical relative molecular weight (Mr) and isoelectric point (pI) were calculated by http://www.expasy.org/. Observed Mr and pI can be extrapolated from Figure 1.
e Mascot score of protein hit.
f Number of matched peptide masses. The sequences of PMF-matched peptides per spot are provided in Additional file 7: Appendix S2.
g Percent sequence coverage of matched peptides.
h Protein identification confirmed by MALDI-TOF-MS/MS. Sequencing information is provided in Additional file 7: Appendix S2.
i Protein identification confirmed by LC-MS/MS.
The accumulation of starch in plant tissues during HLB disease development has been previously demonstrated [25,32,33] and we earlier discussed our observation of a Las-mediated down-regulation of photosynthesis-related proteins. In plants, the surplus carbohydrates (sugars) produced during photosynthesis is stored as starch. Thus, an HLB-mediated inhibition of downstream metabolic pathways could contribute to starch accumulation in citrus plants and starch accumulation could result in an inhibition of photosynthesis via a negative feed-back mechanism. The transcriptomic studies by Albrecht and Bowman [13] and by Fan et al. [34] showed a similar Las-mediated inverse relationship between the expression of gene transcripts involved in starch anabolism with those associated with photosynthesis in citrus plants. However, a similar study by Kim et al. [4] only demonstrated a Las-mediated up-regulation of starch-anabolism-related gene transcripts and no significant effect on photosynthesis-related gene transcripts in HLB-affected sweet orange plants. Furthermore, a proteomic study by Fan et al. [35] failed to identify a Las-mediated effect on starch anabolism- or photosynthesis-related proteins in HLB-affected sweet orange plants. Thus, our present study is the first to simultaneously identify the proteomic mechanisms potentially involved in Las-mediated up-regulation of starch accumulation when accompanied by a down-regulation of photosynthesis in HLB-affected citrus plants.
Additionally, while the major HLB-induced starch anabolism-related gene transcript detected by Albrecht and Bowman [13] and Kim et al. [4] were those coding for the large subunit of ADP-glucose pyrophosphorylase (ADPase), the major HLB-induced starch anabolism-related protein detected in our present study was a granule-bound starch synthase. Starch is composed of two distinct polymers: amylopectin and amylose. Amylopectin consists of long chains of (1, 4)-linked α-D-glucopyranosyl units with extensive branching resulting from (1–6) linkages, while amylose is a relatively linear molecule of (1, 4)-linked α-D-glucopyranosyl units [36]. Starch biosynthesis is controlled by four major enzymes namely: ADPase, starch synthase, granule-bound starch synthase, and starch debranching enzyme. ADPase is the rate-limiting enzyme, and catalyzes the ATP-dependent interconversion of glucose-1-phosphate to ADP-glucose. ADP-glucose is then polymerized into amylopectin by multiple isoforms of starch synthase or to amylose by granule-bound starch synthase [37]. The extensive branching of amylopectin is the result of the balanced activities of starch-branching and -debranching enzymes. Thus, the result from our present study suggests that of the four starch biosynthesis-associated enzymes, granule-bound starch synthase is the most post-transcriptionally up-regulated protein during the early stage of Las infection in grapefruit.
Furthermore, granule-bound starch synthase requires K for activation [38] which might explain our observation of a 12% (P > 0.05) and 21% (P < 0.05) increase in IP and IS plants, respectively, compared to the respective control plants (Figure 5). Pathogen-mediated disruption of membrane permeability could lead to electrolyte leakage [19], which could be a virulence mechanism by Las to induce host K accumulation in order to sustain increased starch accumulation, thus providing a steady source of carbon and other nutrition for this phloem-limited pathogen while the host cells are deprived of these nutrients. This hypothesis is consistent with our observation of Las-mediated up-accumulation of lectin-like proteins (discussed later). The disruption of K balance could also lead to guard cell malfunction and arrest of transpiration limiting nutrient uptake as well as CO2 assimilation/photosynthesis [39]. To the best of our knowledge this study is the first to show a direct relationship between the accumulation of K nutrient and accumulation of granule-bound starch synthase in citrus leaves in response to Las infection, which might suggest a signature pathophysiological response of citrus plants to Las infection.
Pathogen response
We showed that Las-infection resulted in an up-regulation of a PR-4 type protein (Table 3, spot 179), chitinases (Table 3, spots 41, 43, 66, 88, 92, 124, and 160), lectin-related proteins (Table 3, spots 39 and 44), miraculin-like proteins (Table 3, spots 153, 156, 181, 187, 202, and 203), and a chloroplastic light/drought-induced stress protein (Table 3, spot 14) in IP and IS plants compared to their respective control plants. We also identified a CAP 160 protein (Table 3, spot 141) which was up-accumulated in IP plants compared to UP plants but was undetected in US or IS plants. These observations are generally consistent with those from previous reports [14,35]. However, our identification of a Las-mediated up-regulation of a CAP 160 protein and a chloroplastic light/drought-induced stress protein, which are uncharacterized proteins, is novel.
The function of CAP160 proteins in plants is obscure but the protein has been associated with drought-, desiccation- and cold-stress tolerance [40]. Thus, our observation of an early Las-mediated up-regulation of a CAP 160 protein and a chloroplastic light/drought-induced stress protein suggest attempts by the host plant to mitigate a possible disruption of the water balance by Las via a disrupted transpiration stream as earlier postulated.
Pathogenesis-related (PR) proteins are plant proteins that are induced in response to pathogen attack. However, several studies suggest that these proteins can also be induced by a variety of abiotic stresses, such as wounding and exposure to chemicals or heavy metals [26,41-43]. The PR-4 family of PR proteins consists of class I and class II chitinases, which differ by the presence (class I) or absence (class II) of a conserved N-terminal cysteine-rich domain corresponding to the mature hevein, a small antifungal protein isolated from rubber tree (Hevea brasiliensis) latex [44].
Lectin-like proteins are involved in vascular tissue differentiation [45] and are associated with the plugging of phloem sieve plates in response to wounding and defense against pathogens and insects [46]. Accumulation of Phloem protein 2 (PP2), a lectin-like protein, at the sieve plates together with phloem necrosis and blockage of the translocation stream was demonstrated by Kim et al. [4] and Achor et al. [47] in HLB-affected citrus plants. Furthermore, the deposition of PP2 with callose at the sieve plates played a role in the recovery of apple trees from apple proliferation disease caused by the phloem-limited pathogen ‘Candidatus Phytoplasma mali’ [48]. Las, a phloem-limited bacterium, might induce the production of lectin-related proteins in host plants in order to inhibit phloem flow and accumulate photosynthates to nourish further bacterial growth as previously suggested. On the other hand host plants might induce the production of lectin-like proteins as a defensive attempt to prevent the spread of Las by sealing off the sieve tubes. Additionally studies have demonstrated that lectin-like proteins are able to interact with RNA molecules, are involved in the long-distance trafficking of macromolecules and may play a role in long-distance signaling in response to infection by plant pathogens [49,50].
In agreement with our results, a proteomics study by Fan et al. [35] also showed a Las-mediated up-regulation of miraculin-like proteins and gene transcripts in sweet orange plants. Recently, two distinct miraculin-like proteins, RlemMLP1 and RlemMLP2, were characterized in rough lemon (Citrus jambhiri Lush), and shown to have protease inhibitor activities as well as being involved in defense against pathogens [51]. During the development of citrus sudden death (CSD) disease, a miraculin-like protein was suppressed in susceptible plants but not in tolerant plants [52]. Increased levels of PR proteins as well as miraculin-like proteins was observed in leaves of C. clementina plants after infestation by the spider mite Tetranychus urticae or exposure to methyl jasmonate [53].
Taken together, 20.4% of the differentially expressed protein spots identified in this study matched to pathogen response-related proteins (Figure 3A), which were all up-regulated in grapefruit plants in response to Las infection (Table 3). However, the concerted up-regulation of these pathogen response-related proteins was evidently not sufficient to hinder HLB development. Thus, the development/engineering of citrus plants that constitutively express these stress-response related proteins could help reduce susceptibility to Las infection [14]. Additionally, the production of these proteins in pre-symptomatic plants could be exploited to develop novel/improved serological diagnostic methods for early identification of HLB-affected plants.
Redox homeostasis
Redox-homeostasis-related proteins are usually involved in the prevention of oxidative stress, which is induced by reactive oxygen species (ROS). ROS are by-products of electron transport and redox reactions from metabolic processes such as photosynthesis and respiration. The production of ROS is markedly increased under conditions of biotic or abiotic stress [54,55]. We observed that Las-infection up-regulated the production of peroxiredoxins (Table 3, spot 34) and Cu/Zn superoxide dismutase (Table 3, spot 119) in IP and IS plants compared to their respective control plants. Additionally, we observed a Las-mediated up-regulation of a 2Fe-2S ferredoxin-like protein particularly in IP plants compared to UP plants.
Antioxidants, such as superoxide dismutase (SOD), are among the most potent in nature in protecting living systems against oxidative stress. While the role of Cu/Zn SOD in HLB disease development in citrus plants has been previously demonstrated [14,35], this study provides novel evidence for the potential involvement of two other redox homeostasis-related proteins: peroxiredoxins and an uncharacterized 2Fe-2S ferredoxin-like protein. ROS are produced sequentially: superoxide (O2 ¯) is the first reduction product of ground state oxygen and it can undergo spontaneous or SOD-catalyzed dismutation to H2O2, which is the second reactive product. Although, H2O2 is less reactive than superoxide, it is very diffusible and directly inactivates key cellular processes. Peroxiredoxins are a family of thiol-based peroxidases which catalyze the detoxification of H2O2 and other peroxides within living systems [56,57]. Interestingly, ascorbate peroxidase (Table 1, spots 128 and 161) and catalase (Table 1, spot 209), which are very important components of H2O2 detoxification [58], were down-regulated in response to Las-infection suggesting that peroxiredoxins might be preferentially recruited to help dissipate oxidative stress during HLB disease development.
Besides ascorbate peroxidase and catalase, we also observed that Las-infection resulted in a significant down-regulation of other redox homeostasis-related proteins such as a putative thioredoxin (Table 1, spot 121), coproporphyrinogen III oxidase (Table 1, spot 188), isoflavone reductase (Table 1, spot 189), and cinnamoyl-CoA reductase (Table 1, spot 205) particularly in IS plants compared to US plants. The reduction in antioxidative protein production could be a consequence of Las-mediated reduction in the plant nutrient content (Figure 5). Rellán-Álvarez et al. [59] showed a significant down-regulation in the production of antioxidants in Beta vulgaris due to Fe-deficiency. Albrecht and Bowman [14] suggested that their observed Las-mediated up-regulation of several gene transcripts for a Zn transporter 5 precursor (ZIP5) in ‘Cleopatra’ mandarin leaves was likely an attempt of the host to increase the uptake of Zn to potentially support an up-regulation of Cu/Zn SOD in response to HLB-induced deficiency. Furthermore, Albrecht and Bowman [14] identified 326 genes which were significantly up-regulated in a Las-susceptible citrus genotype compared to 17 genes which were significantly up-regulated in a Las-tolerant citrus hybrid. They also showed a significant over-expression of 559 transcripts including several with stress-response related functions such as oxidoreductase, Cu/Zn SOD and isoflavone reductase in the leaves of the Las-tolerant citrus hybrid compared with leaves of the Las-susceptible citrus genotype irrespective of Las-infection. We therefore suggest that the susceptibility of grapefruit plants to HLB might be associated with the inability of the plants to constitutively express their repertoire of antioxidants to mitigate the debilitating effects of Las-mediated ROS production.
Regulation/Protein synthesis
Considering the general physiological decline that accompanies HLB development, it is not surprising that proteins associated with regulation/protein synthesis including such as a 31 kDa ribonucleoprotein (Table 1, spot 16), EF-Tu (Table 1, spot 58), glutamine synthetase (Table 1, spots 100 and 105), an ATP-dependent zinc metalloprotease (Table 1, spot 116), a serine-type peptidase (Table 1, spot 165), nucleoside diphosphate kinase 1 (Table 1, spot 149), and alanine aminotransferase 2 (Table 1, spot 198), were markedly repressed by Las especially in IS plants compared to US plants. Interestingly, we observed a significant Las-mediated down-regulation of a transcription factor homolog (Btf3-like) protein (Table 1, spot 152) and S-adenolsyl-L-methionine synthetase (Table 1, spot 170) in IP and IS plants compared to control plants, suggesting that these proteins might be early targets of Las pathogenesis or an early susceptibility response by grapefruit during HLB development.
The RNA polymerase B transcriptional factor 3 (Btf3) was demonstrated to be associated with apoptosis in mammalian cells [44,60] but its actual function in plants is not well understood. However, recently, Huh et al. [61] showed that silencing of Btf3 protein expression in Capsicum annuum and Nicotiana benthamiana plants led to reduced hypersensitive response (HR) cell death and decreased expression of some HR-associated genes. HR cell death upon pathogen infection has been described as a strategy devised by plants for inhibiting pathogen spread and obtaining systemic acquired resistance against further infection [62,63]. Thus, an early Las-mediated reduction in the production of a Btf3-like protein in grapefruit plants would have facilitated the spread of the bacterium within the host.
S-adenosylmethionine synthetase (SAMS) catalyzes the formation of S-adenosylmethionine (AdoMet) from methionine and ATP. AdoMet is an important methyl group donor utilized in most transmethylation reactions, which play vital roles in the synthesis of lipids, nucleic acids, proteins, and other products of secondary metabolism. Significant reductions in SAMS abundance in plants has been associated with abiotic stress particularly salt stress [64,65], and Hua et al. [66] showed that the expression of a Glycine soja SAMS gene in alfalfa (Medicago sativa L) plants enhanced alfalfa’s tolerance to salt stress. Thus, the Las-mediated increase in the concentration of K in IP plants compared to UP plants (Figure 5) could induce osmotic stress similar to that caused by salt stress and ultimately resulting in an early Las-mediated down-regulation of SAMS.
Chaperones
Molecular chaperones [e.g. heat shock proteins (HSPs), chaperonins and peptidyl-prolyl cis-trans isomerases] are proteins involved in protein folding, refolding, assembly, re-assembly, degradation and translocation [67-70]. It is, therefore, not surprising that the broad Las-mediated down-regulation of proteins associated with regulation/protein synthesis was accompanied by a corresponding down-regulation in the expression levels of chaperones including peptidyl-prolyl cis-trans isomerase (Table 1, spot 45), heat shock proteins (Table 1, spots 30, 86, 111) and chaperonin-60 (Table 1, spots 81 and 140) especially in IS plants compared to US plants [71].
Conclusion
HLB is currently one of the most destructive diseases of citrus and Las has been associated with the disease in many citrus growing regions of the world. Management of HLB remains elusive largely because the physiological and molecular processes involved in HLB-disease development are unresolved. The major findings from our study is summarized in Figure 6 and highlights the potential interrelationships between the protein expression profiles and nutrient status of pre-symptomatic and symptomatic leaves of Las-infected grapefruit plants. We identified 69 proteins that were differentially expressed (13 up-regulated and 56 down-regulated) in response to Las infection. Additionally, we showed a general decrease in nutrient concentrations due to Las-infection particularly those of Fe, Zn, and Cu but an increase in K levels. We propose that the physiological and molecular processes associated with the response of grapefruit plants to Las infection involves: 1) a general decrease in nutrient concentration resulting in the reduced production of proteins associated with photosynthesis, energy production, regulation and protein synthesis/transport; 2) an increase in K concentration to support the activity of an increased production of starch anabolism-related proteins; and 3) an increase in the production of peroxiredoxins, Cu/Zn SOD and pathogen response-related proteins, such as chitinase, miraculin- and lectin-like proteins, which although insufficient to mitigate bacterial spread could, in combination with testing for granule-bound starch synthase and K content, be useful in the development of host-based diagnostic techniques for early detection of HLB-affected citrus plants.
Figure 6.
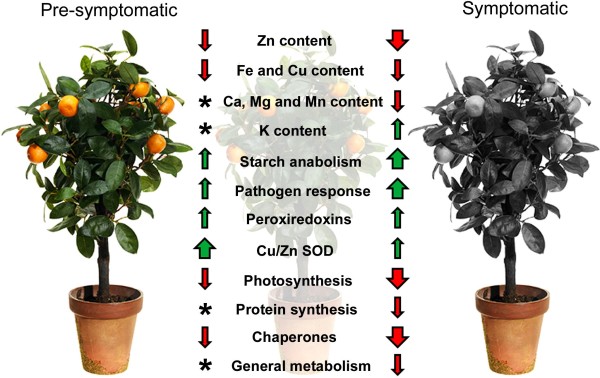
A schematic summary of observed effects of Las-infection on the nutrient status and protein expression levels in leaves of grapefruit plants that were pre-symptomatic or symptomatic for HLB. Upward or downward arrows indicate increase or decrease, respectively, while arrow width indicates relative magnitude. Two-year old healthy plants were either graft-inoculated with side shoots from PCR-confirmed Las-infected bud sticks or uninoculated and leaf samples were analyzed at three months post-inoculation (for pre-symptomatic plants) or six months post-inoculation (for symptomatic plants). Asterisks (*) denotes an insignificant effect of Las-infection in pre-symptomatic plants in the accumulation or reduction of Ca, Mg, Mn, and K content as well as the accumulation or reduction of proteins associated with regulation/protein synthesis and general metabolism.
Methods
Growth conditions and treatments
Plant growth was performed under controlled conditions in an insect-proof greenhouse at the U.S. Horticulture Research laboratory, U.S. Department of Agriculture, Fort Pierce, Florida. Two-year old grapefruit (Citrus paradisi cv. ‘Duncan’) plants from the same progeny were either uninoculated or inoculated by side-grafting with 3–4 cm long bud sticks from PCR-confirmed HLB-affected (showing blotchy mottle and yellow shoots) lemon plants. Each HLB-affected side-graft was protected by covering with plastic tape for 3 weeks [72]. The absence or presence of HLB-associated Las in plants, pre- or post-inoculation, respectively, was confirmed by quantitative real-time PCR using forward primers 5-TCGAGCGTATGCAATACG-3 and reverse primers 5-CGCAATAGGGCATCTTTTTCCATC-3 [73].
Plants were arranged randomly on the greenhouse bench and kept under natural light conditions at a temperature of 23–30°C. Plants were irrigated as needed and fertilized every three weeks using a water-soluble fertilizer mix, 20 N-10P-20 K (Peters Professional, The Scotts Company, Marysville, OH). Micronutrients (Micro Key Palm and Ornamental Formulation, Brandt Consolidated, Springfield, IL) and additional iron (Sequestrene 138 Fe, Becker Underwood, Ames, IA) were applied. Plants were pruned immediately after graft-inoculation to promote new leaf growth and HLB disease development.
Three months post-inoculation, 10–15 fully expanded leaves were collected from three individual plants each from the uninoculated or inoculated group. At this stage the infected plants were pre-symptomatic (no blotchy mottle, yellow shoots or symptoms of nutrient deficiency) but were PCR-positive for Las. Leaf samples from uninoculated or inoculated plants were grouped, respectively, as uninfected control for pre-symptomatic (UP) plants or infected pre-symptomatic (IP) plants. Six months post-inoculation, another set of 10–15 fully expanded leaves was collected from three individual plants each from the uninoculated or inoculated group. At this stage all of the inoculated plants were symptomatic for HLB and PCR-positive for Las. Leaf samples from uninoculated or inoculated plants were grouped, respectively, as uninfected control for symptomatic (US) plants or infected symptomatic (IS) plants. As the plants used for pre-symptomatic stage analysis were different from those used for symptomatic stage analysis, two different groups of control plants, UP and US plants, were used for IP and IS plants, respectively. Harvested leaves were immediately frozen in liquid nitrogen and stored at −80°C until further analysis.
Protein extraction and quantification
The method used for total leaf protein analysis was modified after Nwugo and Huerta [26]. Leaves from individual plants were pooled and ground to a fine powder in liquid nitrogen using a freezer mill (6850 Freezer/Mill, Wolf Laboratories Ltd., UK). Approximately 0.4 g of leaf powder was transferred to sterile 5 mL polyallomer centrifuge tubes (Beckman Instruments Inc., USA) and suspended in 4.5 mL of chilled solution A [90% (v/v) acetone, 9.9993% (v/v) trichloroacetic acid (TCA), 0.0007% (v/v) Beta-mercaptoethanol]. The mixture was incubated overnight at −80°C followed by centrifugation at 4°C for 20 min at 36,000 g (Optima L-70 K Ultracentrifuge, Beckman Coulter Inc., USA). The supernatant was decanted, and the pellet was washed at least three times until the supernatant was clear (not greenish) by resuspension in 4.5 mL of chilled solution B [98.53% (v/v) acetone, 1 mM polymethylsulphonylfluoride (PMSF), 2 mM EDTA, 0.0007% (v/v) Beta-mercaptoethanol], incubation for 1 h at −80°C followed by centrifugation at 4°C for 20 min at 36,000 g. The whitish pellet or crude protein extract was then transferred into sterile eppendorf tubes and vacuum-dried (Vacufuge™, Eppendorf, Germany). The dry pellet, which could be stored indefinitely at −80°C, was suspended in 0.5 mL of rehydration/isoelectric focusing (IEF) buffer [8 M Urea, 50 mM DTT, 4% (w/v) CHAPS, 0.2% (v/v) 3/10 ampholytes, 0.002% (w/v) bromophenol blue] and incubated at room temperature (RT) for 30 min to solubilize proteins. Insoluble material was removed by centrifugation at RT at 14,000 g for 15 min and 5μL of the supernatant was prepared using the Compat-Able™ Protein Assay Preparation Reagent Set (Pierce, Rockford, IL, USA) for total protein quantification via bicinchoninic acid (BCA) assay (Pierce, Rockford, IL, USA). Total protein extraction and quantification process was repeated three times generating three analytical replicates per plant.
2-DE separation and image analysis
For first dimension electrophoresis or IEF, 11-cm long pH 4–7 ReadyStrip IPG strips (Bio-Rad, Hercules, CA, USA) were passively rehydrated overnight at RT with 0.2 mL of IEF buffer containing 1 mg/mL of total solubilized proteins. Rehydrated strips were placed in a PROTEAN IEF cell (Bio-Rad) and IEF was performed at a current limit of 50 μA/per IpG strip at 10°C, in the following steps: active rehydration at 250 V for 9 h; 250 V (linear) for 15 min; 8 kV (linear) for 3 h; and 10 kV (rapid) until a total 60 kVh for a combined total of approximately 70 kVh. Each focused IPG strip was equilibrated by soaking, with mild stirring, in 4 ml of equilibration base buffer 1 (EBB1) [8 M urea, 2% (w/v) sodium dodecyl sulphate (SDS), 50 mM Tris–HCl (pH 8.8), 20% (v/v) glycerol, 1% (w/v) DTT] for 10 min, followed by soaking in 4 ml of EBB2 [same content as EBB1 except DTT was replaced with 2.5% (w/v) iodoacetamide (IAA)]. Second dimension electrophoresis was performed in 8-16% gradient SDS-polyacrylamide Tris–HCl gels (Criterion precast gels, Bio-Rad) in a twelve-gel cell system (Criterion Dodeca Cell, Bio-Rad). Protein spots were visualized by staining with Biosafe Coomassie. Stained gels were scanned (ScanMaker 9800XL, Microtek, USA) under identical conditions and stored in 0.02% NaN3 at 4°C.
Gel images were analyzed using the PDQuest software package (version 8.0, Bio-Rad, USA). A total of 36 gels were analyzed representing three analytical replicates per plant and three replicate plants per treatment. The gels were sorted into four into four groups namely: uninfected control for pre-symptomatic (UP) plants, infected pre-symptomatic (IP) plants, uninfected control for symptomatic (US) plants, or infected symptomatic (IS) plants. Gel spots were detected and matched so that a given spot had the same number across all gels. A master gel image containing matched spots across all gels was auto-generated. Extensive analysis using the “Landmark” tool was used to resolve missed matches and spot volumes were normalized according to the total gel image density as suggested by the PDQuest software package. An average spot volume was determined for each spot per group and pair-wise quantitative as well as statistical analysis sets were generated by comparing the average volume of a given spot across all treatments. Only spots that had ≥10-fold increase over background and present in at least six of the nine gels per treatment as well as showed 1.5 fold change (P < 0.05) compared to at least one other treatment group were considered to be differentially produced and further analyzed.
Trypsin digestion and mass spectrometry
Protein spots were manually excised (OneTouch Plus Spotpicker, The Gel company, USA), reduced with DTT, alkylated with IAA, and digested with mass spectrometry grade trypsin in the presence of ProteaseMAX™ Surfactant according to the manufacturer’s protocol (Promega, USA). Acetonitrile extraction was used to enhance peptide recovery. Tryptic-digests were generally analyzed by MALDI-TOF- or LC-MS/MS.
For MALDI-TOF-MS or MS/MS analysis (QSTAR XL Hybrid Quadrupole TOF LC/MS/MS System, Applied Biosystems, USA), the target plate was spotted with 2 μL of a 1:1 (v/v) mixture of tryptic-digest and matrix solution [10 mg/mL α-cyano-4-hydroxycinnamic acid (CHCA) in 50% ACN/ 0.1% TFA]. Mass spectra were acquired in positive TOF MS mode over the mass range of 800 – 4000 Da using 300 one-second cycles with MCA on. A mixture of Des-Arg1-Bradykinin (904.47), Angiotensin I (1296.68), Neurotensin (1672.92) and ACTH (2093.09, 2465.20, 3657.92) monoisotopic [M + H]+ mass standards (Anaspec, USA) were used for external calibration. Monoisotopic peaks with S/N >5 were selected as the peptide mass fingerprint (PMF) per spot. Parent ion spectra (MS/MS) was acquired over a mass range of 50 – 4000 Da using 300 one-second cycles with MCA on.
For LC-MS/MS analysis (Ultimate 3000 RLSCnano System linked to Velos LTQ Orbitrap, Thermo Fisher), peptides were solubilized in 0.1% TFA and loaded on to a self-made fused silica trap-column of 100 μm × 2 cm packed with Magic C18 AQ (5 um bead size, 200 Å pore size Michrom Bioresources, Inc.) and washed with 0.2% formic acid at a flow-rate of 10 μL/min for 5 min. The retained peptides were separated on a fused silica column of 75 μm × 50 cm self-packed with Magic C18 AQ (3 um bead size, 200 Å pore size, Michrom Bioresources, Inc.) using a linear gradient from 4 to 45% B (A: 0.1% formic acid, B: 0.08% formic acid, 80% ACN) in 30 min at a flow-rate of 300 nL/min. For each cycle, one full MS was scanned in the Orbitrap with resolution of 60000 from 300–2000 m/z followed by CID fragmentation of 20 most intense peaks. Data dependent acquisition was set for repeat count of 2 and exclusion of 60 sec.
Protein identification via database queries
Prior to database queries, the Peak Erazor software (v 2.01: Lighthouse data, Odense, Denmark) was used to process peptide mass fingerprints (PMFs) generated from MALDI-TOF-MS analysis as previously described (Nwugo and Huerta, 2011). The MASCOT search engine (Matrix Science, London, UK) was used to find matches of the PMF and MS/MS fragmentation spectra against a custom database containing entries for citrus (Citrus sinensis and Citrus clementina) available at http://www.citrusgenomedb.org/ and entries for grape (Vitis vinifera) available in the NCBI nonreduntant database. The PAC nos. for citrus or Accession nos. for grape entries that matched to our protein/peptide queries at the moment of Mascot search was recorded. Fixed and variable modifications (Cys carbamidomethylation and Met oxidation, respectively) and one missed cleavage were considered. PMF database search was conducted using a maximum mass tolerance of ±100 ppm, while MS/MS ions search were conducted with a mass tolerance of ± 0.6 Da on the parent and 0.3-0.8 Da on fragments; in all cases the peptide charge was +1. Decoy search was done automatically by Mascot on randomized database of equal composition and size. For PMF analysis, the peptide mixtures that produced the highest statistically significant (P < 0.05) match scores and accounted for the majority of the peaks present in the mass spectra, were assumed to be positively identified proteins.
LC-MS/MS spectra were also searched via MASCOT against a custom citrus database using the following parameters: precursor mass tolerance 10 ppm, fragment mass tolerance: 0.6 Dalton, fixed modification of carbamidomethylaion on cysteine and variable modification of methionine oxidation. The peptide identification results were filtered using a False-Detection-Rate (FDR) of 1% and only the top match was reported. To gain functional information on identified proteins from MALDI-TOF and LC-MS/MS analysis, homology searches using BLASTP (http: http://www.ncbi.nlm.nih.gov/BLAST) was employed.
Nutrient status analysis
The macro- and micro-nutrient status of uninfected controls and Las-infected plants was assessed by assaying the concentrations of Ca, K, Mg, Fe, Cu, Mn, and Zn via Inductively-Coupled Plasma Optical Emission Spectroscopy (ICP-OES) in leaf tissues as previously described [74]. Briefly, the same ground leaf tissues used for proteomic analysis was oven-dried and 0.5 g was ashed at 510°C for 9 hrs, allowed to cool, and digested in 10 mL of 1 N HNO3 for 1 h. The filtered supernatant was brought to volume (25 mL) and the intensities of atomic emissions at 396.847 nm for Ca, 766.491 nm for K, 279.553 nm for Mg, 238.204 nm for Fe, 327.395 nm for Cu, 257.610 nm for Mn, and 213.857 nm for Zn was measured on an ICP-OES System (Varian Vista Pro CCD Simultaneous ICP-OES attached to Varian SPS 5 Sampler Preparation System, Agilent, USA). Samples were diluted 1:100 in 1 N HNO3 prior to Ca, K, and Mg analysis. All containers used for ICP Spectroscopy analysis were acid-washed by soaking overnight in 1 N HNO3 before use.
Statistical analysis
The nutrient concentration data were subjected to analysis of variance (ANOVA) using SigmaPlot software Version 11 (Systat Software, Inc., Point Richmond, California, USA) and means were separated using the Fischer’s Least Significant Difference (FLSD) test at 95% confidence interval (P < 0.05). Pair-wise comparisons to determine significant differences in spot volumes between treatments were performed on standardized log10 values of protein spot volumes using the Student’s t-test analysis at 95% confidence interval (P < 0.05) as provided by the PDQuest software.
Competing interests
The authors declare that they have no competing interests.
Authors’ contributions
CCN, HL and YPD conceived and designed the experiments and collected samples. CCN conducted experiment and analyzed the data. CCN, HL and ELC wrote the paper. All authors read and approved the final manuscript.
Supplementary Material
Protein extraction and 2-DE separation parameters of total leaf proteins of Las-infected or uninfected grapefruit plants.
Two-dimensional electrophoresis (2-DE) gel maps of total leaf proteome of grapefruit plants that were infected or uninfected with Las and pre-symptomatic or symptomatic for huanglongbing. (A) Representative gel of uninfected control for pre-symptomatic (UP) plants; (B) Representative gel of infected pre-symptomatic (IP) plants; (C) Representative gel of uninfected control for symptomatic (US) plants; (D) Representative gel of infected symptomatic (IS) plants. Two-year old healthy plants were either graft-inoculated with side shoots from PCR-confirmed Las-infected bud sticks or uninoculated and leaf samples were analyzed at three months post-inoculation (for pre-symptomatic plants) or six months post-inoculation (for symptomatic plants). A total of 200 μg of protein was loaded on a pH 4–7 IpG strip and protein spots were visualized by staining with Coomassie Brilliant Blue (CBB). Mr, relative molecular weight; pI, isoelectric point.
Panels A-T show magnified views of protein spots that were differentially expressed in leaves of grapefruit plants that were uninfected or infected with Las and pre-symptomatic or symptomatic for HLB. UP, uninfected control for pre-symptomatic plants; IP, infected pre-symptomatic plants; US, uninfected control for symptomatic plants; IS, infected symptomatic plants. Two-year old healthy plants were either graft-inoculated with side shoots from PCR-confirmed Las-infected bud sticks or uninoculated and leaf samples were analyzed at three months post-inoculation (for pre-symptomatic plants) or six months post-inoculation (for symptomatic plants). A total of 200 μg of protein was loaded on a pH 4–7 IpG strip and protein spots were visualized by staining with Coomassie Brilliant Blue (CBB).
List of all identified proteins grouped according to multiple spot matches.
Protein spots that were differentially produced according to treatment comparisons described in Figure 3.
Histograms of protein spot volumes highlighting significant differences.
Mascot match results.
Contributor Information
Chika C Nwugo, Email: Chika.Nwugo@ARS.USDA.GOV.
Hong Lin, Email: hong.lin@ars.usda.gov.
Yongping Duan, Email: YongPing.Duan@ARS.USDA.GOV.
Edwin L Civerolo, Email: emciv@comcast.net.
Acknowledgments
This work was funded by the USDA, Agricultural Research Service. We are grateful to Parminder Sahota, Donnie Williams and Tom Pflaum for assistance with sample preparation and ICP spectroscopy. We also thank Dr. Will Jewel of the CMSF at UC Davis for access to their local Mascot Server. Trade names or commercial products in this publication are mentioned solely for the purpose of providing specific information and does not imply recommendation or endorsement by the United States Department of Agriculture.
References
- Bové JM. Huanglongbing: a destructive, newly-emerging, century-old disease of citrus. J Plant Pathol. 2006;88:7–37. [Google Scholar]
- Gottwald TR. Current Epidemiological Understanding of Citrus Huanglongbing. Ann Rev Phytopathol. 2010;48:119–139. doi: 10.1146/annurev-phyto-073009-114418. [DOI] [PubMed] [Google Scholar]
- Gottwald TR, Aubert B, Xue-Yuan Z. Preliminary analysis of citrus greening huanglongbing epidemics in China and French Reunion Island Indian Ocean. Phytopathology. 1989;79(6):687–693. doi: 10.1094/Phyto-79-687. [DOI] [Google Scholar]
- Kim JS, Sagaram US, Burns JK, Li JL, Wang N. Response of sweet orange (Citrus sinensis) to ‘Candidatus Liberibacter asiaticus’ infection: microscopy and microarray analyses. Phytopathology. 2009;99(1):50–57. doi: 10.1094/PHYTO-99-1-0050. [DOI] [PubMed] [Google Scholar]
- Lin K-H. Observations on yellow shoot of citrus. Acta Phytopathol Sinica. 1956;2(2):1–10. [Google Scholar]
- O’Donnell PJ, Schmelz EA, Moussatche P, Lund ST, Jones JB, Klee HJ. Susceptible to intolerance: A range of hormonal actions in a susceptible Arabidopsis pathogen response. Plant J. 2003;33(2):245–257. doi: 10.1046/j.1365-313X.2003.01619.x. [DOI] [PubMed] [Google Scholar]
- Chaerle L, Van Caeneghem W, Messens E, Lambers H, Van Montagu M, Van Der Straeten D. Presymptomatic visualization of plant-virus interactions by thermography. Nat Biotech. 1999;17(8):813–816. doi: 10.1038/11765. [DOI] [PubMed] [Google Scholar]
- Dickman MB, Park YK, Oltersdorf T, Li W, Clemente T, French R. Abrogation of disease development in plants expressing animal antiapoptotic genes. Proc Natl Acad Sci USA. 2001;98(12):6957–6962. doi: 10.1073/pnas.091108998. [DOI] [PMC free article] [PubMed] [Google Scholar]
- Xun Z, Sowell RA, Kaufman TC, Clemmer DE. Quantitative proteomics of a presymptomatic A53T alpha-synuclein drosophila model of Parkinson disease. Mol Cell Prot. 2008;7(7):1191–1203. doi: 10.1074/mcp.M700467-MCP200. [DOI] [PMC free article] [PubMed] [Google Scholar]
- Schmidt F, Volker U. Proteome analysis of host-pathogen interactions: Investigation of pathogen responses to the host cell environment. Proteomics. 2011;11(15):3203–3211. doi: 10.1002/pmic.201100158. [DOI] [PubMed] [Google Scholar]
- Ahuja I, de Vos RCH, Bones AM, Hall RD. Plant molecular stress responses face climate change. Trends Plant Sci. 2010;15(12):664–674. doi: 10.1016/j.tplants.2010.08.002. [DOI] [PubMed] [Google Scholar]
- Allwood JW, De Vos RCH, Moing A, Deborde C, Erban A, Kopka J, Goodacre R, Hall RD. Plant metabolomics and its potential for systems biology research: Background concepts, technology, and methodology. Methods Enzymol. 2011;500:299–336. doi: 10.1016/B978-0-12-385118-5.00016-5. [DOI] [PubMed] [Google Scholar]
- Albrecht U, Bowman KD. Gene expression in Citrus sinensis (L.) Osbeck following infection with the bacterial pathogen 'Candidatus Liberibacter asiaticus' causing Huanglongbing in Florida. Plant Sci. 2008;175(3):291–306. doi: 10.1016/j.plantsci.2008.05.001. [DOI] [Google Scholar]
- Albrecht U, Bowman KD. Transcriptional response of susceptible and tolerant citrus to infection with 'Candidatus Liberibacter asiaticus'. Plant Sci. 2012;185–186:118–130. doi: 10.1016/j.plantsci.2011.09.008. [DOI] [PubMed] [Google Scholar]
- Gygi SP, Rochon Y, Franza BR, Aebersold R. Correlation between protein and mRNA abundance in yeast. Mol Cell Biol. 1999;19(3):1720–1730. doi: 10.1128/mcb.19.3.1720. [DOI] [PMC free article] [PubMed] [Google Scholar]
- Washburn MP, Koller A, Oshiro G, Ulaszek RR, Plouffe D, Deciu C, Winzeler E, Yates JR III. Protein pathway and complex clustering of correlated mRNA and protein expression analyses in Saccharomyces cerevisiae. Proc Natl Acad Sci USA. 2003;100(6):3107–3112. doi: 10.1073/pnas.0634629100. [DOI] [PMC free article] [PubMed] [Google Scholar]
- Rose JKC, Bashir S, Giovannoni JJ, Jahn MM, Saravanan RS. Tackling the plant proteome: practical approaches, hurdles and experimental tools. Plant J. 2004;39(5):715–733. doi: 10.1111/j.1365-313X.2004.02182.x. [DOI] [PubMed] [Google Scholar]
- Belle A, Tanay A, Bitincka L, Shamir R, O’Shea EK. Quantification of protein half-lives in the budding yeast proteome. Proc Natl Acad Sci USA. 2006;103(35):13004–13009. doi: 10.1073/pnas.0605420103. [DOI] [PMC free article] [PubMed] [Google Scholar]
- Huber DM Haneklaus S Managing nutrition to control plant disease Landbauforschung Völkenrode 2007574313–322.23713056 [Google Scholar]
- Cevallos-Cevallos JM, García-Torres R, Etxeberria E, Reyes-De-Corcuera JI. GC-MS analysis of headspace and liquid extracts for metabolomic differentiation of citrus huanglongbing and zinc deficiency in leaves of ‘Valencia’ sweet orange from commercial groves. Phytochem Anal. 2011;22(3):236–246. doi: 10.1002/pca.1271. [DOI] [PubMed] [Google Scholar]
- Shokrollah H, Lee Abdullah T, Sijam K, Akmar Abdullah SN. Identification of physical and biochemical characteristic of mandarin (Citrus reticulata) fruit infected by huanglongbing (HLB) Aust J Crop Sci. 2011;5(2):181–186. [Google Scholar]
- He Z-H, Li J, Sundqvist C, Timko MP. Leaf developmental age controls expression of genes encoding enzymes of chlorophyll and heme biosynthesis in pea (Pisum sativum L.) Plant Physiol. 1994;106(2):537–546. doi: 10.1104/pp.106.2.537. [DOI] [PMC free article] [PubMed] [Google Scholar]
- Chen Z, Gallie DR. Dehydroascorbate reductase affects leaf growth, development, and function. Plant Physiol. 2006;142(2):775–787. doi: 10.1104/pp.106.085506. [DOI] [PMC free article] [PubMed] [Google Scholar]
- Huber DM, Graham RD. In: Mineral Nutrition of Crops: Fundamental Mechanisms and Implications. Rengel Z, editor. New York: Food Products Press, the Haworth Press, Inc; 1999. The role of nutrition in crop resistance and tolerance to diseases; pp. 169–206. [Google Scholar]
- Fan J, Chen C, Brlansky RH, Gmitter FG Jr, Li ZG. Changes in carbohydrate metabolism in Citrus sinensis infected with ‘Candidatus Liberibacter asiaticus’. Plant Pathol. 2010;59(6):1037–1043. doi: 10.1111/j.1365-3059.2010.02328.x. [DOI] [Google Scholar]
- Nwugo CC, Huerta AJ. The effect of silicon on the leaf proteome of rice (Oryza sativa L.) plants under cadmium-stress. J Proteome Res. 2011;10(2):518–528. doi: 10.1021/pr100716h. [DOI] [PubMed] [Google Scholar]
- Pushkar Y, Yano J, Sauer K, Boussac A, Yachandra VK. Structural changes in the Mn4Ca cluster and the mechanism of photosynthetic water splitting. Proc Natl Acad Sci USA. 2008;105(6):1879–1884. doi: 10.1073/pnas.0707092105. [DOI] [PMC free article] [PubMed] [Google Scholar]
- Thompson IA, Huber DM. In: Mineral Nutrition and Plant Disease. Datnoff LE, Elmer WE, Huber DM, editor. St. Paul, MN: APS Press; 2007. Manganese and plant disease; pp. 139–153. [Google Scholar]
- Sagaram M, Burns JK. Leaf chlorophyll fluorescence parameters and huanglongbing. J Amer Soc Hort Sci. 2009;134(2):194–201. [Google Scholar]
- Liao H-L, Burns JK. Gene expression in Citrus sinensis fruit tissues harvested from huanglongbing-infected trees: comparison with girdled fruit. J Exp Bot. 2012;63(8):3307–3319. doi: 10.1093/jxb/ers070. [DOI] [PMC free article] [PubMed] [Google Scholar]
- Halliwell B. Reactive species and antioxidants. Redox biology is a fundamental theme of aerobic life. Plant Physiol. 2006;141(2):312–322. doi: 10.1104/pp.106.077073. [DOI] [PMC free article] [PubMed] [Google Scholar]
- Schneider H. Anatomy of greening-disease sweet orange shots. Phytopathology. 1968;58:1155–1160. [Google Scholar]
- Etxeberria E, Gonzalez P, Achor D, Albrigo G. Anatomical distribution of abnormally high levels of starch in HLB-affected Valencia orange trees. Physiol Mol Plant Pathol. 2009;74(1):76–83. doi: 10.1016/j.pmpp.2009.09.004. [DOI] [Google Scholar]
- Fan J, Chen C, Yu Q, Khalaf A, Achor DS, Brlansky RH, Moore GA, Li Z-G, Gmitter FG. Comparative transcriptional and Anatomical Analyses of Tolerant Rough Lemon and Susceptible Sweet Orange in Response to ‘Candidatus Liberibacter asiaticus’ Infection. Mol Plant-Microbe Inter. 2012;25(11):1396–1407. doi: 10.1094/MPMI-06-12-0150-R. [DOI] [PubMed] [Google Scholar]
- Fan J, Chen C, Yu Q, Brlansky RH, Li ZG, Gmitter FG Jr. Comparative iTRAQ proteome and transcriptome analyses of sweet orange infected by ‘Candidatus Liberibacter asiaticus’. Physiol Plant. 2011;143(3):235–245. doi: 10.1111/j.1399-3054.2011.01502.x. [DOI] [PubMed] [Google Scholar]
- Whistler RL, Daniel JR. In: Starch: Chemistry and Technology. 2. Whistler RL, Bemiller JN, Paschall EF, editor. New York: Academic Press; 1984. Molecular structure of starch; pp. 153–182. [Google Scholar]
- Nakamura T, Yamamori M, Hirano H, Hidaka S, Nagamine T. Production of waxy (amylose-free) wheats. Mol Gen Genet. 1995;248:253–259. doi: 10.1007/BF02191591. [DOI] [PubMed] [Google Scholar]
- Murata T, Akazawa T. Stimulative effect of potassium ion on starch synthetase of different plant origins. Plant Cell Physiol. 1969;10(2):457–460. [Google Scholar]
- Armengaud P, Sulpice R, Miller AJ, Stitt M, Amtmann A, Gibon Y. Multilevel analysis of primary metabolism provides new insights into the role of potassium nutrition for glycolysis and nitrogen assimilation in Arabidopsis roots. Plant Physiol. 2009;150(2):772–785. doi: 10.1104/pp.108.133629. [DOI] [PMC free article] [PubMed] [Google Scholar]
- Kaye C, Neven L, Hofig A, Li Q-B, Haskell D, Guy C. Characterization of a gene for spinach CAP160 and expression of two spinach cold-acclimation proteins in tobacco. Plant Physiol. 1998;116(4):1367–1377. doi: 10.1104/pp.116.4.1367. [DOI] [PMC free article] [PubMed] [Google Scholar]
- Collinge DB, Kragh KM, Mikkelsen JD, Nielsen KK, Rasmussen U, Vad K. Plant chitinases. Plant J. 1993;3:31–40. doi: 10.1046/j.1365-313X.1993.t01-1-00999.x. [DOI] [PubMed] [Google Scholar]
- Graham LS, Sticklen MB. Plant chitinases. Can J Bot. 1994;72:1057–1083. doi: 10.1139/b94-132. [DOI] [Google Scholar]
- Bravo JM, Campo S, Murillo I, Coca M, Segundo BS. Fungus- and wound-induced accumulation of mRNA containing a class II chitinase of the pathogenesis-related protein 4 (PR-4) family of maize. Plant Mol Biol. 2003;52(4):745–759. doi: 10.1023/A:1025016416951. [DOI] [PubMed] [Google Scholar]
- Brockstedt E, Otto A, Rickers A, Bommert K, Wittmann-Liebold B. Preparative high-resolution two-dimensional electrophoresis enables the identification of RNA polymerase B transcription factor 3 as an apoptosis-associated protein in the human BL60-2 Burkitt lymphoma cell line. J Protein Chem. 1999;18:225–231. doi: 10.1023/A:1020636308270. [DOI] [PubMed] [Google Scholar]
- Dannenhoffer JM, Schulz A, Skaggs MI, Bostwick DE, Thompson GA. Expression of the phloem lectin is developmentally linked to vascular differentiation in cucurbits. Planta. 1997;201(4):405–414. doi: 10.1007/s004250050083. [DOI] [Google Scholar]
- Read SM, Northcote DH. Subunit structure and interactions of the phloem proteins of Cucurbita maxima pumpkin. Eur J Biochem. 1983;134(3):561–570. doi: 10.1111/j.1432-1033.1983.tb07603.x. [DOI] [PubMed] [Google Scholar]
- Achor DS, Exteberria E, Wang N, Folimonova SY, Chung KR, Albrigo LG. Sequence of anatomical symptom observations in citrus affected with huanglongbing disease. Plant Pathol J. 2010;9:56–64. [Google Scholar]
- Musetti R, Paolacci A, Ciaffi M, Tanzarella OA, Polizzotto R, Tubaro F, Mizzau M, Ermacora P, Badiani M, Osler R. Phloem cytochemical modification and gene expression following the recovery of apple plants from apple proliferation disease. Phytopathology. 2010;100(4):390–399. doi: 10.1094/PHYTO-100-4-0390. [DOI] [PubMed] [Google Scholar]
- Golecki B, Schulz A, Thompson GA. Translocation of structural P proteins in the phloem. Plant Cell. 1999;11(1):127–140. doi: 10.1105/tpc.11.1.127. [DOI] [PMC free article] [PubMed] [Google Scholar]
- Owens RA, Blackburn M, Ding B. Possible involvement of the phloem lectin in long-distance viroid movement. Mol Plant-Microbe Inter. 2001;14(7):905–909. doi: 10.1094/MPMI.2001.14.7.905. [DOI] [PubMed] [Google Scholar]
- Tsukuda S, Gomi K, Yamamoto H, Akimitsu K. Characterization of cDNAs encoding two distinct miraculin-like proteins and stress-related modulation of the corresponding mRNAs in Citrus jambhiri Lush. Plant Mol Biol. 2006;60(1):125–136. doi: 10.1007/s11103-005-2941-4. [DOI] [PubMed] [Google Scholar]
- Cantu MD, Mariano AG, Palma MS, Carrilho E, Wulff NA. Proteomic analysis reveals suppression of bark chitinases and proteinase inhibitors in citrus plants affected by the citrus sudden death disease. Phytopathology. 2008;98(10):1084–1092. doi: 10.1094/PHYTO-98-10-1084. [DOI] [PubMed] [Google Scholar]
- Maserti BE, Del Carratore R, Della Croce CM, Podda A, Migheli Q, Froelicher Y, Luro F, Morillon R, Ollitrault P, Talon M, Rossignol M. Comparative analysis of proteome changes induced by the two spotted spider mite Tetranychus urticae and methyl jasmonate in citrus leaves. J Plant Physiol. 2011;168(4):392–402. doi: 10.1016/j.jplph.2010.07.026. [DOI] [PubMed] [Google Scholar]
- Hammond-Kosack KE, Jones JDG. Resistance gene-dependent plant defense responses. Plant Cell. 1996;8(10):1773–1791. doi: 10.1105/tpc.8.10.1773. [DOI] [PMC free article] [PubMed] [Google Scholar]
- Mittler R, Vanderauwera S, Gollery M, Van Breusegem F. Reactive oxygen gene network of plants. Trends Plant Sci. 2004;9(10):490–498. doi: 10.1016/j.tplants.2004.08.009. [DOI] [PubMed] [Google Scholar]
- Baier M, Dietz KJ. Primary structure and expression of plant homologues of animal and fungal thioredoxin-dependent peroxide reductases and bacterial alkyl hydroperoxide reductases. Plant Mol Biol. 1996;31:553–564. doi: 10.1007/BF00042228. [DOI] [PubMed] [Google Scholar]
- Stacy RA, Munthe E, Steinum T, Sharma B, Aalen RB. A peroxiredoxin antioxidant is encoded by a dormancy-related gene, Per1, expressed during late development in the aleurone and embryo of barley grains. Plant Mol Biol. 1996;31:1205–1216. doi: 10.1007/BF00040837. [DOI] [PubMed] [Google Scholar]
- Bhatt I, Tripathi BN. Plant peroxiredoxins: Catalytic mechanisms, functional significance and future perspectives. Biotech Adv. 2011;29(6):850–859. doi: 10.1016/j.biotechadv.2011.07.002. [DOI] [PubMed] [Google Scholar]
- Rellan-Alvarez R, Andaluz S, Rodriguez-Celma J, Wohlgemuth G, Zocchi G, Alvarez-Fernandez A, Fiehn O, Lopez-Millan AF, Abadia J. Changes in the proteomic and metabolic profiles of Beta vulgaris root tips in response to iron deficiency and resupply. BMC Plant Biol. 2010;10:120. doi: 10.1186/1471-2229-10-120. [DOI] [PMC free article] [PubMed] [Google Scholar]
- Zheng XM, Moncollin V, Egly JM, Chambon P. A general transcription factor forms a stable complex with RNA polymerase B II. Cell. 1987;50(3):361–368. doi: 10.1016/0092-8674(87)90490-9. [DOI] [PubMed] [Google Scholar]
- Huh SU, Kim KJ, Paek KH. Capsicum annuum basic transcription factor 3 (CaBtf3) regulates transcription of pathogenesis-related genes during hypersensitive response upon Tobacco mosaic virus infection. Biochem Biophys Res Commun. 2012;417(2):910–917. doi: 10.1016/j.bbrc.2011.12.074. [DOI] [PubMed] [Google Scholar]
- Soosaar JLM, Burch-Smith TM, Dinesh-Kumar SP. Mechanisms of plant resistance to viruses. Nat Rev Microbiol. 2005;3(10):789–798. doi: 10.1038/nrmicro1239. [DOI] [PubMed] [Google Scholar]
- Kachroo P, Chandra-Shekara AC, Klessig DF. Plant signal transduction and defense against viral pathogens. Adv Virus Res. 2006;66:161–191. doi: 10.1016/S0065-3527(06)66004-1. [DOI] [PubMed] [Google Scholar]
- Kawasaki S, Borchert C, Deyholos M, Wang H, Brazille S, Kawai K, Galbraith D, Bohnert HJ. Gene expression profiles during the initial phase of salt stress in rice. Plant Cell. 2001;13(4):889–905. doi: 10.1105/tpc.13.4.889. [DOI] [PMC free article] [PubMed] [Google Scholar]
- Parker R, Flowers TJ, Moore AL, Harpham NVJ. An accurate and reproducible method for proteome profiling of the effects of salt stress in the rice leaf lamina. J Exp Bot. 2006;57(5):1109–1118. doi: 10.1093/jxb/erj134. [DOI] [PubMed] [Google Scholar]
- Hua Y, Zhang B-X, Cai H, Li Y, Bai X, Ji W, Wang Z-Y, Zhu Y-M. Stress-inducible expression of GsSAMS2 enhances salt tolerance in transgenic Medicago sativa. African J Biotech. 2012;11(17):4030–4038. [Google Scholar]
- Beatrix B, Sakai H, Wiedmann M. The alpha and beta subunit of the nascent polypeptide-associated complex have distinct functions. J Biol Chem. 2000;275(48):37838–37845. doi: 10.1074/jbc.M006368200. [DOI] [PubMed] [Google Scholar]
- Albanese V, Yam AY-W, Baughman J, Parnot C, Frydman J. Systems analyses reveal two chaperone networks with distinct functions in eukaryotic cells. Cell. 2006;124(1):75–88. doi: 10.1016/j.cell.2005.11.039. [DOI] [PubMed] [Google Scholar]
- Flom G, Weekes J, Williams JJ, Johnson JL. Effect of mutation of the tetratricopeptide repeat and asparatate-proline 2 domains of Sti1 on Hsp90 signaling and interaction in Saccharomyces cerevisiae. Genetics. 2006;172(1):41–51. doi: 10.1534/genetics.105.045815. [DOI] [PMC free article] [PubMed] [Google Scholar]
- Kleizen B, Braakman I. Protein folding and quality control in the endoplasmic reticulum. Curr Opin Cell Biol. 2004;16(4):343–349. doi: 10.1016/j.ceb.2004.06.012. [DOI] [PubMed] [Google Scholar]
- Li BQ, Lai TF, Qin GZ, Tian SP. Ambient pH stress inhibits spore germination of Penicillium expansum by impairing protein synthesis and folding: A proteomic-based study. J Proteome Res. 2010;9(1):298–307. doi: 10.1021/pr900622j. [DOI] [PubMed] [Google Scholar]
- Zhang M, Powell CA, Guo Y, Doud MS, Duan Y. A graft-based chemotherapy method for screening effective molecules and rescuing huanglongbing-affected Citrus plants. Phytopathology. 2012;102(6):567–574. doi: 10.1094/PHYTO-09-11-0265. [DOI] [PubMed] [Google Scholar]
- Li W, Hartung JS, Levy L. Quantitative real-time PCR for detection and identification of 'Candidatus Liberibacter' species associated with citrus huanglongbing. J Microbiol Methods. 2006;66(1):104–115. doi: 10.1016/j.mimet.2005.10.018. [DOI] [PubMed] [Google Scholar]
- Banuelos GS, Pasakdee S, Benes SE, Ledbetter CA. Long-term application of biosolids on apricot production. Commun Soil Sci Plant Anal. 2007;38(11–12):1533–1549. [Google Scholar]
Associated Data
This section collects any data citations, data availability statements, or supplementary materials included in this article.
Supplementary Materials
Protein extraction and 2-DE separation parameters of total leaf proteins of Las-infected or uninfected grapefruit plants.
Two-dimensional electrophoresis (2-DE) gel maps of total leaf proteome of grapefruit plants that were infected or uninfected with Las and pre-symptomatic or symptomatic for huanglongbing. (A) Representative gel of uninfected control for pre-symptomatic (UP) plants; (B) Representative gel of infected pre-symptomatic (IP) plants; (C) Representative gel of uninfected control for symptomatic (US) plants; (D) Representative gel of infected symptomatic (IS) plants. Two-year old healthy plants were either graft-inoculated with side shoots from PCR-confirmed Las-infected bud sticks or uninoculated and leaf samples were analyzed at three months post-inoculation (for pre-symptomatic plants) or six months post-inoculation (for symptomatic plants). A total of 200 μg of protein was loaded on a pH 4–7 IpG strip and protein spots were visualized by staining with Coomassie Brilliant Blue (CBB). Mr, relative molecular weight; pI, isoelectric point.
Panels A-T show magnified views of protein spots that were differentially expressed in leaves of grapefruit plants that were uninfected or infected with Las and pre-symptomatic or symptomatic for HLB. UP, uninfected control for pre-symptomatic plants; IP, infected pre-symptomatic plants; US, uninfected control for symptomatic plants; IS, infected symptomatic plants. Two-year old healthy plants were either graft-inoculated with side shoots from PCR-confirmed Las-infected bud sticks or uninoculated and leaf samples were analyzed at three months post-inoculation (for pre-symptomatic plants) or six months post-inoculation (for symptomatic plants). A total of 200 μg of protein was loaded on a pH 4–7 IpG strip and protein spots were visualized by staining with Coomassie Brilliant Blue (CBB).
List of all identified proteins grouped according to multiple spot matches.
Protein spots that were differentially produced according to treatment comparisons described in Figure 3.
Histograms of protein spot volumes highlighting significant differences.
Mascot match results.