

Abstract
Background
Non-adherence to anti-psychotics is common, expensive and affects recovery. We therefore examine the cost-effectiveness of adherence therapy for people with schizophrenia by multi-centre randomised trial in Amsterdam, London, Leipzig and Verona.
Methods
Participants received 8 sessions of adherence therapy or health education. We measured lost productivity and use of health/social care, criminal justice system and informal care at baseline and one year to estimate and compare mean total costs from health/social care and societal perspectives. Outcomes were the Short Form 36 (SF-36) mental component score (MCS) and quality-adjusted life years (QALYs) gained (SF-36 and EuroQoL 5 dimension (EQ5D)). Cost-effectiveness was examined for all cost and outcome combinations using cost-effectiveness acceptability curves (CEACs).
Results
409 participants were recruited. There were no cost or outcome differences between adherence therapy and health education. The probability of adherence therapy being cost-effective compared to health education was between 0.3 and 0.6 for the six cost-outcome combinations at the willingness to pay thresholds we examined.
Conclusions
Adherence therapy appears equivalent to health education. It is unclear whether it would have performed differently against a treatment as usual control, whether such an intervention can impact on quality of life in the short-term, or whether it is likely to be cost-effective in some sites but not others.
Trial registration
Trial registration: Current Controlled Trials ISRCTN01816159
Keywords: Cost effectiveness, Quality-adjusted life year, Antipsychotic, Adherence, Schizophrenia, Psychological therapy
Background
Schizophrenia has notable impacts upon patients, their families, services and the wider economy [1]. Due to its chronic nature, the main aim of health and social care interventions is to improve symptoms, long-term health and quality of life. Treatments and services come at a considerable cost and although it is entirely appropriate to invest resources in helping those affected to manage their illness, there are inevitable pressures to contain costs and use budgets as effectively as possible. Non-adherence (or non-compliance) with anti-psychotic medication is common, due to the severe side-effects that are associated with many of them, and is associated with higher inpatient and total treatment costs [2]. Improving medication adherence is therefore a potential avenue for achieving savings in health care expenditure.
One potential approach is adherence therapy. It mainly uses educational, cognitive-behavioural or motivational techniques to encourage people with schizophrenia to adhere to their prescribed medication regime. There is clearly a need for further discussion and research about the effectiveness, let alone cost-effectiveness, of such treatments as indicated by a recent questioning of the issuing and interpretation of National Institute for Health and Care Excellence (NICE) guidance in England on this matter [3]. In addition to general budget constraints, there can also be resource constraints such as the relative lack of professionals trained in delivering such therapies. Therefore, as well as exploring whether such therapies can avoid unnecessary health care and other costs, there is the additional economic dimension of exploring how these scarce psychological treatments should be allocated.
We examined an adherence therapy as part of a large multi-centre randomised controlled trial (Quality of Life following Adherence Therapy for People Disabled by Schizophrenia and their Carers; QUATRO). Effectiveness evidence from that trial suggested that adherence therapy was equivalent to health education in improving quality of life [4]. It is now widely recognised that health care decision-making should move away from inference based on statistical significance [5] to avoid what Claxton et al. [6] describe as the perverse (and costly) situation of selecting a technology with the lowest chance of being cost-effective. We therefore examined the cost-effectiveness of adherence therapy using a decision-making framework which incorporates any uncertainty surrounding cost and outcomes data.
Methods
Full details of the trial have been described by Gray et al. [4] To summarise, 409 participants with (a) a clinical and research diagnosis of schizophrenia, (b) a need for continuing anti-psychotic medication for at least a year following baseline and (c) evidence of clinical instability in the year before baseline were recruited between June 2002 and October 2003 from a range of general adult psychiatric inpatient and community services at 4 centres: Amsterdam in the Netherlands; Croydon (hereafter referred to as London) in England; Leipzig in Germany; and Verona in Italy. Ethical approval was obtained by all relevant local research ethics committees and participants gave written informed consent: Institute of Psychiatry Research Ethics Committee.
Interventions
Participants were randomised to receive either adherence therapy or a health education package. Adherence therapy was a pragmatic intervention based on motivational interviewing and cognitive behavioural techniques, and aimed to achieve concordance about medication between the participant and therapist. It consisted of five key interventions: medication problem solving; a medication timeline; exploring ambivalence about medication; discussing beliefs and concerns about medication; and using medication in the future. The control intervention, a health education package, aimed to control for the time and non-specific effects of a therapeutic relationship. It provided information on a range of health education topics (e.g. physical health, diet and health and safety in the home), presented in a didactic way without any adherence therapy techniques to clearly differentiate it from the adherence therapy. Both interventions were delivered in routine clinical settings to maximise generalisability. Treatment completion was defined as attendance of at least 5 out of 8 sessions (each lasting 30–50 minutes) over a maximum five-month period.
Data collection
Comprehensive data were collected on all health, social care and other relevant services used by individual study members using a tailored version of the Client Socio-demographic & Service Receipt Inventory (CSSRI-EU). This was adapted from a version specifically developed (with local language equivalents) for another European study [7] and covered: socio-demographics; living situation/accommodation; education, employment and income; time off work; use of health, social care and criminal justice system resources; and informal care. It was administered by face-to-face interview with participants (supplemented with information from key workers and service providers where necessary) at baseline and at one year follow-up, each time covering resource use for the previous 3 months, except in the case of inpatient stays, which were measured for the previous 12 months.
Resources related to the interventions were measured in terms of the number of sessions attended by each participant, the duration of each session and the non-contact time spent by the therapist to prepare or follow-up a session. Therapists extracted these data from their patient case notes onto a study proforma.
Costs
Individual-level costs were calculated by multiplying resource use quantities with country-specific unit costs (Table 1). These were best available estimates from local or national data for each country, based on guidelines tested previously [8]. Alternative approaches were taken for some resource costs. Firstly, some specialised accommodation unit costs were obtained directly from accommodation providers. Secondly, as it was infeasible to collate country-specific unit costs for each of the huge range of medications that patients were likely to report, British medication unit costs were applied to all data using gross domestic product purchasing power parities (GDP PPPs) [9] to adjust for price levels in each country. Finally, the same approach was taken for criminal justice system services given that relatively few people were expected to use these services, such the costs were expected to contribute little to total costs and relevant cost data were not readily available. Inevitably we could not locate/calculate some unit costs within the available time and resources and we imputed these by calculating ratios of one unit cost against another within each site to account for differences in relative prices and then applying the average ratio across sites for the relevant service. Reference services against which other services were compared was selected on the basis of being in the same service sector and all sites having a unit cost estimate for it. Thus, all accommodation and hospital unit costs were compared against the unit cost for an acute psychiatric ward inpatient day, unit costs for community-based services were compared against the unit cost for a community mental health centre and unit costs for all community-based professionals were compared against the unit cost of a psychiatrist. Further details of unit cost sources and assumptions are available in Patel [10] or from the corresponding author.
Table 1.
Unit costs in PPP-adjusted Euros (full details of sources and assumptions are available upon request from the corresponding author)
| Item | Unit | Amsterdam | Leipzig | London | Verona |
|---|---|---|---|---|---|
|
Interventions | |||||
| Adherence therapy & health education |
Therapist hour |
43.16 |
22.36 |
31.62 |
20.82 |
|
Earnings | |||||
| National average wage |
Day |
115.85 |
136.23 |
114.71 |
129.46 |
|
Accommodation | |||||
| Overnight facility, 24 hours staffed |
Day |
156.07 |
58.21 |
80.07 |
109.77 |
| Overnight facility, staffed (not 24 hours) |
Day |
70.94 |
58.21 |
15.20 |
17.66 |
| Overnight facility, unstaffed |
Day |
28.38 |
10.68 |
15.20 |
NA |
|
Hospital inpatient services | |||||
| Acute psychiatric ward |
Inpatient day |
472.95 |
178.51 |
262.52 |
312.59 |
| Psychiatric rehabilitation ward |
Inpatient day |
197.06 |
178.51 |
262.52 |
253.20 |
| Long-stay ward |
Inpatient day |
75.22 |
178.51 |
200.08 |
168.80 |
| Emergency/crisis centre |
Inpatient day |
718.88 |
178.51 |
536.38 |
475.14 |
| General medical ward |
Inpatient day |
273.75 |
253.64 |
397.79 |
288.91 |
|
Hospital outpatient services | |||||
| Psychiatric outpatients |
Attendance |
49.14 |
46.41 |
137.64 |
56.28 |
| Non-psychiatric outpatients |
Attendance |
49.68 |
39.27 |
133.39 |
13.71 |
| Day hospital |
Attendance |
137.90 |
42.46 |
106.37 |
96.90 |
|
Community-based services | |||||
| Community mental health centre |
Minute |
0.29 |
0.43 |
1.39 |
0.10 |
| Day care centre |
Minute |
0.29 |
0.19 |
0.20 |
0.27 |
| Group therapy |
Minute |
0.33 |
0.50 |
0.23 |
0.23 |
| Sheltered workshop |
Minute |
2.31 |
3.45 |
0.17 |
1.68 |
| Specialist education |
Minute |
0.05 |
0.07 |
0.24 |
0.02 |
|
Community-based professionals | |||||
| Psychiatrist |
Minute |
1.10 |
1.22 |
4.97 |
0.98 |
| Psychologist |
Minute |
0.71 |
0.53 |
1.56 |
0.66 |
| Primary care physician |
Minute |
0.90 |
2.55 |
2.55 |
2.22 |
| District nurse |
Minute |
0.43 |
0.49 |
1.09 |
0.50 |
| Community psychiatric nurse/case manager |
Minute |
0.53 |
0.48 |
1.46 |
0.50 |
| Social worker |
Minute |
0.53 |
0.47 |
2.20 |
0.37 |
| Occupational therapist |
Minute |
0.53 |
0.47 |
0.88 |
0.34 |
| Home help/care worker |
Minute |
0.32 |
0.54 |
0.24 |
0.30 |
|
Criminal justice services* | |||||
| Police |
Contact |
119.08 |
119.04 |
83.93 |
119.17 |
| Police cell or prison |
Night |
28.97 |
28.96 |
20.42 |
28.99 |
| Psychiatric assessment in custody |
Assessment |
422.78 |
422.65 |
297.99 |
423.10 |
| Criminal court |
Proceeding |
1999.05 |
1998.46 |
1409.01 |
2000.57 |
| Civil court |
Proceeding |
1286.61 |
1286.22 |
906.85 |
1287.58 |
|
Medications* | |||||
| Range for all used | 100 milligrams | 0.01 to 726.73 | 0.01 to 726.52 | 0.01 to 512.23 | 0.01 to 727.28 |
Shaded areas represent imputed unit costs.
*UK unit costs converted into PPP-adjusted Euros.
Costs of adherence therapy and health education were estimated by first calculating a cost per therapist hour for each site; this was identical for both interventions because they were delivered by the same staff, but variable between sites due to differing staff mixes (nurses versus psychologists) and grades to deliver the interventions. Individual-level intervention costs were then computed by multiplying this with contact and non-contact time.
All costs were originally estimated at 2003 price levels (the most recent study year for which financial information was expected to be available at the time of unit cost data collection). Where necessary, information from the next most recent financial year was adjusted using country-specific GDP inflation rates [11]. Discounting was unnecessary as costs were only assessed for one year.
Once costs for all resource items were estimated for each participant, local cost values were converted into a common currency, Euros, for the purpose of pooled analyses, using the following GDP PPP [9] conversion rates:
▪ 1 Dutch Euro = 0.952 PPP-adjusted Euros
▪ 1 German Euro = 0.924 PPP-adjusted Euros
▪ 1 UK pound sterling = 1.419 PPP-adjusted Euros
▪ 1 Italian Euro = 1.044 PPP-adjusted Euros
All costs reported here were subsequently inflated to 2011 prices using country-specific GDP inflation rates [12].
As inpatient data were reported for a one-year period while other resource use data were reported for a 3-month period (to improve accuracy), costs for the latter were extrapolated (multiplied by 4) to also represent a one-year period.
Outcomes
We focused on two outcomes for the economic evaluation. Firstly, the trial’s primary outcome measure, the mental component summary score (MCS) of the Medical Outcome Study 36 Item Short Form Health Survey (SF-36) [13] at one year. Secondly, quality-adjusted life year (QALY) gains over one year. We have previously reported that for this patient group, QALYs generated from the SF-36 have better distributional properties than those generated from the EuroQol 5-dimensional health state measure (EQ-5D) [14,15] so we focused on SF-36 derived QALYs and used the EQ-5D in sensitive analyses. Utility weights for each measure [16,17] were attached to health states at baseline and one year to calculate QALYs using the total area under the curve approach with linear interpolation between assessment points (and baseline adjustment for comparisons) [18]. All participant-reported outcome assessments were undertaken face-to-face at baseline (prior to randomisation) and at one year follow-up by assessors blinded to participants’ group allocation.
Cost-effectiveness and cost-utility analyses
We took two cost perspectives: (1) health and social care and (2) societal. With two outcomes, plus an additional sensitivity analysis using the EQ5D, there were six cost-outcome combinations to link and examine.
First, we planned to calculate incremental cost-effectiveness ratios (ICERs; mean cost difference divided by mean outcome difference) for any combination showing adherence therapy group to have both higher costs and better outcomes.
Second, given difficulties around estimating confidence intervals for ICERs and the potential for error in decision-making based on statistical significance, we explored uncertainty using a cost-effectiveness plane and cost-effectiveness acceptability curves (CEACs) based on the net-benefit approach [19].
A cost-effectiveness plane represents the additional costs and additional outcomes of one intervention against another. The location of a coordinate represents which of four possible cost-effectiveness scenarios the results fall into. We constructed a plane using bootstrapped regressions (1000 replications) of study group upon total health and social care costs and SF-36-based QALYs, with covariates for baseline costs and utility respectively. The resulting coefficients of group differences were saved and plotted using a scatter graph.
CEACs represent the probability that one intervention is cost-effective compared to another, accounting for hypothetical monetary values that decision-makers may place on point improvements in each outcome. CEACs were constructed by first calculating a series of net benefits for each individual, using the following formula, where λ represents how much value a decision-maker may place on one additional unit of outcome:
We did this for λ values ranging between 0 to 50,000 Euros (in 10,000 Euro increments). Then, for each λ value, we calculated differences in mean net benefits between the two groups using non-parametric bootstrap linear regressions (1000 repetitions) which included covariates for the baseline values of the same cost category and outcome. Finally (again for each λ value), we counted the proportion of times the adherence therapy group had a greater net benefit than the health education group and plotted these proportions as a CEAC for each cost-outcome combination.
Analyses
Analyses were done in SPSS Version 12.0.1 [20] or Stata Version 8.2 [21]. Costs and outcomes are presented as mean values with standard deviations. Mean differences and 95% confidence intervals (CIs) were obtained by non-parametric bootstrap regressions (1000 repetitions) to account for the non-normal distribution commonly found in economic data. Although this was a randomised controlled trial and participants in both groups were expected to be balanced at baseline, baseline costs and outcomes could be predictors of follow-up values. To provide more relevant treatment-effect estimates [22], baseline costs and outcomes were added as covariates for the calculation of mean differences in costs and outcomes respectively (for the ICERs) and mean differences in net benefits (for the CEACs).
All participants were analysed according to the group to which they were randomised. Those lost to follow-up at 12 months were excluded from all analyses; at baseline, these did not differ on the three outcome measures but they had higher health and social care costs (mean difference 18,152 Euros; 95% confidence interval: 1,669 to 39,646 Euros).
Missing items for the SF-36 MCS were dealt with as per the instrument’s instructions. We excluded cases with missing items on the SF-36 and EQ5D for the purpose of utility calculations. There was relatively little item non-response on the CSSRI-EU. Where this did occur, missing values were imputed to enable calculation of total costs for as many participants as possible. A value of zero was assumed where there was no indication of whether or not the resource was used. Where there was incomplete indication of use of a resource (e.g. either number or duration of contacts was given, but not both), missing details were imputed using within-country, within-group median values for resource users with relevant data. In a few situations where there were no such valid cases from which to impute we imputed using cross-country within-group median values or, failing that, cross-country cross-group medians.
Data on health and social care service use were relatively complete (less than 2% missing for any particular service at baseline and less than 3% at follow-up). The majority of missing data occurred for two items – informal care and medications. Up to 43 (11%) participants at baseline and 42 (11%) at follow-up reported receiving help with at least one of the five categories of informal care but did not provide number of hours. For medications, between 9 and 43 (2% to 11%) participants at baseline and between 2 and 27 (1% to 7%) participants at follow-up had some data to indicate medication use, but not enough to allow precise cost estimation. Where medication name was available, costs were imputed from available estimates for those study participants taking the same medication. Where medication name was unavailable, imputations were based on overall medication cost data.
When calculating the costs of the adherence therapy and health education interventions, we summed two separate components, contact time and non-contact time. Where there was an indication of the participant attending at least one intervention session missing components were imputed using within-country, within-group median costs for those who with data.
Results
Participant characteristics
The sample were fairly typical of those seen in prevalence studies of schizophrenia - a mean age of 42 years, 60% male, 15% living with a partner, 40% living alone and 15% employed - and were balanced between randomisation groups (see Gray et al. [4] for further details).
Resource use
The data demonstrate the wide-ranging resource impacts typically associated with schizophrenia. The most heavily used services at both baseline and follow-up were: psychiatric inpatient stays; psychiatric outpatient visits; community mental health centre attendances; psychiatrist contacts; primary care physician contacts; and community psychiatric nurse/case manager contacts (Table 2). At both assessments, virtually all participants reported using one of the five classes of mental health medications assessed for the study (anti-psychotics, anti-depressants, benzodiazepines, mood stabilisers and anti-cholinergics) and most had received anti-psychotics, the mainstay of schizophrenia treatment. Use of benzodiazepines appeared to be reduced in both groups at follow-up, compared with baseline (41% and 35% in each group respectively at baseline, and down to 28% in both groups at follow-up).
Table 2.
Inputs related to adherence therapy and health education
|
Adherence therapy (n = 204) |
Health education (n = 205) |
|||
|---|---|---|---|---|
| Valid n | Mean | Valid n | Mean | |
| Number of sessions |
186 |
7 |
183 |
6 |
| Session duration (minutes) |
173 |
37 |
173 |
31 |
| Total non-contact time across all sessions for attenders (minutes) |
143 |
91 |
154 |
81 |
| Total non-contact time across all sessions for non-attenders (minutes) | 2 | 10 | 5 | 5 |
Approximately half of each group received informal care from family and friends at baseline, mainly in the form of help in and around the house and help with activities outside of the home. Informal care receipt fell to 36% at follow-up in both groups, although weekly average hours of care received (among users) differed between the groups (26 in the adherence therapy group and 8 in the health education group). Rates of contact with criminal justice system services were low.
Employment and time off work
Few people were employed. At baseline, four people in the adherence therapy group and three in the health education group were in voluntary employment at the time of assessment. Twenty-one per cent (n = 42 and n = 43 in the adherence therapy and health education groups respectively) were in paid, self-, sheltered or other employment. Nine per cent of participants in each group had taken time off work due to illness in the past 3 months, totalling a mean (among those who took time off work) of 34 days (SD = 36) in the adherence therapy group and 27 days (SD = 32) in the health education group.
At follow-up, three people in the adherence therapy group and six in the health education group were in voluntary work. Employment rates (for paid, self, sheltered or other work) were 16% (n = 28) in the adherence therapy group and 20% (n = 40) in the health education group. Four per cent (n = 7) of the adherence therapy group took an average of 21 days (SD = 31) due to illness in the past three months, while 7% (n = 14) in the health education group took an average of 18 days (SD = 24) days off.
Interventions
Participants in each group attended an average of 7 adherence therapy sessions and 6 health education sessions respectively (Table 3). There were more treatment completers in the adherence therapy group; 17 (9%) attended four or less sessions (in fact, 5 attended none) and thus did not meet treatment completion criteria. The health education group had 37 (20%) non-completers, of whom 9 (4.9%) attended none. Adherence therapy sessions were on average 6 minutes longer (95% confidence interval: 4 to 8); there were differences in non-contact time.
Table 3.
Resource use at baseline and 1 year follow-up (past 1 year for accommodation & inpatient services, past 3 months for all other services)
|
Adherence therapy (n = 204) |
Health education (n = 205) |
|||||||||||||||
|---|---|---|---|---|---|---|---|---|---|---|---|---|---|---|---|---|
|
Baseline |
1 year follow-up |
Baseline |
1 year follow-up |
|||||||||||||
| Valid n | Users (n, %) | Mean* | Valid n | Users (n, %) | Mean1 | Valid n | Users (n, %) | Mean1 | Valid n | Users (n, %) | Mean1 | |||||
|
Specialised accommodation |
204 |
35 |
(17) |
318 |
177 |
33 |
(19) |
320 |
205 |
35 |
(17) |
328 |
196 |
39 |
(20) |
292 |
|
Secondary care | ||||||||||||||||
| Psychiatric inpatient days |
204 |
86 |
(42) |
102 |
176 |
47 |
(27) |
113 |
205 |
83 |
(41) |
100 |
196 |
50 |
(26) |
100 |
| Non-psychiatric inpatient days |
204 |
14 |
(7) |
16 |
176 |
6 |
(3) |
14 |
205 |
20 |
(10) |
40 |
196 |
12 |
(6) |
17 |
| Psychiatric outpatient visits |
204 |
47 |
(23) |
2 |
177 |
26 |
(15) |
2 |
205 |
53 |
(26) |
3 |
196 |
39 |
(20) |
1 |
| Emergency department & other outpatient visits |
204 |
20 |
(10) |
2 |
177 |
9 |
(5) |
2 |
205 |
14 |
(7) |
1 |
196 |
7 |
(4) |
1 |
| Day hospital visits |
204 |
15 |
(7) |
20 |
177 |
2 |
(1) |
19 |
205 |
9 |
(4) |
4 |
196 |
6 |
(3) |
11 |
|
Community-based services | ||||||||||||||||
| Community mental health centre visits |
204 |
54 |
(27) |
18 |
177 |
60 |
(34) |
19 |
205 |
49 |
(24) |
18 |
196 |
57 |
(30) |
17 |
| Day care centre visits |
204 |
23 |
(11) |
20 |
177 |
14 |
(8) |
16 |
205 |
18 |
(9) |
32 |
196 |
19 |
(10) |
21 |
| Group therapy visits |
204 |
3 |
(2) |
21 |
177 |
3 |
(2) |
21 |
205 |
4 |
(2) |
7 |
196 |
1 |
(1) |
12 |
| Sheltered workshop visits |
204 |
9 |
(4) |
24 |
177 |
2 |
(1) |
22 |
205 |
6 |
(3) |
38 |
196 |
3 |
(2) |
36 |
| Specialist education visits |
204 |
1 |
(< 1) |
24 |
177 |
1 |
(1) |
36 |
205 |
1 |
(< 1) |
4 |
196 |
1 |
(1) |
6 |
|
Primary and community care professionals | ||||||||||||||||
| Psychiatrist contacts |
204 |
140 |
(69) |
4 |
177 |
118 |
(37) |
4 |
205 |
145 |
(71) |
4 |
195 |
143 |
(73) |
3 |
| Psychologist contacts |
204 |
3 |
(2) |
7 |
177 |
6 |
(3) |
15 |
205 |
8 |
(4) |
6 |
196 |
6 |
(3) |
14 |
| Primary care physician contacts |
204 |
86 |
(42) |
2 |
177 |
80 |
(45) |
2 |
205 |
90 |
(44) |
3 |
195 |
84 |
(40) |
2 |
| District nurse contacts |
204 |
3 |
(2) |
27 |
177 |
3 |
(2) |
32 |
205 |
2 |
(1) |
7 |
196 |
4 |
(2) |
26 |
| Community psychiatric nurse/case manager contacts |
204 |
71 |
(35) |
5 |
177 |
67 |
(38) |
8 |
205 |
77 |
(38) |
6 |
195 |
71 |
(36) |
11 |
| Social worker contacts |
204 |
30 |
(15) |
6 |
177 |
19 |
(11) |
4 |
205 |
20 |
(10) |
5 |
195 |
20 |
(10) |
4 |
| Occupational therapist contacts |
204 |
3 |
(2) |
36 |
177 |
5 |
(3) |
16 |
205 |
5 |
(2) |
43 |
195 |
1 |
(1) |
1 |
| Home help/care worker contacts |
204 |
9 |
(4) |
24 |
177 |
5 |
(3) |
26 |
205 |
8 |
(4) |
19 |
195 |
10 |
(5) |
18 |
|
Medications | ||||||||||||||||
| Antipsychotics |
197 |
177 |
(90) |
|
175 |
162 |
(93) |
|
204 |
185 |
(91) |
|
196 |
184 |
(94) |
|
| Antidepressants |
195 |
60 |
(31) |
|
173 |
52 |
(30) |
|
204 |
45 |
(22) |
|
196 |
47 |
(24) |
|
| Benzodiazepines |
194 |
79 |
(41) |
|
174 |
49 |
(28) |
|
204 |
71 |
(35) |
|
196 |
55 |
(28) |
|
| Mood stabilisers |
194 |
20 |
(10) |
|
173 |
17 |
(10) |
|
204 |
23 |
(11) |
|
196 |
22 |
(11) |
|
| Anticholinergics |
195 |
26 |
(13) |
|
173 |
29 |
(17) |
|
204 |
33 |
(16) |
|
196 |
32 |
(16) |
|
|
Informal care hours per week |
204 |
103 |
(50) |
11 |
177 |
63 |
(36) |
14 |
205 |
98 |
(48) |
12 |
195 |
69 |
(35) |
8 |
|
Criminal justice system | ||||||||||||||||
| Police contacts |
204 |
13 |
(6) |
2 |
177 |
6 |
(3) |
1 |
205 |
13 |
(6) |
1 |
196 |
9 |
(5) |
1 |
| Nights spent in police cell or prison |
204 |
3 |
(1) |
22 |
177 |
1 |
(1) |
1 |
205 |
3 |
(1) |
2 |
196 |
2 |
(1) |
6 |
| Psychiatric assessment whilst in custody |
204 |
2 |
(1) |
1 |
177 |
0 |
- |
- |
205 |
1 |
(< 1) |
1 |
196 |
1 |
(1) |
1 |
| Criminal court appearances |
204 |
1 |
(< 1) |
1 |
177 |
0 |
- |
- |
205 |
1 |
(< 1) |
1 |
196 |
2 |
(1) |
2 |
| Civil court appearances | 204 | 3 | (1) | 1 | 177 | 1 | (1) | 1 | 205 | 1 | (< 1) | 1 | 196 | 0 | - | - |
1. Mean for those who used services.
Costs
Average costs of adherence therapy and health education interventions were 192 PPP-adjusted Euros and 138 PPP-adjusted Euros respectively (mean difference 54; 95% confidence interval 37, 70). While adherence therapy cost more than health education, both appear relatively inexpensive (although travel time by therapists and patients are not included).
The majority of total societal costs were formed of health and social care costs, with hospital inpatient costs being the largest contributor. While the adherence therapy group generally had lower costs than the health education group at baseline, confidence intervals did not suggest true differences (Table 4). There were no between-group differences in either total health and social care costs or societal costs at follow-up. Total costs fell from baseline in both groups; inpatient costs at follow-up were only 54–55% of those estimated at baseline.
Table 4.
Mean one-year costs at baseline and 1 year follow-up (PPP-adjusted Euros, 2011 prices)
|
Adherence therapy (n = 204) |
Health education (n = 205) |
Adherence therapy – Health education1 |
||||||||
|---|---|---|---|---|---|---|---|---|---|---|
| Valid n | Mean | (SD) | Valid n | Mean | (SD) |
Unadjusted comparisons |
Baseline-adjusted comparisons |
|||
| Mean difference | 95% confidence interval | Mean difference | 95% confidence interval | |||||||
|
Baseline | ||||||||||
| Accommodation |
204 |
5637 |
(13837) |
205 |
6676 |
(16508) |
-1039 |
-4323, 1640 |
na |
na |
| Inpatient services |
204 |
13649 |
(30841) |
205 |
12659 |
(27797) |
990 |
-4440, 6253 |
na |
na |
| Outpatient services |
204 |
686 |
(2938) |
205 |
314 |
(794) |
372 |
30, 884 |
na |
na |
| Community-based services |
204 |
2973 |
(18688) |
205 |
4532 |
(25686) |
-1559 |
-6200, 2912 |
na |
na |
| Community-based professionals |
204 |
998 |
(1370) |
205 |
1088 |
(2797) |
-90 |
-555, 289 |
na |
na |
| Medication |
197 |
4400 |
(6387) |
204 |
4103 |
(6405) |
297 |
-1031, 1527 |
na |
na |
| Subtotal from health/social care perspective |
197 |
27427 |
(36015) |
204 |
29484 |
(41535) |
-2057 |
-9916, 5882 |
na |
na |
| Informal care |
204 |
5300 |
(12230) |
205 |
5461 |
(14533) |
-161 |
-2756, 2667 |
na |
na |
| Time off work |
202 |
1656 |
(7846) |
204 |
1339 |
(6514) |
316 |
-1190, 1631 |
na |
na |
| Criminal justice system |
204 |
442 |
(4524) |
205 |
368 |
(4440) |
74 |
-862, 1012 |
na |
na |
| Sub-total for non-health/social care costs |
202 |
7451 |
(14805) |
204 |
7197 |
(16157) |
253 |
-3093, 3273 |
na |
na |
| Total from societal perspective |
195 |
35190 |
(39442) |
203 |
36828 |
(44573) |
-1638 |
-9801, 6719 |
na |
na |
|
1 year follow-up | ||||||||||
| Adherence therapy or health education intervention |
204 |
192 |
(93) |
205 |
138 |
(77) |
54 |
37, 70 |
|
|
| Accommodation |
177 |
6112 |
(14523) |
196 |
6504 |
(15953) |
-392 |
-3569, 2659 |
194 |
-1805, 2259 |
| Inpatient services |
176 |
7411 |
(20737) |
196 |
6976 |
(22574) |
435 |
-4025, 4732 |
418 |
-3719, 4318 |
| Outpatient services |
177 |
235 |
(832) |
196 |
226 |
(613) |
10 |
-137, 166 |
5 |
-144, 160 |
| Community-based services |
177 |
1350 |
(5108) |
196 |
3865 |
(29011) |
-2515 |
-7420, 589 |
-237 |
-2168, 1298 |
| Community-based professionals |
177 |
1545 |
(6969) |
195 |
1473 |
(6737) |
72 |
-1267, 1405 |
76 |
-1324, 1411 |
| Medication |
175 |
3202 |
(3942) |
196 |
3549 |
(4737) |
-347 |
-1285, 585 |
-483 |
-1268, 322 |
| Subtotal from health/social care perspective, including intervention cost |
174 |
20115 |
(28339) |
195 |
22597 |
(40727) |
-2483 |
-10017, 4448 |
-757 |
-5820, 4386 |
| Subtotal from health/social care perspective, excluding intervention cost |
174 |
19919 |
(28332) |
195 |
22459 |
(40720) |
-2540 |
-10075, 4385 |
-816 |
-5877, 4331 |
| Informal care |
177 |
4639 |
(17298) |
194 |
2813 |
(6377) |
1826 |
-634, 4602 |
1859 |
-611, 4532 |
| Time off work |
176 |
423 |
(3541) |
196 |
699 |
(4146) |
-277 |
-1043, 506 |
-320 |
-1063, 408 |
| Criminal justice system |
177 |
40 |
(372) |
196 |
978 |
(9963) |
-938 |
-2597, 46 |
-937 |
-2605, 46 |
| Sub-total for non-health/social care costs |
176 |
5118 |
(17679) |
194 |
4508 |
(12220) |
610 |
-2282, 3881 |
596 |
-2451, 4000 |
| Total from societal perspective, including intervention cost |
173 |
25346 |
(32406) |
193 |
26787 |
(41743) |
-1442 |
-9722, 6213 |
10 |
-6915, 6235 |
| Total from societal perspective, excluding intervention cost | 173 | 25149 | (32404) | 193 | 26648 | (41737) | -1499 | -9774, 6153 | -49 | -6979, 6171 |
1. Based on bootstrapped linear regression of group upon cost (1000 repetitions).
na = not applicable to baseline comparisons.
Outcomes
The groups were balanced on all outcome measures at baseline (Table 5). Both groups showed improvements in all outcome measures over time (untested) but there were no differences between the groups at follow-up.
Table 5.
Outcomes at baseline and 1 year follow-up
|
Adherence therapy (n = 204) |
Health education (n = 205) |
Adherence therapy – Health education1 |
||||||||
|---|---|---|---|---|---|---|---|---|---|---|
| Valid n | Mean | (SD) | Valid n | Mean | (SD) |
Unadjusted comparisons |
Baseline-adjusted comparisons |
|||
| Mean difference | 95% confidence interval | Mean difference | 95% confidence interval | |||||||
|
SF-36 MCS | ||||||||||
| Baseline |
191 |
38.39 |
(11.22) |
195 |
40.11 |
(12.15) |
-1.72 |
-4.14, 0.54 |
na |
na |
| 1 year follow-up |
175 |
40.24 |
(11.97) |
192 |
41.32 |
(11.49) |
-1.08 |
-3.43, 1.42 |
-0.33 |
-2.41, 1.79 |
|
SF-36 utilities and QALYs | ||||||||||
| Baseline utility |
191 |
0.66 |
(0.12) |
192 |
0.68 |
(0.13) |
-0.02 |
-0.04, 0.01 |
na |
na |
| 1 year follow-up utility |
177 |
0.68 |
(0.14) |
190 |
0.69 |
(0.13) |
-0.01 |
-0.04, 0.02 |
-0.005 |
-0.03, 0.02 |
| 1 year QALY gain |
166 |
0.67 |
(0.11) |
179 |
0.68 |
(0.12) |
-0.01 |
-0.04, 0.01 |
-0.002 |
-0.01, 0.01 |
| EQ5D utilities and QALYs | ||||||||||
| Baseline utility |
196 |
0.67 |
(0.30) |
198 |
0.69 |
(0.28) |
-0.02 |
-0.08, 0.03 |
na |
na |
| 1 year follow-up utility |
174 |
0.68 |
(0.31) |
193 |
0.74 |
(0.26) |
-0.06 |
-0.12, -0.003 |
-0.04 |
-0.09, 0.01 |
| 1 year QALY gain | 170 | 0.67 | (0.26) | 188 | 0.72 | (0.23) | -0.05 | -0.10, 0.01 | -0.02 | -0.05, 0.01 |
1. Based on bootstrapped linear regression of group upon cost (1000 repetitions).
na = not applicable to baseline comparisons.
Cost-effectiveness and cost-utility
It was not necessary to calculate ICERs because none of the six cost-outcome combinations examined involved both greater costs and better outcomes for the adherence therapy group. In fact, adherence therapy may be ‘dominated’ by health education or involve lower costs alongside worse outcomes – an unlikely basis for choosing a treatment. This conclusion is supported by the spread of cost-outcome differences across all four quadrants of the cost-effectiveness plane (Figure 1) and the slight tendency for estimates to extend further across the south-west quadrant (which represents lower costs and worse outcomes).
Figure 1.

Cost-effectiveness plane (overall) of mean differences in SF36-based QALYs and mean differences in health and social care costs (PPP-adjusted Euros).
CEACs broadly confirmed the neutrality of the cost and outcome findings, with probabilities of adherence therapy being the most cost-effective option ranging between 0.3 and 0.6 from both cost perspectives and for all outcomes for the willingness to pay thresholds we examined (Figure 2). Adherence therapy had greater chances of being cost-effective from the health and social care perspective (solid lines in Figure 2) than the societal perspective (dotted lines).
Figure 2.
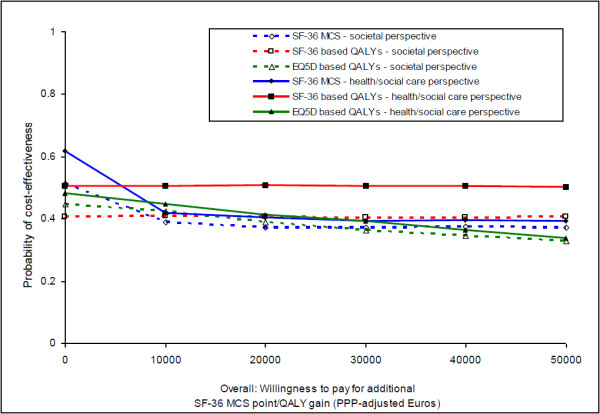
Cost-effectiveness acceptability curves (overall).
Discussion
Effectiveness evidence from the QUATRO study suggested that adherence therapy was equivalent to health education in improving quality of life for people with schizophrenia [4]. This economic evaluation confirms this equivalence by finding no differences in costs (from either of two perspectives), quality-adjusted life years or cost-effectiveness.
As the study shows small outcome improvements and cost reductions over time in both groups, it is unclear whether either intervention had any impact at all and the changes simply reflect the natural course of participants’ recovery because they were recruited during a clinically unstable period. While controlling for the time and attention inputs was necessary, it causes difficulties for interpreting the findings. It is possible that results may have differed with a comparison of treatment as usual [3]. Although many evaluations of adherence interventions naturally assess impact on adherence to medication, the QUATRO study focused on the more over-arching outcome of quality of life (in the expectation that this could be improved via lower symptoms and better functioning) and found no such differences over one year. We do not know whether such effects are more likely to occur in the longer term or whether adherence may not be a mediating factor in improving quality of life, as also suggested in a more recent study of an adherence therapy intervention for people with psychotic disorders [23].
While there is a wealth of evidence suggesting that improvements in medication adherence are associated with reductions in readmissions (e.g. see Staring et al. [23] for a recent example), there is comparatively less by way of ‘formal’ economic evaluation of non-pharmacological interventions (see Andrews et al. [24] for a recent review). A randomised controlled trial of 74 people with psychosis about to move from inpatient residence found that those receiving compliance therapy were five times more likely than those receiving non-specific counselling to take their medication without prompting, and over an 18-month follow-up period had better global functioning, insight, adherence and attitudes to their medication [25]. The associated economic evaluation (which took a broad perspective incorporating health and social care services, education, social security and housing supports, and criminal justice contacts) found the two interventions had similar costs during each of the three 6-month follow-up phases and over the full 18 months [26]. Combined with improved outcomes, this suggested cost-effectiveness. Significant correlations were found between greater adherence and higher costs over the first six months. Therefore, improving adherence initially increased costs, although there was an offsetting reduction over time.
Our study has several strengths. It took a broad cost perspective, which is a necessity to encompass the many and broad-ranging impacts that schizophrenia incurs [27]. The study also had an exceptionally good follow-up rate with minimal missing data among those that were followed up, although it is unclear what the effect on findings may have been if those lost to follow-up had been included given that they had higher costs at baseline compared with those followed up. Finally, this multi-country economic evaluation was undertaken by applying mostly country-specific unit costs to country-specific resource use data, and conducting pooled analyses based on costs converted to a common currency using purchasing power parities. This combination of approaches had the advantages of preserving the within-country link between resource use, costs and outcomes and maintaining a large sample size (generally, but especially so in the context of schizophrenia studies).
However, the multi-country approach also carries methodological challenges (such as wide-scale unit cost collation) and limitations for interpretation and generalisability; for example, there may be variations in adherence to anti-psychotic medication due to broad contextual factors such as culture or ethnicity [28] which in turn impact on costs [29]. We did not intend to examine costs and cost-effectiveness for each site separately because of insufficient sample size for such sub-group analyses (moving away from statistical significance towards the CEAC approach doesn’t necessarily make small sample studies acceptable [5]). Despite similarities in quality of life outcomes between sites, there were variations in resource use, unit costs and resource costs and this may affect the application of the findings to the individual study countries and for policy-making. Such observations could also arise in multi-centre studies carried out within a single country, but are more noticeable in multi-national studies perhaps simply because we are more likely to look for them in this situation. For example, in examining the relative contribution of different resources to total cost, Leipzig shows the greatest difference as compared to the other sites and the pooled results. Its specialised accommodation costs were relatively low compared to the other sites, which is probably due to few such facilities existing there. It also had higher medication costs, both in absolute terms and in terms of the proportion they contribute to total costs, which likely due to greater medication use, rather than differing unit costs, given that all medication costs were based on UK prices. Although there were no statistically significant differences in total health and social care costs between the two groups at one year follow-up at any of the individual sites, there were marked differences in the size of the observed mean (baseline-adjusted) difference: -8868 PPP-adjusted Euros in Leipzig (i.e. a cost saving in the adherence therapy group) to 5421 PPP-adjusted Euros in London (i.e. a cost saving in the health education group). The impact of such variations is apparent in site-specific CEACs (Figure 3), with probabilities of the cost-effectiveness of adherence therapy being highest in Leipzig and lowest in London, for the threshold range examined. While we are cautious about focusing on these site-specific findings due to sample size limitations, they clearly suggest that the potential value of adherence therapy varies across sites and that pooled analyses in trials may not portray such variations. This is an important finding because multi-country trials are increasingly used to increase sample size, speed up recruitment and/or increase generalisability. We further explored the impact on site-specific CEACs when costs are analysed in their local currency, rather than being standardised to a common currency, whilst being kept at their original price year of 2003, rather than being inflated to recent price levels using an inflation rate (GDP-based) that may or may not accurately reflect changes in health care costs over time. This had virtually no impact on the probabilities of cost-effectiveness for each site, with values for all threshold levels varying by no more than 0.007 points away from those obtained from inflated PPP-adjusted Euros.
Figure 3.
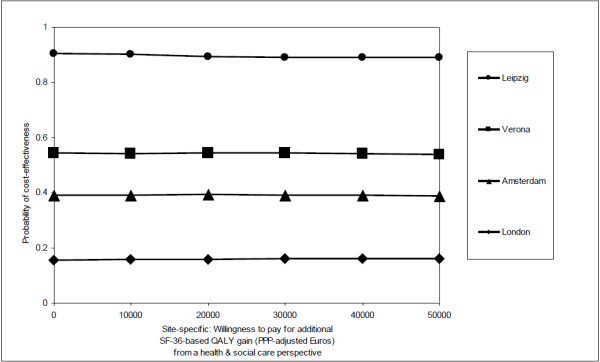
Cost-effectiveness acceptability curves (site-specific).
Conclusions
This study confirms the substantial costs that are required to care for people with schizophrenia and thus the need for cost-effective support for this group of people. This evaluation suggests that adherence therapy doesn’t meet that need when the focus in on quality of life. The clarity of this conclusion is affected by the unknown impact of using an active, rather than treatment as usual, control, uncertainty about the ability of such interventions to impact on quality of life in the short-term and variations in the cost-effectiveness of adherence therapy across the sites.
Abbreviations
CEAC: Cost-effectiveness acceptability curve; CSSRI-EU: Client socio-demographic & service receipt Inventory; EQ5D: EuroQol 5-dimensional health state measure; GDP: Gross domestic product; ICER: Incremental cost-effectiveness ratio; MCS: Mental component score; NICE: National institute for health and clinical excellence; PPP: purchasing power parity; QALY: Quality-adjusted life year; QUATRO: Quality of life following adherence therapy for people disabled by Schizophrenia and their carers; SF-36: Medical outcome study 36 Item short form health survey; UK: United Kingdom
Competing interests
The authors declare that they have no competing interests.
Authors’ contributions
AP designed the economic evaluation, analysed the data and drafted the manuscript. PM designed the economic evaluation and commented on the manuscript. ML oversaw the statistical design of the study, advised on analysis and commented on the manuscript. FA, RK and MKi assisted with estimating unit costs for the Italian, German and Dutch components of the data respectively and commented on the manuscript. MKn, MT and AS conceived the study and participated in its overall design and coordination and commented on the manuscript. All authors read and approved the final manuscript.
Contributor Information
Anita Patel, Email: anita.patel@kcl.ac.uk.
Paul McCrone, Email: paul.mccrone@kcl.ac.uk.
Morven Leese, Email: morven.leese@kcl.ac.uk.
Francesco Amaddeo, Email: francesco.amaddeo@univr.it.
Michele Tansella, Email: michele.tansella@univr.it.
Reinhold Kilian, Email: reinhold.kilian@bkh-guenzburg.de.
Matthias Angermeyer, Email: angermeyer@aon.at.
Martijn Kikkert, Email: martijn.kikkert@arkin.nl.
Aart Schene, Email: a.h.schene@amc.uva.nl.
Martin Knapp, Email: martin.knapp@kcl.ac.uk.
Acknowledgements
This work was supported by a grant from the Quality of Life and Management of Living Resources Programme of the European Union (grant number QLG4-CT-2001-01734).
The QUATRO study was a multi-centre collaboration between the Health Services Research Department, Institute of Psychiatry, King’s College London, London, UK; the Department of Medicine and Public Health, Section of Psychiatry and Clinical Psychology, University of Verona, Italy; the Department of Psychiatry, Leipzig University, and the Department of Psychiatry II, Ulm University, Germany; and the Department of Psychiatry, Academic Medical Center, University of Amsterdam, Netherlands. We wish to acknowledge the contributions of the patients, carers and staff who took part in this study and the contributions of the following further colleagues to the overall QUATRO study: Amsterdam (Annemarie Fouwels, Maarten Koeter, Karin Meijer); Leipzig/Ulm (Thomas Becker, Anja Born*, Anne Gießler*, Hedda Helm*, Bernd Puschner); London (Jonathan Bindman, Jayne Camara, Anthony David, Richard Gray, Mauricio Moreno*, Debbie Robson*, Graham Thornicroft, Ian White); Verona (Corrado Barbui, Lorenzo Burti, Daniela Celani, Doriana Cristofalo, Claudia Goss, Antonio Lasalvia, Giovanna Marrella, Mariangela Mazzi, Michela Nosè, Mirella Ruggeri, Marta Solfa). *Specific thanks for assistance with economic data collation.
References
- Knapp M, Mangalore R, Simon J. The global costs of schizophrenia. Schizophr Bull. 2004;30(2):279–293. doi: 10.1093/oxfordjournals.schbul.a007078. [DOI] [PubMed] [Google Scholar]
- Knapp M, King D, Pugner K, Lapuerta P. Non-adherence to antipsychotic medication regimens: associations with resource use and costs. Br J Psychiatry. 2004;184:509–516. doi: 10.1192/bjp.184.6.509. [DOI] [PubMed] [Google Scholar]
- David A. Treatment adherence in psychoses. Br J Psychiatry. 2010;197:431–432. doi: 10.1192/bjp.bp.110.083022. [DOI] [PubMed] [Google Scholar]
- Gray R, Leese M, Bindman J, Gray R, Leese M, Bindman J, Becker T, Burti L, David A, Gournay K, Kikkert M, Koeter M, Puschner B, Schene A, Thornicroft G, Tansella M. Adherence therapy for people with schizophrenia. European multicentre randomised controlled trial. Br J Psychiatry. 2006;189:508–514. doi: 10.1192/bjp.bp.105.019489. [DOI] [PubMed] [Google Scholar]
- Claxton K. The irrelevance of inference: a decision-making approach to the stochastic evaluation of health care technologies. J Health Econ. 1999;18(3):341–364. doi: 10.1016/S0167-6296(98)00039-3. [DOI] [PubMed] [Google Scholar]
- Claxton K, Sculpher M, Drummond D. A rational framework for decision making by the national institute for clinical excellence (NICE) Lancet. 2002;360(9334):711–715. doi: 10.1016/S0140-6736(02)09832-X. [DOI] [PubMed] [Google Scholar]
- Chisholm D, Knapp MRJ, Knudsen HC, Amaddeo F, Gaite L, van Wijngaarden B. and the EPSILON Study Group. Client Socio-demographic and Service Receipt Inventory – EU version: development of an instrument for international research. Br J Psychiatry. 2000;177(Suppl 39):28–33. doi: 10.1192/bjp.177.39.s28. [DOI] [PubMed] [Google Scholar]
- Chisholm DH. Cross-cultural mental health care evaluation: developing and demonstrating methods for economic analysis. London: PhD Thesis. Institute of Psychiatry, King’s College London, University of London; 2001. [Google Scholar]
- OECD. Purchasing power parities, comparative price levels. 2005. http://www.oecd.org/std/ppp (accessed 12 September 2005)
- Patel A. In: Unit costs of health & social care, 2006. Curtis L, Netten A, editor. Canterbury, England: University of Kent; 2006. Conducting and interpreting multi-national economic evaluations: the measurement of costs; pp. 9–15. [Google Scholar]
- OECD. Economic outlook 77 database. Annex table 16. GDP deflators. 2005. http://www.oecd.org/document/61/0,2340,en_2825_495691_2483901_1_1_1_1,00.html] (accessed 12 September 2005)
- OECD. OECD Economic outlook 90 database. Annex table 1. Real GDP. 2011. http://www.oecd.org/dataoecd/6/27/2483806.xls (accessed 16 December 2011)
- Ware J, Sherbourn C. The MOS, 36 item short-form health survey (SF-36). I conceptual framework and item selection. Med Care. 1992;30:473–483. doi: 10.1097/00005650-199206000-00002. [DOI] [PubMed] [Google Scholar]
- McCrone P, Patel A, Knapp M, McCrone P, Patel A, Knapp M, Schene A, Koeter M, Amaddeo F, Ruggeri M, Giessler A, Puschner B, Thornicroft G. A comparison of SF-6D and EQ-5D utility scores in a study of patients with schizophrenia. J Ment Health Policy Econ. 2009;12:27–31. [PubMed] [Google Scholar]
- The EuroQol Group. EuroQol: a facility for the measurement of health-related quality of life. Health Policy. 1990;16:199–208. doi: 10.1016/0168-8510(90)90421-9. [DOI] [PubMed] [Google Scholar]
- Brazier J, Roberts J, Deverill M. The estimation of a preference-based measure of health from the SF-36. J Health Econ. 2002;21:271–292. doi: 10.1016/S0167-6296(01)00130-8. [DOI] [PubMed] [Google Scholar]
- Dolan P, Gudex C, Kind P, Williams A. A social tariff for EuroQol: results from a UK population survey. York, England: University of York; 1995. [Google Scholar]
- Manca A, Hawkins N, Sculpher MJ. Estimating mean QALYs in trial-based cost-effectiveness analysis: the importance of controlling for baseline utility. Health Econ. 2005;14:487–496. doi: 10.1002/hec.944. [DOI] [PubMed] [Google Scholar]
- Briggs AH. A Bayesian approach to stochastic cost-effectiveness analysis. Health Econ. 1999;8:257–261. doi: 10.1002/(SICI)1099-1050(199905)8:3<257::AID-HEC427>3.0.CO;2-E. [DOI] [PubMed] [Google Scholar]
- SPSS Inc. SPSS for windows release 12.0.1. Chicago, USA: SPSS Inc; 2003. 1989–2003. [Google Scholar]
- StataCorp LP. STATA 8.2 for windows. Texas, USA: StataCorp LP; 2003. 1985–2003. [Google Scholar]
- Assmann SF, Pocock SJ, Enos LE, Kasten LE. Subgroup analysis and other (mis)uses of baseline data in clinical trials. Lancet. 2000;355:1064–1069. doi: 10.1016/S0140-6736(00)02039-0. [DOI] [PubMed] [Google Scholar]
- Staring ABP, Van der Gaag M, Koopmans GT, Staring AB, Van der Gaag M, Koopmans GT, Selten JP, Van Beveren JM, Hengeveld MW, Loonen AJ, Mulder CL. Treatment adherence therapy in people with psychotic disorders: randomised controlled trial. Br J Psychiatry. 2010;197:448–455. doi: 10.1192/bjp.bp.110.077289. [DOI] [PubMed] [Google Scholar]
- Andrews A, Knapp M, McCrone P, Parsonage M, Trachtenberg M. Effective interventions in schizophrenia the economic case: a report prepared for the schizophrenia commission. London, England: Rethink Mental Illness; 2012. [Google Scholar]
- Kemp R, Kirov G, Everitt B, Hayward P, David A. A randomised controlled trial of compliance therapy: 18 months follow-up. Br J Psychiatry. 1998;172:419. doi: 10.1192/bjp.172.5.413. [DOI] [PubMed] [Google Scholar]
- Healey A, Knapp M, Astin J, Healey A, Knapp M, Astin J, Beecham J, Kemp R, Kirov G, David A. Cost-effectiveness evaluation of compliance therapy for people with psychosis. Br J Psychiatry. 1998;172:420–424. doi: 10.1192/bjp.172.5.420. [DOI] [PubMed] [Google Scholar]
- Mangalore R, Knapp M. Cost of schizophrenia in England. J Ment Health Policy Econ. 2007;10:23–41. [PubMed] [Google Scholar]
- Opolka JL, Rascati KL, Brown CM, Gibson PJ. Role of ethnicity in predicting antipsychotic medication adherence. Ann Pharmacother. 2003;37(5):625–630. doi: 10.1345/aph.1C321. [DOI] [PubMed] [Google Scholar]
- King D, Knapp M, Patel A, King D, Knapp M, Patel A, Amaddeo F, Tansella M, Schene A, Koeter M, Angermeyer M, Becker T. The impact of non-adherence to medication in patients with schizophrenia on health, social care and societal costs. Analysis of the QUATRO study. Epidemiol Psychiatr Sci. 2013;10:1–10. doi: 10.1017/S2045796013000097. [DOI] [PMC free article] [PubMed] [Google Scholar]