

Abstract
Recent genome-wide computational screens that search for conservation of RNA secondary structure in whole-genome alignments (WGAs) have predicted thousands of structural noncoding RNAs (ncRNAs). The sensitivity of such approaches, however, is limited, due to their reliance on sequence-based whole-genome aligners, which regularly misalign structural ncRNAs. This suggests that many more structural ncRNAs may remain undetected. Structure-based alignment, which could increase the sensitivity, has been prohibitive for genome-wide screens due to its extreme computational costs. Breaking this barrier, we present the pipeline REAPR (RE-Alignment for Prediction of structural ncRNA), which efficiently realigns whole genomes based on RNA sequence and structure, thus allowing us to boost the performance of de novo ncRNA predictors, such as RNAz. Key to the pipeline's efficiency is the development of a novel banding technique for multiple RNA alignment. REAPR significantly outperforms the widely used predictors RNAz and EvoFold in genome-wide screens; in direct comparison to the most recent RNAz screen on D. melanogaster, REAPR predicts twice as many high-confidence ncRNA candidates. Moreover, modENCODE RNA-seq experiments confirm a substantial number of its predictions as transcripts. REAPR's advancement of de novo structural characterization of ncRNAs complements the identification of transcripts from rapidly accumulating RNA-seq data.
Numerous experimental and computational studies have established the ubiquity, versatility, and pivotal role of noncoding RNAs (ncRNAs). Such RNAs perform diverse regulatory and catalytic biological functions, acting as transcripts without being translated to proteins, in many cases mediated by their distinct stable and evolutionarily conserved structure. Prominent examples are structural precursors to small microRNAs (miRNAs) (Lagos-Quintana et al. 2001; Lau et al. 2001; Schnall-Levin et al. 2010, 2011), structural meso-sized RNAs (200 or fewer bases) including snoRNAs (Bachellerie et al. 2002), tRNAs, and rRNAs, as well as more recently discovered long ncRNAs such as HOTAIR (Gupta et al. 2010), roX1 (Larschan et al. 2011), and Hsrω (Mallik and Lakhotia 2010). Whereas long ncRNAs are assumed to rarely form single stable structures, unlike, for example, the large structural RNaseP:RNA (Masquida and Westhof 2011), the prevalence of local structural motifs in long ncRNAs is as yet largely unknown (The modENCODE Consortium et al. 2010; Gorodkin and Hofacker 2011).
Experimental high-throughput methods, such as the application of RNA-seq by the modENCODE Consortium (The modENCODE Consortium et al. 2010), have catalogued thousands of noncoding transcripts in eukaryotic genomes; yet, they do not by themselves distinguish between structured and unstructured transcripts, nor do they identify local structural motifs. Computational genome-wide screens have identified thousands of potential structural ncRNAs based on conserved RNA structure; however, the true number of structural ncRNAs in eukaryotic genomes still can only be estimated, with current estimates as high as several tens of thousands (Pheasant and Mattick 2007; Esteller 2011).
Computational de novo prediction of structural ncRNA was pioneered by QRNA (Rivas and Eddy 2001), which identifies structural RNAs from pairwise alignments using stochastic context-free grammars (SCFG). By screening multiple whole-genome alignments (WGAs), the more recent approaches of RNAz (Washietl et al. 2005b), which efficiently detects structural stability and conservation by energy minimization and support vector machines, and the phylo-SCFG–based EvoFold (Pedersen et al. 2006) have significantly increased prediction accuracy. Such methods have been applied to screen WGAs of mammals (Washietl et al. 2005a; Pedersen et al. 2006) and Drosophila (applying RNAz [Rose et al. 2007], EvoFold [Stark et al. 2007], and EvoFold-like grammar-based approaches [Bradley et al. 2009]). RNAz and EvoFold have further been run on the ENCODE pilot region of the human genome by Washietl et al. (2007).
A fundamental limitation of these methods is that, for computational efficiency, they rely on fixed WGAs yet do not attempt to correct potential misalignments, which may conceal conserved structures. Since conserved structures can be dissimilar on the sequence level, correctly aligning their sequences is particularly challenging for current whole-genome aligners (Blanchette et al. 2004; Paten et al. 2008; Dubchak et al. 2009), which consider only sequence similarity. Indeed, purely sequence-based methods fail at or below sequence identities of 60% (Gardner et al. 2005). Therefore, structure-based alignment methods are required to avoid or fix misalignments in WGAs. Robustness to “slight” misalignments was first addressed by MSARI (Coventry et al. 2004), which detects significantly conserved RNA secondary structures even if they are slightly misaligned in the WGA. More recently, CMfinder (Yao et al. 2006), which constructs SCFG-based consensus models of RNAs by expectation maximization, has circumvented misalignments by simultaneously performing RNA sequence alignment and de novo ncRNA prediction. However, due to its computational demands, CMfinder and related approaches, such as FOLDALIGN (Gorodkin et al. 1997, 2010), have been limited in their scalability to bacterial genomes and the non-protein-coding subset of the human ENCODE pilot region (Torarinsson et al. 2008), namely, to <1% of a eukaryotic genome. In a recent review, Gorodkin and Hofacker (2011) discuss the advantages of structural alignment–based prediction methods yet identify their lack of speed as a major obstacle.
Here, we present a novel pipeline REAPR for efficient structure-based realignment of whole eukaryote-sized genomes, which can be used to boost the power of any de novo ncRNA predictor (Fig. 1). REAPR reveals ncRNAs whose structural conservation is otherwise difficult to detect in purely sequence-based WGAs due to misalignment. Instead of constructing a WGA from scratch, REAPR realigns an existing WGA through a novel banding technique. Whereas typical banding techniques search for an alignment within a band around the diagonal in an alignment matrix, our method instead searches within a band around a reference alignment. Realignment in this fashion leverages computation already spent in the construction of the reference alignment and allows REAPR to perform structure-based alignments efficiently on a genome-wide scale. REAPR's framework is designed to be flexible, supporting any WGA and ncRNA predictor.
Figure 1.

The whole-genome REAPR (RE-Alignment for Prediction of structural ncRNAs) pipeline. Step 1: The syntenic blocks of the WGA are sliced into windows, which are filtered by thermodynamic stability. Stable windows of the same orientation are merged into stable loci. Step 2: Each candidate locus is realigned based on sequence and structure similarity by LocARNA within limited deviation from the WGA. Step 3: Each realigned locus is evaluated by a de novo ncRNA predictor such as RNAz 2.0 for its likelihood of containing structural ncRNA. The evaluation is then transformed into a q-value to control FDR.
We applied REAPR to realign and predict structural ncRNAs from WGAs of Drosophila and the human ENCODE pilot region. To implement REAPR, we performed realignment of genomes by adapting the fast RNA multiple alignment LocARNA (Will et al. 2007) to our banding technique and predicted ncRNAs with the well-known RNAz. As a novelty in ncRNA prediction, we control the false-discovery rate (FDR), going beyond the usual a posteriori FDR estimation. REAPR reveals roughly twice as many high-confidence predictions in Drosophila melanogaster than direct prediction from the original WGA does at the same FDR. RNA-seq transcriptome data from the modEncode project confirm many of REAPR's predictions in D. melanogaster as transcripts during embryo development. Moreover, the new predictions found only by REAPR tend to have lower sequence identity levels, suggesting that they are inherently more difficult to detect and that previous ncRNA screens were biased toward high identity candidates. Our pipeline increases not only the total number of ncRNA candidates but, more importantly, the number of true candidates, as indicated by a higher sensitivity to known annotations and by FDR estimates. Taken together these results suggest that structural ncRNAs have a much larger presence in Drosophila and humans than previously estimated. Moreover, they demonstrate the benefit and feasibility of incorporating structural information for de novo predictions in functional genomics. Beyond structure and ncRNAs, realignment could also be a powerful means for boosting the prediction of other genomic features.
Results
The realignment pipeline
The REAPR pipeline (Fig. 1) begins by filtering slices (windows) of the given WGA using RNAz's dinucleotide shuffling-based estimation of thermodynamic stability. Stability is a necessary property of structural ncRNAs. It can be conveniently estimated in an alignment-independent way by jointly considering the minimum free energy (MFE) of single sequences in a window. The motivation for this filter is to eliminate windows unlikely to contain ncRNAs due to instability, but retain misaligned ncRNAs for further analysis. Of the remaining windows, those that overlap in the same orientation are merged into regions called stable loci. Finally, these loci are realigned by a new banding variant of LocARNA and evaluated with RNAz 2.0 for the presence of structural ncRNAs. The RNAz scores provide a ranking of the loci, which allows us to identify a set of high-confidence predictions that has the same FDR as previous screens (see Methods).
The workhorse of this pipeline is a novel multiple RNA alignment algorithm that gains significant speed-up through a novel banding technique (see Supplemental Material; Supplemental Figs. 1, 2). Figure 2 illustrates this method by aligning three example sequences within a small “band.” The “reference alignment” in Figure 2A is realigned within a maximum deviation of Δ = 1, resulting in the structure-based alignment in Figure 2F. The deviation limit ensures that the realignment does not alter associations of the reference alignment by more than one position (Δ positions, in general) upstream or downstream. Realignment is performed in a progressive fashion through a series of pairwise alignments. First, sequences X and Y are aligned, because they are more similar to each other than to sequence Z. In contrast to a typical search for the optimal alignment by computing over all matrix entries, the space of possible realignments is restricted to the small band of entries shown in Figure 2B. This band reflects a deviation of 1 or less around the reference alignment between sequences X and Y. The result is the alignment in Figure 2C. Next, this alignment is further aligned with sequence Z, again restricted to the band shown in Figure 2E. To compute this band, we intersect two bands in Figure 2D: the band from the alignment string of X in Figure 2C versus Z, and the band from the respective alignment string of Y versus Z (Fig. 2D). Intersecting the bands from all pairwise combinations ensures that the pairwise deviation constraints are satisfied by the final alignment. Technically, banding reduces the complexity of the whole alignment procedure by a quadratic factor. We implement banding in LocARNA, resulting in a novel realignment-variant of the tool. Orthogonal to banding, LocARNA exploits structural sparsity to cope with the high complexity of the problem; the same sparsification is also seen in other approaches (Bauer et al. 2007; Torarinsson et al. 2007; Do et al. 2008).
Figure 2.
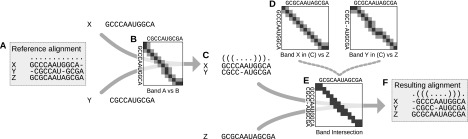
Banding by a reference multiple alignment. The reference alignment (A) is progressively realigned within a limited deviation of Δ = 1, resulting in F. First, the most similar sequences X and Y are aligned such that the alignment lies within the band in B composed of black matrix entries, corresponding to the original alignment of X and Y in the reference; and gray entries, corresponding to deviations of Δ = 1. Next, the intermediate alignment (C) is aligned with sequence Z under the constraints of the band in E. This band is the intersection of the two bands in D generated from the alignment string of X in alignment (C) versus sequence Z, and the alignment string of Y in C versus Z.
Structure-based realignment reveals many novel predictions
We apply REAPR to predict ncRNAs in 12 Drosophila genomes, utilizing the same WGA as previous screens (Rose et al. 2007; Bradley et al. 2009). REAPR with Δ = 20 produces 70% more high-confidence predictions than directly predicting from the original WGA (Fig. 3D). These “novel predictions,” namely, those that are found only after realignment, have visibly lower average pairwise sequence identities (Fig. 3A). When we substitute structure-based realignment by LocARNA in REAPR with purely sequence-based realignment by MUSCLE (Edgar 2004), a substantially smaller number of novel predictions emerge, and low sequence identities are no longer well-represented (Fig. 3B). Note that while the predictions that were lost after realignment with REAPR or MUSCLE concentrate at a high sequence identity >95%, this appears to be largely an artifact of most predictions from the original WGA also having such high identity. Indeed, when the number of lost predictions is normalized by the total number of predictions from the original WGA, the loss appears more uniformly distributed across sequence identities (Supplemental Fig. 3).
Figure 3.
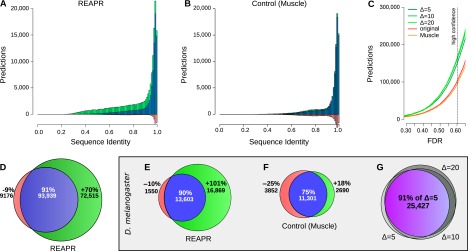
(A–D) High-confidence predictions in fly. Histogram of predictions by REAPR (Δ = 20) using structure-based realignment (A) or by a variant pipeline using purely sequence-based realignment as a function of average pairwise sequence identity (B). Predictions found after realignment (blue + green) are shown together with predictions found directly from the original WGA (blue + red). (C) Number of predictions in fly by REAPR (Δ = 5, 10, 20), the MUSCLE variant, and the original WGA as a function of the FDR set for these pipelines. Note how the MUSCLE curve almost coincides with the curve of predictions from the original WGA. (D) Venn diagram depicting the percentage gain and loss in predictions by REAPR relative to the number of predictions from the original WGA. There are many more novel predictions (green) by REAPR at lower sequence identities. (E–G) High-confidence predictions in D. melanogaster. Percentage gain and loss in predictions by REAPR (E) or by the MUSCLE variant (F) relative to the number of predictions from the original WGA. REAPR predicts roughly twice as many ncRNAs while the MUSCLE variant loses roughly as many predictions as it gains. (G) Overlap in predictions by REAPR under various deviation limits of Δ = 5, 10, 20. The mutual agreement is shown in purple. Predictions are robust to the deviation limit.
Consistently, over a range of FDRs, REAPR still produces more predictions than the MUSCLE pipeline variant or predicting from the original WGA (Fig. 3C). These results strongly suggest that structure-based realignment reveals many novel predictions that cannot be obtained from even high-quality sequence-based methods. Furthermore previous screens may have been biased toward ncRNAs with high sequence conservation since they relied on fixed WGAs.
In Figure 3, A through D, we considered predictions that contain any combination of fly genomes, whereas previous screens restricted attention to loci containing D. melanogaster (Rose et al. 2007; Stark et al. 2007; Bradley et al. 2009). For comparison, we also restricted attention to predictions containing D. melanogaster. Nonetheless, we continue to observe a boost in predictive power through REAPR (Fig. 3E). It produces 101% more high-confidence predictions in D. melanogaster than predicting from the original WGA. On the other hand, the MUSCLE variant produces roughly as many novels predictions as it loses through realignment (Fig. 3F).
REAPR predictions are robust to the deviation limit parameter Δ (Fig. 3G). The sets of high-confidence predictions in D. melanogaster at deviations Δ = 5, 10, and 20 more or less coincide such that their intersection is 91% of the predictions at Δ = 5.
We also demonstrate that predicted ncRNAs can be used to infer the evolutionary distances between two species by calculating the number of predictions where both species are present. We apply this idea using REAPR predictions and are able to recapitulate the Drosophila phylogeny (Supplemental Fig. 4). Since the position of Drosophila willistoni has been recently debated (Bhutkar et al. 2008), we give further evidence toward placing it in the subgenus Drosophila, deviating from the conventional phylogeny of the FlyBase Consortium (Tweedie et al. 2009).
RNA-seq experiments confirm the transcription of many REAPR predictions
High-confidence predictions by REAPR are substantially enriched for transcription. By using RNA-seq experiments uploaded on modMine (Contrino et al. 2012), we analyzed transcriptional activity during D. melanogaster embryo development at every 2-h stage between 0 and 24 h. We quantified the transcription level of a prediction by taking the maximum number of reads overlapping the same position in the prediction (for justification, see Methods). Figure 4A plots the number of predictions whose transcriptional levels are greater than or equal to a given minimum level, based on the stage 20–22 h, which had the most reads out of all stages. To assess the significance of this distribution, we generated a background model of predictions by randomizing their genomic positions while preserving the same prediction lengths and distances between adjacent predictions. We generated a thousand such sets of randomized loci, quantified the loci's transcription levels, and calculated the mean number of loci and standard deviation as a function of the minimum level (blue lines). For minimum levels of 50 reads or higher, significantly fewer randomized loci than actual predictions are identified. The results for all other stages are qualitatively equivalent (data not shown).
Figure 4.
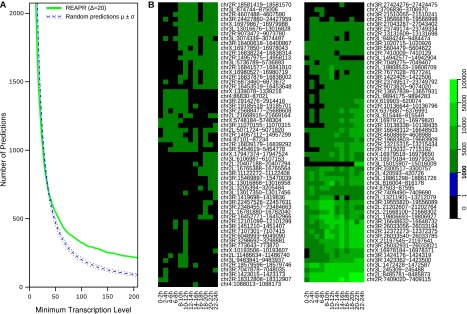
Transcription levels of novel predictions during D. melanogaster embryonic development. The level of each prediction was measured as the maximum number of RNA-seq reads overlapping the same position in a prediction. (A) The distribution of predictions as a function of the minimum transcription level. Levels were calculated using the reads from stage 20–22 h. We show high-confidence predictions from REAPR, Δ = 20 (green). Dashed blue lines represent the expected number of random predictions (μ) and the band of ±1 SD (σ). For example, there are 325 REAPR predictions, versus 200.6 (±15.2) random predictions on average, whose transcriptional levels are 100 reads or higher. (B) Transcription profiles of the 117 REAPR predictions whose levels are at least 1000 reads in at least one stage.
By using these transcriptional levels, we also examined the role of structural ncRNAs in D. melanogaster embryo development. We identified 117 high-confidence predictions whose levels were at least 1000 reads during some development stage (Fig. 4B). Of these, 25 are constitutively expressed above 1000 reads during all stages. Since these sets would seem to contain excellent candidates for further analysis, we provide predictions and transcription profiles at this and several other level thresholds at the REAPR website.
Despite these results, there was not a strong correlation, in general, between the confidence in a prediction and its expression level. Indeed, for high-confidence predictions that have an expression level of at least 50 reads, the Spearman rank correlation coefficient between these two measures is 0.19 (visualized in Supplemental Fig. 5). This is consistent with the idea that a more functionally significant gene is not necessarily expressed at higher levels, and vice versa.
Improved sensitivity for annotated ncRNAs in D. melanogaster
As an independent benchmark for sensitivity, we counted the number of Rfam and FlyBase annotations that overlap with our high-confidence predictions in D. melanogaster. We considered the annotation set Rfam, consisting of 664 ncRNAs from Rfam, and the following four classes of ncRNAs from FlyBase: tRNA (292 tRNAs), miRNA (191 miRNAs), ncRNA (198 annotations including long noncoding RNAs), and miscRNA (390 snoRNAs, snRNAs, and 5S rRNAs).
For every annotation set, more annotations are covered by REAPR (Δ = 20) predictions than those from the original WGA (Fig. 5A). This increase in annotation sensitivity is the net effect of having, on one hand, the novel predictions cover many annotations and, on the other hand, the “lost” predictions, i.e., those that are predicted from the original WGA but not by REAPR, cover hardly any annotations. This negligible contribution by the lost predictions to the annotation sensitivity, despite them comprising 10% of all predictions from the original WGA in Figure 3C, suggests that most of them do not correspond to true ncRNAs.
Figure 5.
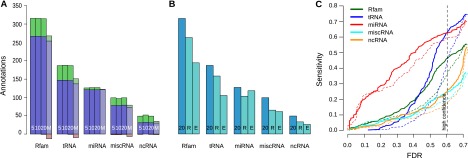
Sensitivity to Rfam and FlyBase ncRNA annotations in D. melanogaster. (A) Comparison of REAPR variants. Each group of four bars shows results for realignment with REAPR Δ = 5 (5), Δ = 10 (10), Δ = 20 (20), and MUSCLE (M). Each bar shows the number of annotations identified with realignment (blue + green), without realignment (blue + red), or both (blue). (B) REAPR versus previous screens by RNAz and EvoFold. For the same annotation classes, we show the predicted annotations by REAPR with Δ = 20 (20) and the previous screens by RNAz (R) and EvoFold (E), where we combined long and short predictions. (C) Sensitivity of predictions by REAPR (solid) or from the original WGA (dashed) to different ncRNA annotation classes as a function of the FDR.
Over a range of FDRs, REAPR still increases the annotation sensitivity (Fig. 5C). Exceptions occur only at low FDRs, where the sensitivities of both approaches are very low such that the difference is not as delineating. On the other hand, the MUSCLE pipeline variant gains coverage for roughly an equal number of annotations as those for which it loses coverage; this suggests that purely sequence-based realignment merely “shifts” sensitivity to other ncRNAs rather than increasing the net sensitivity. Furthermore, high-confidence predictions by REAPR (Δ = 20) overlap with a greater number of annotations than those by a previous RNAz screen (Rose et al. 2007) or the long and short predictions by EvoFold (Fig. 5B; Stark et al. 2007). The sensitivity of the MUSCLE variant, together with the fact that the two previous screens did not employ structure-based realignment, suggests that it is this latter unique feature of REAPR that drives the improvement in sensitivity.
Further analysis of the long ncRNA transcripts in the ncRNA class shows that many of them overlap with only a single prediction, while others are composed of multiple predictions (Supplemental Table 2). Note that REAPR has a relatively high sensitivity for the miRNA class. While mature miRNAs are short and thus likely do not contain any structure, we suspect that REAPR is identifying stable structures of their precursors.
Despite the improvement in annotation sensitivity by REAPR over the original WGA, we sought to gain a better understanding of why not all of the annotations were covered. Toward this end, we examined how the annotation sensitivity necessarily decreases through successive steps of REAPR as the span of genomic loci considered shrinks from the WGA to windows, then to stable loci, and finally to predictions (Supplemental Table 1). Some of the sensitivity loss can be explained in the first step during the slicing of the WGA into windows and selection of windows by using rnazWindow.p1, a tool used in all previous RNAz screens (Washietl et al. 2005b, 2007; Rose et al. 2007). Loss at this step suggests that many ncRNAs may be misaligned at a nonlocal scale, consistent with a similar conclusion by Wang et al. (2007).
Sensitivity for miscRNA and ncRNA are lower than those for other classes (Fig. 5C), perhaps due to qualitative differences in the RNA structure of specific families (miscRNA) and long ncRNAs (ncRNA) that affect prediction. For example, miscRNA contains C/D-box snoRNAs that, with their characteristic stem of ∼5 bp, may be too short to provide a strong enough signal by itself for prediction. Consistent with this idea of weak structures, the decrease in sensitivity due to the stability filter step is very large in these two classes relative to the other classes.
A novel structural motif in the long ncRNA roX1
Figure 6 depicts a novel finding of a putative structural motif in the D. melanogaster gene roX1 (Larschan et al. 2011) at position chrX:3706976–3707066. roX1 is a long ncRNA that increases the expression of the X chromosome in D. melanogaster to compensate for the presence of only one X chromosome in male individuals (Straub and Becker 2007; Larschan et al. 2011). Due to structure-based realignment (LocARNA Δ = 20), REAPR predicts the locus with high-confidence (RNAz score 0.93 and q-value 0.53). It was not predicted either from the original WGA (RNAz score 0, q-value 0.73) or after realignment with MUSCLE (RNAz score 0.72, q-value 0.66). A neighboring high-confidence prediction, which overlaps with a high-confidence prediction (chrX:locus1244) of an earlier RNAz screen by Rose et al. (2007), further hints at the biological relevance of the finding. Both predicted loci have no overlap with the EvoFold screen by Stark et al. (2007). To our knowledge, this structural motif has not been reported previously (Stuckenholz et al. 2003; Byron et al. 2010).
Figure 6.

A novel potential structural motif in the long ncRNA roX1 of the D. melanogaster chromosome X. The alignment is located on columns 9363200–9368080 in the syntenic block X_3665964_3708413 of the fly WGA and corresponds to positions 3706976–3707066 of the D. melanogaster chromosome X. The figure shows the locus alignment of the original WGA (A) and that realigned with LocARNA Δ = 20 (B). RNAalifold (Bernhart et al. 2008) was used to compute the consensus secondary structures (C,D) inferred from A and B, respectively, and generate the graphics of figures (A–D). The colors indicate the structure conservation (saturation) and number of compensatory mutations (hue) in base-paired alignment columns. (E) UCSC Genome Browser visualization of the location of this prediction (X_3665964_3708413.92) and a neighboring one (X_3665964_3708413.185).
Comparison to previous screens in fly and human
Table 1A reports the overlap of high-confidence predictions in D. melanogaster by REAPR (Δ = 20) with previous screens using RNAz (Rose et al. 2007) and EvoFold (Stark et al. 2007). Among the RNAz predictions by Rose et al. (2007), 10,984 (67%) overlap with REAPR predictions, and 8055 (49%; not shown in table) overlap with predictions from the original WGA. These percentages are fairly large compared with the overlap reported between previous screens. For example, Bradley et al. (2009), who screened with several EvoFold-like grammar-based approaches, predict an overlap of only 10% with the predictions by Rose et al. (2007), whereas their predictions overlap up to 60% with EvoFold predictions by Stark et al. (2007). This is presumably a result of both screens using a phylo-grammar–based approach. Among the short and long EvoFold predictions by Stark et al. (2007), 2892 (13%) overlap with REAPR predictions, and only 1767 (8%) overlap with predictions from the original WGA. Overall, REAPR produces substantially more predictions than both screens, with roughly double as many as the RNAz screen by Rose et al. (2007).
Table 1.
Pairwise overlap of REAPR predictions (at Δ = 20) with high-confidence predictions from previous screens by RNAz and EvoFold (long and short) in D. melanogaster, and by RNAz (high-confidence), EvoFold, and CMfinder in the ENCODE pilot region of the human genome
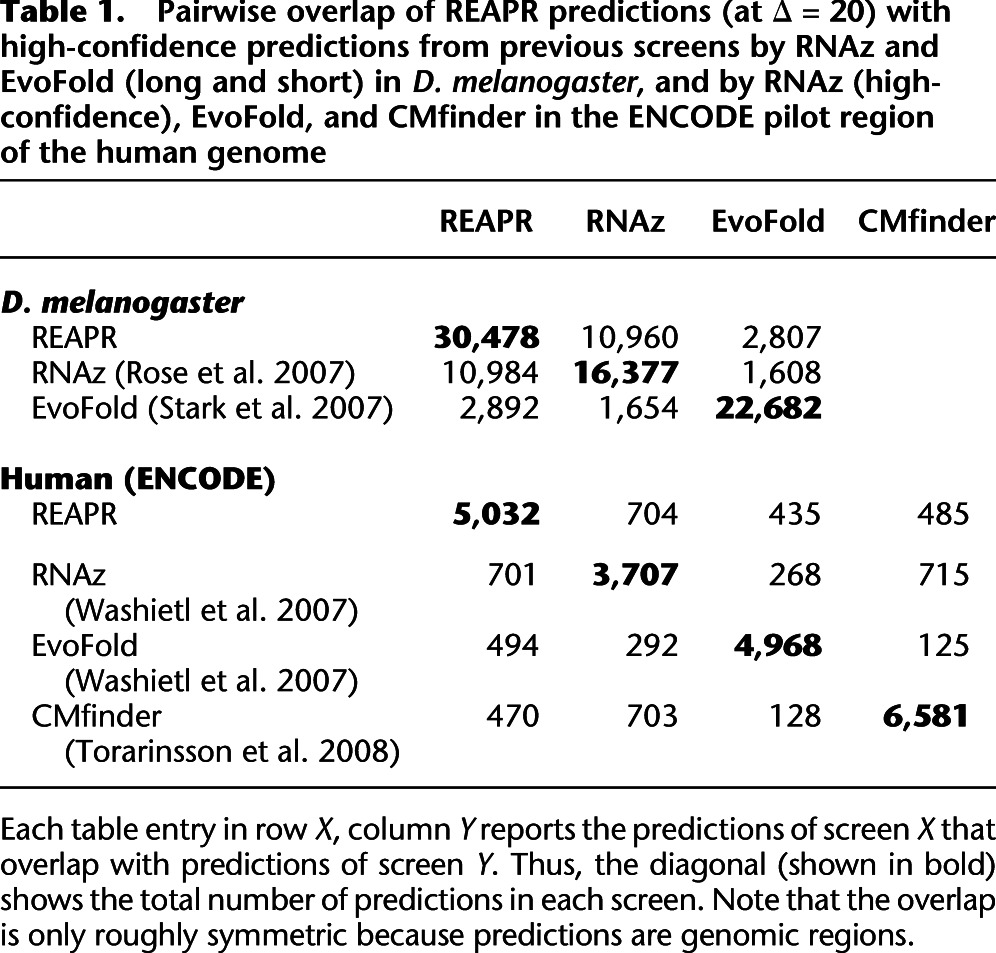
Furthermore, we apply REAPR to an alignment of the human Encode pilot region, namely, 1% of the human genome, with 16 vertebrate genomes. We report the overlap with previous screens using RNAz, EvoFold (both Washietl et al. 2007), and CMfinder (Torarinsson et al. 2008) in Table 1 [see human (ENCODE) data].
For comparability, we ran REAPR under conditions as similar to these previous screens as possible. For example, we used the same Drosophila WGA as in the RNAz screen (Rose et al. 2007); however, this WGA differs from the one used in the EvoFold screen (Stark et al. 2007). For ENCODE, the true FDRs of previous screens are unknown, so we assumed, for the purpose of comparison, an FDR of 60% to control the predictions of REAPR. Nonetheless subtle differences, such as the choice of WGA, uncertain FDRs, and ad-hoc processing in previous screens, inherently remain.
Discussion
We have introduced an efficient pipeline REAPR for genome-wide structure-based realignment of WGAs in order to detect conserved RNA structure even in the case of substantial local misalignment of the original WGA. Whereas the high complexity of structure-based alignment has hitherto impeded such a genome-wide application, we have done so on a whole eukaryotic genome alignment in less than twice the running time of a conventional ncRNA screen without realignment. This breakthrough is achieved through a novel banding algorithm that we introduced for structure-based alignment.
REAPR can accommodate a variety of WGAs, including those constructed by PECAN (Paten et al. 2008) and MULTIZ (Blanchette et al. 2004). Notably, REAPR can handle the larger blocks created by MERCATOR (Dewey 2007), which is often combined with PECAN, whereas CMfinder has only been applied to MULTIZ WGAs with smaller blocks. The larger blocks of MERCATOR/PECAN WGAs more likely contain regions of low sequence identity, where purely sequence-based alignment would frequently misalign structural RNAs. For this reason, we conjecture that Mercator/Pecan will generally benefit from structure-based realignment more than MULTIZ.
Furthermore, REAPR is flexible in the choice of the ncRNA predictor; RNAz 2.0 could be easily substituted with EvoFold in the pipeline. Since both predictors capture different sets of ncRNAs (Rose et al. 2007; Stark et al. 2007; Washietl et al. 2007; Bradley et al. 2009), it is attractive to integrate EvoFold (or related grammar-based predictors from Bradley et al. 2009) into the REAPR pipeline in future work. Due to this modularity, REAPR can directly profit from future advances in predicting structural ncRNAs from fixed alignments. The fast realignment algorithm itself is applicable to an even larger class of potential future screens, in particular to windowless approaches.
Our screen of Drosophila is the first application of structure-based realignment for ncRNA prediction at the eukaryotic-genome scale. From this application, we report biologically relevant, novel findings. Most remarkably, we predict twice as many ncRNAs in D. melanogaster as could be found without structure-based realignment. This increase may be even more significant in light of recent suggestions that previous screens underestimated their FDRs. For example, Gruber et al. (2010) re-estimate the FDR of an RNAz 1.0 screen in ENCODE from the original estimation of 50% (Washietl et al. 2007) to 82%; Bradley et al. (2009) report similar observations in Drosophila.
Given the twofold increase in high-confidence predictions, it seems at first surprising that the increase in sensitivity for annotated ncRNAs, while significant, is not even stronger. By a breakdown to different pipeline stages, we identify nonlocal misalignment as a main culprit. Furthermore, while REAPR detects structural motifs in many long ncRNAs in general and from the annotation class ncRNA, many other long ncRNAs from this class may have no structural signal or signals that are too weak to detect. Lastly, we conjecture that there is bias in the annotation of ncRNAs toward “easy targets” that do not profit from structure-based realignment.
The RNA-seq experiments across fly embryonic development from modENCODE provide further confirmation of our predictions. They do not show the bias of known annotations but do have a high noise level. By combining expression analysis with computational prediction, we have identified highly transcribed and structural RNAs that are distinguished candidates for downstream analysis.
Finally, discovering structural ncRNAs that are misaligned on the syntenic-scale requires applying structure-based methods in the syntenic block construction phase of whole-genome aligners. While this idea is beyond the scope of this article, fast structure-based alignment algorithms will play a key role in coping with this challenge.
Methods
Data
For Drosophila, we used the same WGA as in previous ncRNA screens (Rose et al. 2007; Bradley et al. 2009): a MERCATOR (Dewey 2007) and PECAN (Paten et al. 2008) alignment of 12 Drosophila CAF1 genome sequences (Drosophila 12 Genomes Consortium 2007; http://rana.lbl.gov/drosophila/). It was originally downloaded from http://www.sanger.ac.uk/Users/td2/pecan-CAF1; however, it does not seem to be available anymore, nor could we locate an alternate download mirror. We have uploaded a copy of the alignment onto our supplemental website. For ENCODE, we used the same WGA as in a previous ncRNA screen (Torarinsson et al. 2008): a MULTIZ (Blanchette et al. 2004) alignment of the human genome (hg18, March 2006) with 16 vertebrate genomes. We downloaded the WGA from the UCSC Genome Browser at http://hgdownload.cse.ucsc.edu/goldenPath/hg18/multiz17way/. We obtained hg18 coordinates of ENCODE pilot regions of the human genome from the UCSC Table Browser and generated the subalignment restricted to these regions using Galaxy2 (http://main.g2.bx.psu.edu/).
We obtained annotations of known ncRNAs in D. melanogaster from Rfam 10.0 (Gardner et al. 2011) and FlyBase (Tweedie et al. 2009) release 5.4. We partitioned FlyBase's annotations into the following classes based on their existing separation into files on the FlyBase website: miRNA, miscRNA, ncRNA, and tRNA. We removed pre-miRNAs from the class miRNA and merged overlapping annotations. We downloaded the results of previous screens from the following URLs: http://www.bioinf.uni-leipzig.de/Publications/SUPPLEMENTS/07-001/data/all.rnazClusters.05.bed (Rose et al. 2007); allShort.bed, allLong.bed, and allHighConf.bed located at http://users.soe.ucsc.edu/~jsp/flyFolds/foldClasses/bed/ (Stark et al. 2007); http://genome.ku.dk/resources/cmf_encode/pages/candidates.php (Torarinsson et al. 2008); and rnaz_high.bed and evofold_high.bed located at http://www.tbi.univie.ac.at/papers/SUPPLEMENTS/ENCODE/ (Washietl et al. 2007). Where necessary, we converted genomic coordinates of annotations and predictions to dm2 (release 4 of Berkeley Drosophila Genome Project) of D. melanogaster or to hg18 of human using the liftOver tool from the UCSC Genome Browser.
We downloaded RNA-seq data from modMine (Contrino et al. 2012) at http://intermine.modencode.org/query/experiment.do?experiment=Developmental+Time+Course+Transcriptional+Profiling+of+D.+melanogaster+Embryo+Using+SOLiD+Stranded+Total+RNA-seq. The data come from the modENCODE project “Developmental Time Course Transcriptional Profiling of D. melanogaster Embryo Using SOLiD Stranded Total RNA-seq” led by Sue Celniker. For each embryo developmental time stage X (X = 1,…,12), we downloaded the bedGraph-formatted files BCX_plus.wig and BCX_minus.wig, which list the coverage of every genomic position by positive or negative-stranded reads, respectively.
REAPR pipeline
Stage 1: Constructing stable loci
We used a sliding window approach where we sliced the WGA into overlapping windows of length 120 at every 40 alignment columns. In each window, we removed individual sequences with excessive gap content, GC content, or masked characters. We did both the slicing and removal of sequences by running the script rnazWindow.pl from the RNAz 2.0 package (Gruber et al. 2010), downloaded from http://www.tbi.univie.ac.at/~wash/RNAz/, without an explicit reference sequence (option no-reference) and no limits on the sequence numbers by setting the option max-seqs to be the number of species in the WGA.
Next, we filtered the windows according to thermodynamic stability, which we measured as the mean MFE Z-score of individual sequences in a window. The Z-score of each sequence was computed using the RNAz 2.0 package. Briefly, the Z-score of each sequence is based on a background distribution of MFE values that are computed from a set of shuffled versions of the sequence. The shuffling preserves local features—namely, dinucleotide frequencies and sequence length—because these features affect the background distribution, as argued, for example, by Workman and Krogh (1999) and in RNAz 2.0 by Gruber et al. (2010). An alternative approach to modeling the background distribution would have been to use a set of shuffled sequences from the entire genome. However, since the features are not homogeneous across a genome, using the same shuffled pool for a genome would generate inaccurate z-scores. We removed windows whose mean MFE z-scores are less than −1, since in practice we found that almost all of these windows are too unstable to be predicted downstream to contain ncRNAs. A more lenient approach would have been to keep the window when it contains sequences with very stable MFEs or to selectively remove sequences with unstable MFEs. However, the selective nature of this approach makes it dangerous as it could artificially inflate the apparent structural conservation in a window and lead to a higher FDR. Finally, we merge overlapping or adjacent windows of the same orientation into “stable” loci.
Stage 2: Structure-based realigning with LocARNA and banding
We realigned stable loci with the tool LocARNA 1.6.2 using the options alifold-consensus-dp to compute consensus dot plots by RNAalifold; max-diff to set deviation Δ; and max-diff-aln to specify the reference alignment. Furthermore, we used the Drosophila phylogeny at http://rana.lbl.gov/drosophila/ or the 17-vertebrate phylogeny at http://hgdownload.cse.ucsc.edu/goldenPath/hg18/multiz17way/17way.nh as the guide tree (option treefile). As controls, we also realigned with MUSCLE (Edgar 2004) instead of LocARNA, or we simply forwent realignment.
Stage 3: Evaluating loci with RNAz 2.0
We evaluated realigned loci for the presence of structural ncRNAs using the RNAz 2.0 package. To evaluate alignments generated by LocARNA, we ran RNAz with its structure-based alignment model (option -l), which was trained to evaluate structure-based alignment generated by the close LocARNA-relative LocARNATE (Otto et al. 2008). To evaluate the original WGA or realignments by MUSCLE, we ran RNAz with its sequence-based alignment model. For all evaluations, we use the new dinucleotide-shuffled model of RNAz 2.0 (option -d). For evaluating a locus alignment (in a given orientation), we apply rnazWindow.pl of the RNAz 2.0 package as was already used for constructing stable loci. We regarded the maximal RNAz score of any generated window of the locus as the score of the locus.
Running the pipeline
When running REAPR, the number of CPUs to be used can be specified with the -p option. Parallelization is achieved by assigning the task of realigning each locus with LocARNA or evaluating with RNAz to a separate CPU. The RAM requirement is very low at <80 MB per CPU. There are no other major hardware requirements for running REAPR.
LocARNA with a banding constraint of Δ = 20 runs five times faster on average than without banding. The usage of the options alifold-consensus-dp and treefile also provides additional speedup. These speedups reduce the total amount of computation per locus and are thus independent of parallelization. Overall, running REAPR takes about twice as long as only running RNAz.
Pipeline variants for control
To assess the increase in predictive power gained by structure-based realignment, we also considered two variants of the REAPR pipeline as controls. In the first variant, we forgo realignment and directly feed the original alignment of each stable locus directly to RNAz. If loci are predicted by REAPR but not by this variant, we conclude that structure-based realignment revealed them, and consequently refer to them as “novel predictions.” In the second variant, we isolate the effects of realignment that are not due to explicit consideration of structure by substituting LocARNA with MUSCLE (Edgar 2004) in the pipeline. This variant represents the best realignment pipeline achievable by purely sequence-based alignment since MUSCLE is among the most accurate in this class of methods, even for medium- and low-sequence homology RNA alignments (Gardner et al. 2005). For further analysis, we considered only predictions with high confidence, according to RNAz's score and our estimate of a pipeline's overall FDR.
High-confidence predictions and controlling the FDR
Previous RNAz screens (Washietl et al. 2005a; Rose et al. 2007) defined a set of high-confidence predictions by setting a lower threshold of 0.9 on the RNAz score and then afterward calculating the FDR of the predictions. A problem with this approach is that setting the same threshold does not guarantee the same FDR in different screens. Other factors—including the input WGA, how the FDR was estimated, and other methods that may be specific to a screen—can affect the FDR. Consequently, fixing the threshold produces predictions of arbitrary quality and can complicate the comparison of screens.
Instead, we took a reverse approach where we first set a desired FDR and then calculated the threshold needed to achieve that FDR. In this way, we can directly control the FDR, and hence the quality, of our screens. Doing so also allows us to compare the predictions of our pipeline variants at the same quality. To identify the desired FDR of our screens, we used the FDR that resulted from applying a threshold of 0.9 on the control pipeline variant without realignment. We then adjusted the thresholds for the control variant with MUSCLE realignment and for REAPR to obtain predictions of the same FDR.
Estimating the FDR
By definition, the FDR is the expected ratio of false-positive predictions to the total set of predictions. For a given RNAz score threshold, we estimate the FDR as
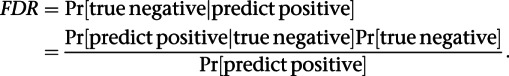 |
Since the unknown probability Pr[true negative] can be assumed to be close to unity in a screen, setting it to unity yields a near-tight upper bound on the FDR. To estimate Pr[predict positive], we divided npred, the number of windows that are in stable loci and that pass the score threshold, by ntotal, the total number of windows considered, i.e., all stable and unstable windows selected by rnazWindow.pl in the first stage of the pipeline.
The challenge behind estimating Pr[predict positive|true negative] is having a set of windows that are true negatives, i.e., they do not contain structural ncRNAs. For this purpose, we constructed a “decoy WGA” that preserved the essential features of the original WGA, such as local dinucleotide frequencies and conservation patterns, but almost surely does not possess conserved RNA structure.
To generate the decoy WGA, we run the first stage of our pipeline to slice the WGA into windows, but we skip the step on filtering by stability. Skipping this step allows the windows to merge into blocks that are longer than the stable loci that would normally form from a filtered set of windows. Moreover, filtering by stability would create a bias, undesired in the decoy WGA, toward structural RNA-containing regions. Next, we shuffled the blocks in nonoverlapping windows of 120 columns in order to preserve local alignment features. Following the approach previously described by Gruber et al. (2010), we shuffled a window using Multiperm (Anandam et al. 2009) if the window's sequence entropy is below 0.5 or using SISSIz (Gesell and Washietl 2008) if the entropy is above 0.5. Both Multiperm and SISSIz preserve the dinucleotide frequencies and conservation pattern in the window. The shuffled blocks together constitute a decoy WGA. Finally, we run the entire pipeline on the decoy WGA to get a set of RNAz scores.
We assume that the scores from the decoy WGA represent a null distribution. Thus, we can estimate the P-value of a threshold by computing the fraction of scores from the decoy WGA that meet the threshold. Correcting for multiple hypothesis testing by the Bonferroni-type procedure previously described by Benjamini and Hochberg (1995), we assign q-values to score thresholds. For this purpose, we applied the procedure p.adjust of the statistics package R to the P-values of the stable windows. In analogy to the P-value, the q-value is the FDR of equal or better predictions. We call a locus a “high-confidence prediction,” if and only if its q-value is greater than or equal to a desired FDR.
RNA-seq analysis
As a result of REAPR's sliding window approach, the exact ncRNA boundaries in our predictions are uncertain (Will et al. 2012). Thus, taking a weighted combination of all reads mapping anywhere in a locus would be an unsuitable approach to quantifying the transcription of our predictions. Instead, we quantified the transcription level of a prediction by taking the maximum number of reads overlapping the same position in the prediction. To keep our analysis independent of correctly predicting the strand of an ncRNA, we merged overlapping predictions regardless of strand and considered both minus- and positive-stranded reads in the quantification.
Software availability
The REAPR pipeline and LocARNA, including the realignment extension, are freely available at http://reapr.csail.mit.edu/. This site also includes predictions and RNA-seq expression analysis.
Acknowledgments
We thank Michael Baym for early discussions on improving whole-genome alignments. This work was partially supported by the German Research Foundation (WI 3628/1-1) and NIH grant RO1GM081871 to B.B.
Footnotes
[Supplemental material is available for this article.]
Article published online before print. Article, supplemental material, and publication date are at http://www.genome.org/cgi/doi/10.1101/gr.137091.111.
Freely available online through the Genome Research Open Access option.
References
- Anandam P, Torarinsson E, Ruzzo WL 2009. Multiperm: Shuffling multiple sequence alignments while approximately preserving dinucleotide frequencies. Bioinformatics 25: 668–669 [DOI] [PubMed] [Google Scholar]
- Bachellerie JP, Cavaille J, Hüttenhofer A 2002. The expanding snoRNA world. Biochimie 84: 775–790 [DOI] [PubMed] [Google Scholar]
- Bauer M, Klau GW, Reinert K 2007. Accurate multiple sequence-structure alignment of RNA sequences using combinatorial optimization. BMC Bioinformatics 8: 271. [DOI] [PMC free article] [PubMed] [Google Scholar]
- Benjamini Y, Hochberg Y 1995. Controlling the false discovery rate: A practical and powerful approach to multiple testing. J R Stat Soc Series B Stat Methodol 57: 289–300 [Google Scholar]
- Bernhart SH, Hofacker IL, Will S, Gruber AR, Stadler PF 2008. RNAalifold: Improved consensus structure prediction for RNA alignments. BMC Bioinformatics 9: 474. [DOI] [PMC free article] [PubMed] [Google Scholar]
- Bhutkar A, Schaeffer SW, Russo SM, Xu M, Smith TF, Gelbart WM 2008. Chromosomal rearrangement inferred from comparisons of 12 Drosophila genomes. Genetics 179: 1657–1680 [DOI] [PMC free article] [PubMed] [Google Scholar]
- Blanchette M, Kent WJ, Riemer C, Elnitski L, Smit AFA, Roskin KM, Baertsch R, Rosenbloom K, Clawson H, Green ED, et al. 2004. Aligning multiple genomic sequences with the threaded blockset aligner. Genome Res 14: 708–715 [DOI] [PMC free article] [PubMed] [Google Scholar]
- Bradley RK, Uzilov AV, Skinner ME, Bendana YR, Barquist L, Holmes I 2009. Evolutionary modeling and prediction of non-coding RNAs in Drosophila. PLoS ONE 4: e6478. [DOI] [PMC free article] [PubMed] [Google Scholar]
- Byron K, Cervantes M, Wang J, Lin W, Park Y 2010. Mining roX1 RNA in Drosophila genomes using covariance models. Int J Comput Biosci 1: 22–32 [Google Scholar]
- Contrino S, Smith RN, Butano D, Carr A, Hu F, Lyne R, Rutherford K, Kalderimis A, Sullivan J, Carbon S, et al. 2012. modMine: Flexible access to modENCODE data. Nucleic Acids Res 40: D1082–D1088 [DOI] [PMC free article] [PubMed] [Google Scholar]
- Coventry A, Kleitman DJ, Berger B 2004. MSARI: Multiple sequence alignments for statistical detection of RNA secondary structure. Proc Natl Acad Sci 101: 12102–12107 [DOI] [PMC free article] [PubMed] [Google Scholar]
- Dewey CN 2007. Aligning multiple whole genomes with Mercator and MAVID. Methods Mol Biol 395: 221–236 [DOI] [PubMed] [Google Scholar]
- Do CB, Foo C-S, Batzoglou S 2008. A max-margin model for efficient simultaneous alignment and folding of RNA sequences. Bioinformatics 24: i68–i76 [DOI] [PMC free article] [PubMed] [Google Scholar]
- Drosophila 12 Genomes Consortium 2007. Evolution of genes and genomes on the Drosophila phylogeny. Nature 450: 203–218 [DOI] [PubMed] [Google Scholar]
- Dubchak I, Poliakov A, Kislyuk A, Brudno M 2009. Multiple whole-genome alignments without a reference organism. Genome Res 19: 682–689 [DOI] [PMC free article] [PubMed] [Google Scholar]
- Edgar RC 2004. MUSCLE: Multiple sequence alignment with high accuracy and high throughput. Nucleic Acids Res 32: 1792–1797 [DOI] [PMC free article] [PubMed] [Google Scholar]
- Esteller M 2011. Non-coding RNAs in human disease. Nat Rev Genet 12: 861–874 [DOI] [PubMed] [Google Scholar]
- Gardner PP, Wilm A, Washietl S 2005. A benchmark of multiple sequence alignment programs upon structural RNAs. Nucleic Acids Res 33: 2433–2439 [DOI] [PMC free article] [PubMed] [Google Scholar]
- Gardner PP, Daub J, Tate J, Moore BL, Osuch IH, Griffiths-Jones S, Finn RD, Nawrocki EP, Kolbe DL, Eddy SR, et al. 2011. Rfam: Wikipedia, clans and the “decimal” release. Nucleic Acids Res 39: D141–D145 [DOI] [PMC free article] [PubMed] [Google Scholar]
- Gesell T, Washietl S 2008. Dinucleotide controlled null models for comparative RNA gene prediction. BMC Bioinformatics 9: 248. [DOI] [PMC free article] [PubMed] [Google Scholar]
- Gorodkin J, Hofacker IL 2011. From structure prediction to genomic screens for novel non-coding RNAs. PLoS Comput Biol 7: e1002100. [DOI] [PMC free article] [PubMed] [Google Scholar]
- Gorodkin J, Heyer LJ, Stormo GD 1997. Finding the most significant common sequence and structure motifs in a set of RNA sequences. Nucleic Acids Res 25: 3724–3732 [DOI] [PMC free article] [PubMed] [Google Scholar]
- Gorodkin J, Hofacker IL, Torarinsson E, Yao Z, Havgaard JH, Ruzzo WL 2010. De novo prediction of structured RNAs from genomic sequences. Trends Biotechnol 28: 9–19 [DOI] [PMC free article] [PubMed] [Google Scholar]
- Gruber AR, Findeiss S, Washietl S, Hofacker IL, Stadler PF 2010. RNAz 2.0: Improved noncoding RNA detection. Pac Symp Biocomput 15: 69–79 [PubMed] [Google Scholar]
- Gupta RA, Shah N, Wang KC, Kim J, Horlings HM, Wong DJ, Tsai M-C, Hung T, Argani P, Rinn JL, et al. 2010. Long non-coding RNA HOTAIR reprograms chromatin state to promote cancer metastasis. Nature 464: 1071–1076 [DOI] [PMC free article] [PubMed] [Google Scholar]
- Lagos-Quintana M, Rauhut R, Lendeckel W, Tuschl T 2001. Identification of novel genes coding for small expressed RNAs. Science 294: 853–857 [DOI] [PubMed] [Google Scholar]
- Larschan E, Bishop EP, Kharchenko PV, Core LJ, Lis JT, Park PJ, Kuroda MI 2011. X chromosome dosage compensation via enhanced transcriptional elongation in Drosophila. Nature 471: 115–118 [DOI] [PMC free article] [PubMed] [Google Scholar]
- Lau NC, Lim LP, Weinstein EG, Bartel DP 2001. An abundant class of tiny RNAs with probable regulatory roles in Caenorhabditis elegans. Science 294: 858–862 [DOI] [PubMed] [Google Scholar]
- Mallik M, Lakhotia SC 2010. Improved activities of CREB binding protein, heterogeneous nuclear ribonucleoproteins and proteasome following downregulation of noncoding hsrω transcripts help suppress poly(Q) pathogenesis in fly models. Genetics 184: 927–945 [DOI] [PMC free article] [PubMed] [Google Scholar]
- Masquida B, Westhof E 2011. RNase P: At last, the key finds its lock. RNA 17: 1615–1618 [DOI] [PMC free article] [PubMed] [Google Scholar]
- The modENCODE Consortium, Roy S, Ernst J, Kharchenko PV, Kheradpour P, Negre N, Eaton ML, Landolin JM, Bristow CA, Ma L, et al. 2010. Identification of functional elements and regulatory circuits by Drosophila modENCODE. Science 330: 1787–1797 [DOI] [PMC free article] [PubMed] [Google Scholar]
- Otto W, Will S, Backofen R 2008. Structure local multiple alignment of RNA. In Proceedings of the German Conference on Bioinformatics (GCB'2008), volume P-136 of Lecture Notes in Informatics (LNI), pp. 178–188. Gesellschaft für Informatik (GI) [Google Scholar]
- Paten B, Herrero J, Beal K, Fitzgerald S, Birney E 2008. Enredo and Pecan: Genome-wide mammalian consistency-based multiple alignment with paralogs. Genome Res 18: 1814–1828 [DOI] [PMC free article] [PubMed] [Google Scholar]
- Pedersen JS, Bejerano G, Siepel A, Rosenbloom K, Lindblad-Toh K, Lander ES, Kent J, Miller W, Haussler D 2006. Identification and classification of conserved RNA secondary structures in the human genome. PLoS Comput Biol 2: e33. [DOI] [PMC free article] [PubMed] [Google Scholar]
- Pheasant M, Mattick JS 2007. Raising the estimate of functional human sequences. Genome Res 17: 1245–1253 [DOI] [PubMed] [Google Scholar]
- Rivas E, Eddy SR 2001. Noncoding RNA gene detection using comparative sequence analysis. BMC Bioinformatics 2: 8. [DOI] [PMC free article] [PubMed] [Google Scholar]
- Rose D, Hackermuller J, Washietl S, Reiche K, Hertel J, Findeiss S, Stadler PF, Prohaska SJ 2007. Computational RNomics of Drosophilids. BMC Genomics 8: 406. [DOI] [PMC free article] [PubMed] [Google Scholar]
- Schnall-Levin M, Zhao Y, Perrimon N, Berger B 2010. Conserved microRNA targeting in Drosophila is as widespread in coding regions as in 3′UTRs. Proc Natl Acad Sci 107: 15751–15756 [DOI] [PMC free article] [PubMed] [Google Scholar]
- Schnall-Levin M, Rissland OS, Johnston WK, Perrimon N, Bartel DP, Berger B 2011. Unusually effective microRNA targeting within repeat-rich coding regions of mammalian mRNAs. Genome Res 21: 1395–1403 [DOI] [PMC free article] [PubMed] [Google Scholar]
- Stark A, Lin MF, Kheradpour P, Pedersen JS, Parts L, Carlson JW, Crosby MA, Rasmussen MD, Roy S, Deoras AN, et al. 2007. Discovery of functional elements in 12 Drosophila genomes using evolutionary signatures. Nature 450: 219–232 [DOI] [PMC free article] [PubMed] [Google Scholar]
- Straub T, Becker P 2007. Dosage compensation: The beginning and end of generalization. Nat Rev Genet 8: 47–57 [DOI] [PubMed] [Google Scholar]
- Stuckenholz C, Meller VH, Kuroda MI 2003. Functional redundancy within roX1, a noncoding RNA involved in dosage compensation in Drosophila melanogaster. Genetics 164: 1003–1014 [DOI] [PMC free article] [PubMed] [Google Scholar]
- Torarinsson E, Havgaard JH, Gorodkin J 2007. Multiple structural alignment and clustering of RNA sequences. Bioinformatics 23: 926–932 [DOI] [PubMed] [Google Scholar]
- Torarinsson E, Yao Z, Wiklund ED, Bramsen JB, Hansen C, Kjems J, Tommerup N, Ruzzo WL, Gorodkin J 2008. Comparative genomics beyond sequence-based alignments: RNA structures in the ENCODE regions. Genome Res 18: 242–251 [DOI] [PMC free article] [PubMed] [Google Scholar]
- Tweedie S, Ashburner M, Falls K, Leyland P, McQuilton P, Marygold S, Millburn G, Osumi-Sutherland D, Schroeder A, Seal R, et al. 2009. FlyBase: Enhancing Drosophila gene ontology annotations. Nucleic Acids Res 37: D555–D559 [DOI] [PMC free article] [PubMed] [Google Scholar]
- Wang AX, Ruzzo WL, Tompa M 2007. How accurately is ncRNA aligned within whole-genome multiple alignments? BMC Bioinformatics 8: 417. [DOI] [PMC free article] [PubMed] [Google Scholar]
- Washietl S, Hofacker IL, Lukasser M, Hüttenhofer A, Stadler PF 2005a. Mapping of conserved RNA secondary structures predicts thousands of functional noncoding RNAs in the human genome. Nat Biotechnol 23: 1383–1390 [DOI] [PubMed] [Google Scholar]
- Washietl S, Hofacker IL, Stadler PF 2005b. Fast and reliable prediction of noncoding RNAs. Proc Natl Acad Sci 102: 2454–2459 [DOI] [PMC free article] [PubMed] [Google Scholar]
- Washietl S, Pedersen JS, Korbel JO, Stocsits C, Gruber AR, Hackermuller J, Hertel J, Lindemeyer M, Reiche K, Tanzer A, et al. 2007. Structured RNAs in the ENCODE selected regions of the human genome. Genome Res 17: 852–864 [DOI] [PMC free article] [PubMed] [Google Scholar]
- Will S, Reiche K, Hofacker IL, Stadler PF, Backofen R 2007. Inferring non-coding RNA families and classes by means of genome-scale structure-based clustering. PLoS Comput Biol 3: e65. [DOI] [PMC free article] [PubMed] [Google Scholar]
- Will S, Joshi T, Hofacker IL, Stadler PF, Backofen R 2012. LocARNA-P: Accurate boundary prediction and improved detection of structural RNAs. RNA 18: 900–914 [DOI] [PMC free article] [PubMed] [Google Scholar]
- Workman C, Krogh A 1999. No evidence that mRNAs have lower folding free energies than random sequences with the same dinucleotide distribution. Nucleic Acids Res 27: 4816–4822 [DOI] [PMC free article] [PubMed] [Google Scholar]
- Yao Z, Weinberg Z, Ruzzo WL 2006. CMfinder—a covariance model based RNA motif finding algorithm. Bioinformatics 22: 445–452 [DOI] [PubMed] [Google Scholar]