

Abstract
To evaluate the effect of CG methylation on DNA binding of sequence-specific B-ZIP transcription factors (TFs) in a high-throughput manner, we enzymatically methylated the cytosine in the CG dinucleotide on protein binding microarrays. Two Agilent DNA array designs were used. One contained 40,000 features using de Bruijn sequences where each 8-mer occurs 32 times in various positions in the DNA sequence. The second contained 180,000 features with each CG containing 8-mer occurring three times. The first design was better for identification of binding motifs, while the second was better for quantification. Using this novel technology, we show that CG methylation enhanced binding for CEBPA and CEBPB and inhibited binding for CREB, ATF4, JUN, JUND, CEBPD, and CEBPG. The CEBPB|ATF4 heterodimer bound a novel motif CGAT|GCAA 10-fold better when methylated. The electrophoretic mobility shift assay (EMSA) confirmed these results. CEBPB ChIP-seq data using primary female mouse dermal fibroblasts with 50× methylome coverage for each strand indicate that the methylated sequences well-bound on the arrays are also bound in vivo. CEBPB bound 39% of the methylated canonical 10-mers ATTGC|GCAAT in the mouse genome. After ATF4 protein induction by thapsigargin which results in ER stress, CEBPB binds methylated CGAT|GCAA in vivo, recapitulating what was observed on the arrays. This methodology can be used to identify new methylated DNA sequences preferentially bound by TFs, which may be functional in vivo.
A striking feature of mammalian genomes is the paucity of CG dinucleotides and their clustering into CG islands (CGI) (Bird 1986). In the University of California, Santa Cruz (UCSC) mouse genome (mm9) database, 16,026 CGIs are reported that represent 0.7% of the genome and contain 5% of all CGs. About half of CGIs are in proximal promoters of housekeeping genes including tumor suppressor genes, and are typically unmethylated. Methylation of CG dinucleotides in CGIs suppresses gene expression (Bird 1986), a phenomenon that occurs in many cancers (Jones and Baylin 2007). Several mechanisms mediate methylation-dependent repression of gene expression from CGIs, including inhibition of transcription factor binding (Bird 1986) and recruitment of methyl binding proteins involved in repression (Meehan et al. 1989).
The 99% of the genome that is not in CGIs contains approximately half of the proximal promoters. The CG dinucleotides in the non-CGI promoters are generally methylated and typically associated with tissue-specific genes. In a single cell type, the majority of expressed genes have unmethylated promoters. When compared between different cells, they have active unmethylated promoters in common, but the active methylated promoters are different, suggesting that many methylated promoters can be active depending on cell type. In contrast to CGI where methylation suppresses gene expression, the effect of methylation on gene expression in active CG-poor tissue-specific promoters is less clear (Bird 1986; Vinson and Chatterjee 2012). Tissue-specific promoter demethylation sometimes accompanies gene expression but typically occurs after the methylated promoter becomes active (Grainger et al. 1983). Recent global analysis of gene expression and CG methylation has identified many examples of methylation at active promoters (Eckhardt et al. 2006; Weber et al. 2007; Hansen et al. 2011). Recently, it was observed that some CG poor promoters need to be methylated in order to be activated during differentiation of primary newborn mouse keratinocytes and dermal fibroblasts into adipocytes (Rishi et al. 2010; Chatterjee and Vinson 2012). The suggested mechanism is that CG methylation enhances the DNA binding of CEBPA, a B-ZIP protein involved in activation of cellular differentiation in many tissues (Rishi et al. 2010).
B-ZIP proteins are eukaryotic transcription factors that bind sequence specifically in the major groove of DNA as either homodimers or heterodimers (Vinson et al. 1989, 2002; Newman and Keating 2003). Optimal DNA binding is observed to palindromic sequences, such as the canonical CEBP (TTGC|GCAA) and CRE (TGAC|GTCA) motifs. Each monomer in the dimer binds one-half of the palindrome, with both monomers binding the central CG dinucleotide. For clarity, we place a vertical line in the center of B-ZIP motifs and describe motifs as half-sites, e.g., the CEBP half-site is TTGC|G or its complement C|GCAA. Both the CEBP and CRE motifs have a CG dinucleotide at the center of the transcription factor binding site (TFBS), and methylation has the opposite effect on the DNA binding: It enhances CEBPA binding and inhibits CREB binding (Iguchi-Ariga and Schaffner 1989; Rishi et al. 2010).
Unmethylated microarrays have been used to identify TF binding to many DNA sequences (Berger et al. 2008). We modified the protein binding microarray technology to evaluate how methylation (Bulyk et al. 1999) of the CG dinucleotide affects DNA binding of B-ZIP transcription factors.
Results
CG methylation of DNA microarrays
The effect of cytosine methylation of the CG dinucleotide on DNA binding of B-ZIP proteins to multiple DNA sequences was determined using two microarray designs. One probe design has 16 sectors per slide with each sector containing 40,000 features (40K) (Lam et al. 2011). Each feature contains a 60-bp DNA with a common 25-mer at the surface of the glass that hybridizes with a primer used for the DNA double-stranding reaction. The remaining 35-mer is unique in each feature and designed such that all possible 8-mers occur 32 times (Lam et al. 2011). DNA on the array was enzymatically double-stranded, a process monitored by fluorescence of a spiked Cy3 labeled cytosine in the dNTP mixture. The methyltransferase enzyme M.SssI was added to the array to methylate CG dinucleotides. DNA methylation prevented digestion by the methylation-sensitive endonuclease HpaII, which cuts only the nonmethylated CCGG 4-mer, suggesting that the methylation reaction went to completion (Fig. 1A,B). The methylation-insensitive endonuclease MspI that cuts CCGG independent of CG methylation served as a control (Supplemental Fig. 1A,B).
Figure 1.

The effects of methylation on DNA binding properties of B-ZIP proteins. (A,B) Validation of CG methylation using methylation-sensitive (HpaII) endonuclease. The 40K feature microarray is scanned at 570 nm to detect Cy3-cytosine spiked into the DNA double-stranding reactions. Fluorescence intensities before and after methylation were normalized. DNA features containing CCGG are in red. Fluorescence intensities on (A) unmethylated and (B) methylated arrays before and after HpaII digestion. (C–H) Z-scores for all 32,896 8-mers from unmethylated and methylated 40K feature microarray. Lines are fitted to the non-CG 8-mers, which show no change in Z-scores between unmethylated and methylated arrays and serve as an internal control. The 8-mers are color-coded: CG (gray), non-CG (black), TTGC|G (green), TGAC|G (red), CGAT|G (blue), and chimeric CRE|CEBP sequence TGAC|GCAA is shown in brown. The best-bound 8-mers are indicated by arrows. (C) CEBPA-GST. (D) CEBPB-GST. (E) CEBPD-GST. (F) CREB1-GST. (G) ATF4-GST. (H) CEBPB-GST|ATF4.
Initially, we found that M.SssI incubation affected B-ZIP binding to both CG- and non-CG-containing 8-mers (Supplemental Fig. 1C,D). We reasoned that the M.SssI enzyme may stick to DNA and affect subsequent B-ZIP binding. Methylated arrays were thus incubated with proteinase K to digest any bound M.SssI. Following this treatment, methylation only affected B-ZIP binding to CG-containing sequences (Supplemental Fig. 1E,F). All data reported hereafter were obtained following the proteinase K treatment.
B-ZIP homodimers that bind methylated DNA
To monitor B-ZIP binding to the arrays, glutathione S-transferase (GST) was fused to the B-ZIP C terminus, and binding was measured using a fluorescent antibody to GST. Binding of eight B-ZIP domains to both unmethylated and methylated 40K arrays (Fig. 1C–G; Supplemental Fig. 2A–D) was reproducible (Supplemental Fig. 2E). We evaluated binding of B-ZIP proteins to 8-mers using a median signal intensity (Z-score) and a rank-order-based score (E-score) (Supplemental Fig. 3; Badis et al. 2009). To determine the length of binding sites, we calculated Z-scores for 5-mers representing a half-site (Supplemental Fig. 4) to 9-mers.
Before methylation, the best-bound 9-mer for all four CEBP family members (CEBPA, CEBPB, CEBPD, and CEBPG) is the canonical CEBP site TTGC|GCAAT (Supplemental Table 1A,B; Johnson 1993). CREB1, ATF4, JUN, and JUND bound the CRE (TGAC|GTCA) 8-mer (Fig. 1F,G; Supplemental Figs. 2A,B, 3E–H; Benbrook and Jones 1994). Only CREB1 shows specificity for a 9-mer (Supplemental Table 1C). JUN and JUND also bound the 7-mer (TGAC/GTCA) known as the TRE or AP-1 motif that could be extended to the 8-mer (TGAC/GTCAT) (Supplemental Table 1C). The ATF4 homodimer does not show strong DNA binding specificity, consistent with its in vivo function as a monomer heterodimerizing with other B-ZIP monomers (Ameri and Harris 2008). DNA binding following CG methylation was enhanced for CEBPA (P < 3.2 × 10⁻²) and CEBPB (P < 1.8 × 10⁻²) and inhibited for CREB1 (P < 2.1 × 10⁻²⁸), ATF4 (P < 1.0 × 10−76), JUN (P < 8.7 × 10−84), JUND (P < 7.1 × 10−81), CEBPD (P < 2.2 × 10⁻³), and CEBPG (P < 1.2 × 10⁻³), based on the best-bound 8-mer (Fig. 1C–G; Supplemental Fig. 2A–C; Supplemental Table 1D; Rishi et al. 2010; Warren et al. 2012).
CEBPB|ATF4 heterodimers bind methylated CGAT|GCAA
CEBPB is known to heterodimerize with ATF4 and bind a chimeric site TGAC|GCAA that contains both the CRE half-site (TGAC|G) and the CEBP half-site (C|GCAA) (Vinson et al. 1993). CEBPB is constitutively expressed in cells, while ATF4 protein is induced by cellular stress (Lu et al. 2004; Vattem and Wek 2004) and potentially heterodimerizes with CEBPB to bind new DNA sequences (Vinson et al. 1993). To examine how methylation affects DNA binding of the CEBPB|ATF4 heterodimer under conditions that mimic the biological situation, we labeled CEBPB with GST and added unlabeled ATF4. On unmethylated arrays, the CEBPB|ATF4 heterodimer preferentially binds the chimeric site TGAC|GCAA and TGAT|GCAA (Fig. 1H; Supplemental Table 2). The second sequence is the deaminated product of the chimeric sequence. Following methylation, the CEBPB|ATF4 heterodimer increased binding to CGAT|GCAA (P < 1.4 × 10−88) (Supplemental Table 1D). The half-site T|GCAA is the deaminated CEBP half-site C|GCAA. Thus, T|GCAA is presumably bound by CEBPB, suggesting that ATF4 binds the other half-site (mCGAT|G) (Fig. 1H). This newly identified 5-mer CGAT|G site differs from the half-CRE site TGAC|G, the known binding half-site for ATF4, with the two pyrimidines, T and C, being switched, moving the CG dinucleotide from the center of the dyad to its flank. We also used GST-labeled ATF4 and unlabeled CEBPB and obtained similar results, suggesting that the GST tag is not contributing to these results (Supplemental Fig. 5A–D). Examination of 5-mer binding fails to identify CGAT|G as the top methylated sequence bound by CEBPB|ATF4 (Supplemental Fig. 5E,F), indicating that this 5-mer cannot function alone; instead, it needs the specificity from the CEBP half-site for heterodimer binding.
180K feature array: Quantitation of CG methylation on TF DNA binding
To evaluate the magnitude of changes in DNA binding following CG methylation, we designed a 180K array where each feature contains one of the 65,536 possible 8-mers. All non-CG 8-mers are present twice, and all CG-containing 8-mers are present three times in different background sequences (Supplemental Fig. 6A,B). All features have a T at the 5′ end and an A at the 3′ end of every 8-mer (TNNNNNNNNA). Arrays were methylated and digested with both HpaII and MspI, which confirmed that the methylation reaction went to completion (Fig. 2A,B; Supplemental Fig. 6C,D). Changes in fluorescence intensity are more uniform following enzymatic digestion compared to the 40K array (Fig. 1A,B; Supplemental Fig. 1A,B) because the CCGG 4-mer is always in the middle part of the probe, whereas in the 40K array, it can be anywhere along the length of the probe. Complementary 8-mers were evaluated separately because the flanking sequences could be part of the binding site and could break the complementarity (Supplemental Fig. 7). The 180K array design is able to quantify binding intensity to different sequences but is less optimal for identifying favored motifs because all 8-mers are flanked by the same nucleotide which may be part of the TFBS. On the 40K array, in contrast, the flanking sequences of multiple (16 or 32) occurrences of each 8-mer are random, minimizing any consistent influence on binding.
Figure 2.

Validation of CG methylation and CEBPA binding on 180K array. (A,B) Digestion of (A) unmethylated and (B) methylated 180K feature microarray using methylation sensitive (HpaII) endonuclease. Fluorescence intensities at 570 nm are plotted for all features, CCGG-containing features are colored in gray, and the remaining features are in black. (C) Scatter plot of CEBPA-GST binding to 180K array showing fluorescence intensities at 660 nm for all 65,536 8-mers in the context TNNNNNNNNA before and after methylation. The 8-mers are coded: CG (gray dots), non-CG (black dots), NTGAC|GNN (square), NTTGC|GNN (triangle). The gray line is fitted to the CG 8-mers, and the black line is fitted to the non-CG 8-mers. Binding to non-CG 8-mers did not change following methylation of the array.
CEBPA binding on the unmethylated 180K array identified ATTGC|GCA as the best-bound 8-mer, which extends to the 9-mer ATTGC|GCAA as the “A” from the flanking sequences on the array is included (Fig. 2C). This 9-mer is the same sequence identified by the 40K array. The range in CEBPA binding between features is 45-fold, demonstrating sequence-specific DNA binding (Supplemental Table 3A). CEBPB shows a 267-fold range of binding, while ATF4 is less specific with only a 22-fold range (Supplemental Table 3A). Following methylation, the canonical CEBP 8-mer is again best-bound by CEBPA and CEBPB (Figs. 2C, 3A). Binding of ATF4 to the canonical CRE motif is diminished after methylation by sixfold (P < 5.3 × 10−60) (Fig. 3B; Supplemental Tables 1D, 3B).
Figure 3.

The effect of methylation on DNA binding properties of CEBPB|ATF4 heterodimer. Fluorescence intensities at 660 nm from the 180K feature microarray are plotted for all of the 65,536 8-mers in the background TNNNNNNNNA. The 8-mers are color-coded as in Figure 1. Black lines are fitted to the non-CG 8-mers, and colored lines are fitted to the respective 64 8-mers containing the indicated 5-mers with NCGAT|GNN in blue. Effect of methylation on DNA binding of (A) CEBPB-GST and (B) ATF4-GST. (C,D) Comparison of DNA binding of CEBPB-GST|ATF4 heterodimer to the CEBPB-GST homodimer on (C) unmethylated and (D) methylated arrays. (E) Effect of methylation on DNA binding of CEBPB-GST|ATF4.
CEBPB|ATF4 binding on 180K arrays
The 180K arrays were also used to quantify methylation-dependent binding of the CEBPB-GST|ATF4 heterodimer (Fig. 3C–E). On unmethylated arrays, the best-bound sequence is CTGAT|GCA (Fig. 3C–E), the same sequence best-bound using the 40K array (Fig. 1H; Supplemental Fig. 5A). ATF4 addition decreased binding to the canonical CEBP motif TTGC|GCAA by sevenfold (Supplemental Table 3B), indicative of its dominant negative properties. On methylated arrays, the addition of ATF4 increased binding 10-fold to CGAT|GCAA (P < 4.0 × 10⁻²⁶–CEBPB-GST|ATF4; P < 4.7 × 10⁻¹¹–CEBPB|ATF4-GST) (Supplemental Table 1D), the same methylated sequence identified using the 40K array (Figs. 1H, 3D,E; Supplemental Fig. 5A; Supplemental Table 3B). We also used GST-tagged ATF4 with either CEBPB or GST-tagged CEBPB (Supplemental Fig. 8A,B) and obtained similar results again, suggesting that GST is not contributing to these results. The methylated 8-mer CGAT|GCAA can be extended to the 9-mer VCGAT|GCAA where V = A, C, or G (Supplemental Table 3C). CEBPB-GST|ATF4 binding on unmethylated vs. methylated arrays highlights the increase in binding to some sequences and the inhibition of binding to others, including the chimeric TGAC|GCAA (P < 1.78 × 10⁻²–CEBPB-GST|ATF4; P < 2.9 × 10⁻¹⁵–CEBPB|ATF4-GST) (Fig. 3E; Supplemental Fig. 8A; Supplemental Table 1D). Heterodimer binding to methylated CGAT|GCAA is more dramatically observed using ATF4-GST (Supplemental Figs. 5A,C, 8A,B).
EMSA shows CEBPB|ATF4 heterodimers bind methylated CGAT|GCAA
The electrophoretic mobility shift assay (EMSA) indicated that methylation of CGAT|GCAA increased CEBPB|ATF4 heterodimer binding by 10-fold, the same change observed using the 180K array (Fig. 4A; Supplemental Fig. 8C,D). The CEBPB|ATF4 heterodimer bound to DNA migrates slower than the CEBPB homodimer and faster than the ATF4 homodimer (Fig. 4A). EMSA experiments using hemi-methylated DNA probes (methyl cytosine on only one of the two strands) identified that the CEBPB|ATF4 heterodimer preferentially binds to methylated CGAT|GCAA and not the complementary TTGC|ATCG (Fig. 4A; Supplemental Fig. 8D).
Figure 4.

(A) EMSA showing CEBPB|ATF4 heterodimer preferentially binds to methylated CGAT|GCAA. Purified CEBPB, ATF4, and CEBPB|ATF4 B-ZIP domain dimers were mixed with unmethylated, hemi-methylated, or methylated CGAT|GCAA containing DNA probes. Protein dimer concentrations are indicated. Asterisks mark lanes with the same protein concentration. (B,C) EMSA showing CEBPB preferentially binds to ATTGC|GCAAT 10-mer. (B) Purified CEBPB was mixed with four palindromic methylated DNA probes containing the same consensus TTGC|GCAA 8-mer but different nucleotides at the 5′ and 3′ end of the 8-mer. EMSA showing CEBPB preferentially binds to methylated ATTGC|GCAAT. (C) Purified CEBPB B-ZIP domain dimers were mixed with methylated or unmethylated DNA probes with the same sequences as used in B. Both the acrylamide gel and the binding reactions contained 10 mM Mg2+. Protein dimer concentrations are indicated.
The effect of methylation on binding of the CEBPB|ATF4 heterodimer to a chimeric motif TTGC|GTCA containing both the CEBPB half-site TTGC|G and the ATF4 half-site C|GTCA was examined (Supplemental Fig. 9A). As seen in both the 40K (P < 3.62 × 10−97) (Supplemental Tables 1D, 2) and 180K (P < 4.69 × 10⁻¹¹) (Supplemental Tables 1D, 3B) arrays, methylation inhibits binding by two to threefold to the chimeric sequence (Supplemental Fig. 9A). Examination of hemi-methylated DNA reveals that methylation of one cytosine inhibits heterodimer binding, while methylation of the second cytosine enhances binding (Supplemental Fig. 9A).
EMSA using four palindromic CEBPB 10-mers
Both 40K and 180K arrays suggest that the CEBPB consensus binding site may be the ATTGC|GCAAT 10-mer (Supplemental Table 1) used in the crystal structure (Miller et al. 2003). CEBPB was mixed with four DNA probes containing different palindromic 10-mers NTTGC|GCAAN. ATTGC|GCAATT is best-bound by CEBPB at ∼5 nM, 10-fold better than the weakest 10-mer TTTGC|GCAAA, which bound at ∼50 nM (Fig. 4B; Supplemental Fig. 9B). Preferential binding to methylated sequences was observed when 10 mM Mg2+ was added in both the binding reactions and the polyacrylamide gel (Fig. 4C; Moll et al. 2002).
In vivo CEBPB binding
We examined CEBPB localization in the genome of primary female mouse dermal fibroblasts with a known methylome at 50× coverage for each strand (Supplemental Figs. 10A,B, 11A; Supplemental Table 4A) to identify whether methylated sequences are bound in vivo. CEBPB ChIP-seq data identified 7317 peaks that were most enriched for the canonical CEBP motif (Fig. 5A). To examine the unique part of genome, we focused on the masked genome (Jurka 2000). We compared in vitro CEBPB binding using methylated arrays with the enriched methylated 8-mers in the in vivo CEBPB ChIP-seq peaks (Fig. 5B). Methylated 8-mers well-bound in vivo contain the CEBP half-site C|GCAA, sequences well-bound on the arrays (Supplemental Fig. 11B). Many examples exist for TF binding functional noncanonical motifs in vivo. Our data indicate that, for CEBPB, only a small fraction of noncanonical sequences are bound in vivo. Eleven percent of the methylated TTGC|GCAA 8-mers in the genome are bound by CEBPB, fewer than expected (P < 10−47, hypergeometric) (Fig. 5B; Supplemental Fig. 11C,D; Supplemental Table 4B). A larger fraction of unmethylated canonical CEBP 8-mers (54%) are bound, compared to methylated 8-mers (11%), even though in vitro CEBPB preferentially binds the methylated sequence, perhaps revealing that the unmethylated 8-mers are more accessible in vivo as is observed for unmethylated sequences which tend to be in DNase I-hypersensitive sites in vivo (Fig. 5B; Supplemental Fig. 11C,D; Supplemental Table 4B; Stadler et al. 2011). However, not all sequences well-bound on the array are bound in vivo. CEBPB ChIP-seq binding sites containing unmethylated and methylated 8-mers (TTGC|GCAA) are associated with distinct classes of GO terms; unmethylated 8-mers are associated with transcription regulation and signaling pathways, and the methylated 8-mers are associated with cell motility and lymphoid organ development (Fig. 5C). On the arrays, methylation inhibits CREB1 binding, and CREB1 ChIP-seq peaks enrich only for the unmethylated canonical CRE site TGAC|GTCA. Not a single methylated canonical CRE site is bound by CREB1 (P < 10−67, hypergeometric), demonstrating the profound consequence of methylation on TF localization (Supplemental Fig. 11E,F; Supplemental Table 4C).
Figure 5.

(A) Motif identified by MEME motif-finding algorithm from CEBPB ChIP-seq peaks before ATF4 induction. (B) Percent of methylated 8-mers with one CG dinucleotide in CEBPB ChIP-seq peaks in dermal fibroblasts plotted against Z-scores obtained from protein binding microarrays of CEBPB-GST binding to methylated 8-mers. The 8-mers are color coded: CG (gray dots), TGAC|G (square), TTGC|G (black dots). (C) Enriched GO terms for genes bound by CEBPB in dermal fibroblasts with methylated and unmethylated CEBP canonical motif (TTGC|GCAA) within −10 kbp to 1 kbp of the TSS. (D) CEBPB binding to unmethylated and methylated CEBP 10-mer palindromes in primary female mouse dermal fibroblasts. (E) Western blot showing induction of ATF4 in mouse dermal fibroblasts after 3 h of treatment with 2 μM thapsigargin (Tg). (F) UCSC Browser shot of CEBPB and ATF4 ChIP-seq read coverage before and after ATF4 induction along with the percent methylation at each CG dinucleotide in primary mouse dermal fibroblasts. CEBPB and ATF4 are preferentially localized in the methylated regions only after ATF4 induction. (G) Motif identified by MEME from new CEBPB ChIP-seq peaks after treatment with Tg.
On the 180K arrays, CEBPB prefers to bind the methylated CEBP 9-mer TTGC|GCAAT. This is also observed in vivo (Supplemental Table 5A). CEBPB preferentially binds 39% of the methylated ATTGC|GCAAT 10-mers in the genome, compared to only 2% of methylated TTTGC|GCAAT 10-mers (P < 1 × 10⁻¹³, hypergeometric), suggesting the differences in binding observed using EMSA are in the range that are biologically significant (Fig. 5D; Supplemental Table 5B).
In vivo CEBPB and ATF4 binding after thapsigargin treatment
The CEBPB|ATF4 heterodimer binds methylated CGAT|GCAA at ∼15 nM (Fig. 4A). We evaluated if this methylated sequence is also bound in vivo. ATF4 is involved in several stress pathways and typically exists in cells as an untranslated mRNA that is translated into protein following cellular stress (Yukawa et al. 1999). To induce ATF4 protein expression, we treated primary female mouse dermal fibroblasts with thapsigargin (2 μM) for 3 h (Fig. 5E) and determined the genome-wide localization of CEBPB and ATF4 by ChIP-seq. We observed 7861 CEBPB peaks; 80% are not observed before ATF4 induction (Fig. 5F). The most enriched motif using RSAT peak-motifs (Thomas-Chollier et al. 2011) in CEBPB ChIP-seq peaks after ATF4 induction is TGAT|GCAA (Fig. 5G), the identical 8-mer best-bound by the CEBPB|ATF4 heterodimer on both 40K and 180K arrays (Figs. 1H, 3C–E, 6A,B; Supplemental Fig. 12A–D; Supplemental Table 6A; Adams 2007).
Figure 6.

(A) Number of reads normalized to the total number of reads in the CEBPB ChIP-seq peaks before and after ATF4 induction by Tg in mouse primary dermal fibroblasts. (Green) Peaks containing methylated canonical CEBP 8-mer; (blue) CGAT|GCA-containing peaks; (yellow) TGAT|GCAA-containing peaks. (B) Number of reads normalized to the total number of reads in the CEBPB ChIP-seq peaks vs. ATF4 ChIP-seq peaks after ATF4 induction by Tg in mouse primary dermal fibroblasts. Peaks containing methylated canonical CEBP 8-mer are colored as in Figure 6A. (C) Enrichment of selected k-mers in CEBPB ChIP-seq peaks before and after thapsigargin treatment and ATF4 ChIP-seq peaks after thapsigargin treatment. (D) Motif identified using RSAT from ATF4 ChIP-seq peaks after treatment with Tg. (E) Transcript abundances as determined using RNA-seq were plotted for dermal fibroblasts before and after ATF4 induction. Transcript abundances were reported in fragments per kilobase of transcript per million fragments mapped (FPKM). The peaks are color-coded: all peaks (gray); TGAT|GCAA (yellow)–commonly bound CEBPB and ATF4 ChIP-seq peaks (in promoters); CGAT|G (blue)–(nearest gene to the ATF4 ChIP-seq peaks). Approximately 50% of the promoters had no signal and are not shown.
CEBPB peak size before and after ATF4 induction and the presence of four motifs (unmethylated and methylated canonical CEBP motif, best-bound 8-mer, TGAT|GCAA, and the methylated CGAT|GCA) was examined (Fig. 6A). The biggest CEBPB peaks before and after ATF4 induction do not contain the canonical CEBP motif. Intermediately bound peaks before ATF4 induction contain both the unmethylated and methylated canonical CEBP motif. Following ATF4 induction, there is a depletion of CEBPB binding to both the unmethylated and methylated canonical CEBP motif, revealing dominant negative properties for ATF4 (Fig. 6C; Supplemental Fig. 13A–F; Supplemental Table 6B). After ATF4 induction, CEBPB binding shifts to the methylated CGAT|GCA sequence identified on the arrays (Fig. 6A–C; Supplemental Fig. 13A–F). The enrichment of mCGATG occurrences in CEBPB ChIP-seq before and after ATF4 induction increased substantially from 0.62 to 1.56 (P < 2.46 × 10⁻²⁸, two-proportion z-test) (Fig. 6C; Supplemental Table 6B). The genes associated with the methylated CGAT|G bound by CEBPB after ATF4 induction are enriched for the protein amino acid phosphorylation (Supplemental Table 6C), which is required for activating the signaling pathway that inhibits protein biosynthesis after the unfolded protein response induced by ER stress (Harding et al. 2003).
ATF4 ChIP-seq (Miyamoto et al. 2011) identified 10,067 ChIP-seq peaks. The most enriched motif using RSAT peak-motifs is a chimeric sequence containing an ETS and a CRE motif (Fig. 6D; Chatterjee et al. 2012). There is less enrichment for specific 8-mers than observed for CEBPB, which is reminiscent of the microarray data where ATF4 showed less specificity (Supplemental Figs. 12C,D, 13C–F). A plot of CEBPB peak reads vs. ATF4 peak reads after treatment with thapsigargin highlights the presence of the four sequences previously mentioned in the peaks; the best-bound 8-mer is abundant (Fig. 6B) and enriched (Fig. 6C). The methylated CGAT|G is overrepresented in ATF4 ChIP peaks after thapsigargin treatment (Fig. 6C).
mRNA-seq of primary female mouse dermal fibroblasts before and after ATF4 induction using Illumina next-generation RNA sequencing identified differentially expressed genes (Fig. 6E). Genes that are commonly bound by CEBPB and ATF4 to TGAT|GCAA (the best-bound 8-mer on the array) at the promoters were highly expressed and up-regulated, or remained unchanged in the thapsigargin-treated primary female mouse dermal fibroblasts. The nearest gene to ATF4 peaks with mCGAT|G motifs shows both up- and down-regulation after thapsigargin treatment, suggesting variable effects on gene expression, including ER stress-induced genes that are up-regulated (Fig. 6E).
Discussion
We adapted protein binding DNA microarray technology (Berger and Bulyk 2006; Berger et al. 2006, 2008) to evaluate how CG methylation affects binding of eight B-ZIP homodimers and the CEBPB|ATF4 heterodimer. For CEBPA and CEBPB, CG methylation has a promiscuous effect, increasing binding to CG-containing sequences. For the CEBPB|ATF4 heterodimer, methylation specifically increased binding to CGAT|GCAA by 10-fold. CEBPB ChIP-seq using primary female mouse dermal fibroblasts with a methylome sequenced at 50× coverage identified methylated sequences bound in vivo. The methylated 8-mers bound well by CEBPB homodimers and CEBPB|ATF4 heterodimers on the arrays and EMSA are also well bound in vivo. In vivo CEBPB binds 39% of the methylated canonical CEBP 10-mer (ATTGC|GCAAT: ∼5 nM in EMSA) and only 2% of the related methylated 10-mer (TTTGC|GCAAA: ∼50 nM in EMSA), helping to identify the strength of protein-DNA interactions that are biologically meaningful.
On the arrays, methylation enhances CEBPB binding to CG-containing 8-mers, but in vivo, only those methylated sequences which are well-bound on arrays are bound, suggesting a threshold binding is needed for biological function. We suggest that preferential in vivo binding of CEBPB to the unmethylated CEBP sequences, even though they are bound more poorly on the array, is because the unmethylated occurrences are in more accessible regions of the genome (Biddie et al. 2011; John et al. 2011; Stadler et al. 2011). CEBPB binds the methylated PAR motif (TTAC|GTAA) (Moll et al. 2002) well on the arrays but not in vivo. This could indicate that the PAR motif is bound by other TFs in vivo and thus is not accessible to CEBPB binding. Alternatively, the binding conditions on the arrays cannot completely replicate the in vivo conditions and, thus, may produce some false positive data. Previously, we showed that CEBP family members could activate a methylated CRE reporter in transient transfection experiments (Rishi et al. 2010) but do not observe CEBPB binding the methylated CRE motif in primary female mouse dermal fibroblasts.
In summary, we have methylated CG dinucleotides on DNA microarrays to evaluate how CG methylation affects DNA binding of sequence-specific DNA binding proteins. Newly identified methylated sequences bound on the array are also bound in vivo. This technology can identify how CG methylation of many DNA sequences affects TF binding.
Methods
Cloning and expression of mouse B-ZIP proteins
The DNA binding domain (DBD) of B-ZIPs as defined in the Pfam (Finn et al. 2008) and SMART (Letunic et al. 2004) database (Supplemental Table 7) were cloned into the pETGEXCT (C-terminal GST) vector (Sharrocks 1994) either by RT-PCR from pooled mouse mRNA (1 ng), followed by ligation-independent cloning, or by gene synthesis followed by conventional cloning using NotI and SacI restriction sites of the pETGEXCT vector (Sharrocks 1994). After cloning, the inserts were sequence-verified (Supplemental Table 7). The proteins were expressed using in vitro translation (IVT) reactions. IVT reactions were performed using PURExpress In Vitro Protein Synthesis Kit (NEB) as suggested by the manufacturer's protocol. For each IVT reaction, ∼180 ng (40K) and 250 ng (180K) of plasmid DNA was used.
Design of the 180,000 (180K) feature PBMs
To evaluate binding affinities to each 8-mer, all possible 8-mers (65,536) were spotted 2–3 times in the probe sequence on a microarray glass slide. All the probes were 60 bp long, and the priming sequence was 24 bp long. Each oligonucleotide sequence on the microarray slide included 14 bp of fixed nucleotides on both sides of variable 8-mers. We appended 24 nt (GGACACACTTTAACACATGGAGAG) to each of the 3′ends of probe sequence which is complementary to the primer sequence. These microarrays were designed by Agilent Technologies in their “4X180K” format with probes attached to the glass slide at the 3′ end.
Design of the 40,000 (40K) feature PBMs
The 40K array design also consists of probe sequences which are 35 bp long, and 25 nt are appended at the 3′ end of probe sequences which are complementary to primer sequence for double-stranding. The design of this array is based on de Bruijn sequence, and each 8-mer occurs 32 times, and the palindromes occur 16 times. The sequence detail of the 40K array has been described in Lam et al. (2011). Details of the design have been described elsewhere (Berger et al. 2006, 2008; Philippakis et al. 2008).
Microarray double-stranding
The single-stranded oligonucleotide microarrays were double-stranded by primer extension as described in Badis et al. (2009). Briefly, the primer extension reactions consisted of 1.17 μM HPLC-purified common primer (Integrated DNA Technologies), 40 μM dATP, dCTP, dGTP, and dTTP (GE Healthcare), 1.6 μM Cy3 dCTP (GE Healthcare), 40 Units Thermo Sequenase DNA Polymerase (USB), and 90 μl 10× reaction buffer (260 mM Tris-HCl, pH 9.5, 65 mM MgCl2) in a total volume of 900 μl. The reaction mixture, microarray, stainless steel hybridization chamber, and single chamber gasket cover slip (Agilent Technologies, Inc.) were prewarmed to 85°C. After a 2-h incubation (85°C for 10 min, 75°C for 10 min, 65°C for 10 min, and 60°C for 90 min), the hybridization chamber was disassembled in a glass staining dish in 500 mL PBS/0.01% Triton X-100 at 37°C. The microarray was transferred to a fresh staining dish, washed for 5 min in PBS/0.01% Triton X-100 at 37°C, washed once more for 1 min in SSC 0.06× at 20°C. The double-stranded slides were scanned to quantify the amount of incorporated Cy3-conjugated dCTP (Agilent Technologies).
Methylation of double-stranded microarray
The methylation of the double-stranded microarray was performed using 10 μl of CG methyltransferase enzyme M.SssI (20 units/μl) (NEB), 1μl of S-adenosylmethionine, and 15 μl of 10× NEB buffer 2 in a total volume of 150 μl at 37°C for 3 h. The arrays were washed 3 × 5 min using PBS with 0.5% Tween-20 on a rotator and once with PBS for 2 min, and finally rinsed in PBS in a 500-mL staining dish. The methylated microarrays were stripped in a 50-mL stripping solution consisting of 10 mM EDTA, 10% SDS, and 290 Units of protease (Sigma), shaking at 200 rpm in a Coplin jar at 37°C for 16 h. Microarrays were finally washed as described previously.
Protein binding reaction
The protein binding reactions were carried out as described by Badis et al. (2009). Briefly, the double-stranded microarrays were blocked with 4% nonfat dried milk (Sigma) for 1 h. Microarrays were then washed once with PBS with 0.1% (vol/vol) Tween-20 for 5 min and once with PBS with 0.01% Triton X-100 for 2 min. Sixteen microliters of IVT reactions were added to make a total volume of 150 μl protein binding reaction for 40K array and 25 μl for 180K array, containing PBS with 2% (wt/vol) milk, 51.3 ng/μl salmon testes DNA (Sigma), and 0.2 μg/μl bovine serum albumin (NEB), and incubated for 1 h at 20°C. Preincubated protein binding mixtures were applied to individual chambers of 40K and 180K arrays and incubated for 1 h at 20°C. Microarrays were washed with squeeze bottle (40K) and in a Coplin jar (180K) once with 0.5% (vol/vol) Tween-20 in PBS for 3 min, once with 0.01% Triton X-100 in PBS for 2 min, and then finally washed with PBS. Alexa Fluor 647-conjugated GST antibody (Invitrogen) was applied to each chamber and incubated for 1 h at 20°C. Finally, microarrays were washed twice with PBS with 0.05% (vol/vol) Tween-20 for 3 min each, and once in PBS for 2 min. Every protein in this study was assayed in duplicate, once on each of our two separate microarray designs described above.
Image quantification and analysis of microarray data
Protein-bound microarrays were scanned to detect Alexa Fluor 647-conjugated anti-GST using at least two different laser power settings to best capture a broad range of signal intensities and ensure signal intensities below saturation for all spots. Microarray images were analyzed using ImaGene (BioDiscovery Inc.), bad spots were manually flagged, and the extracted data were used for further analysis. To estimate the relative binding affinities of proteins using an ∼170,000 feature array, we averaged the signal median intensities for the spots containing each 8-mer. However, on a 40,000 feature array, to estimate the relative preference for each 8-mer, two different scores were calculated: The Z-score was calculated from the average signal intensity across the 16 or 32 spots containing each 8-mer; the ‘E-score’ (for enrichment) is a rank-based, nonparametric statistical measure that is invariant to protein concentration (Berger et al. 2006).
Estimation of the significance of 8-mer binding to methylated vs. unmethylated arrays
We estimated the significance of the change in the strength of binding of a given transcription factor to each 8-mer on the methylated and unmethylated arrays. For each 8-mer, we compared its Z-scores (for the standard 40K PBMs) or median 8-mer intensities (for the 180K PBMs). Since the range of scores can differ between experiments, we first transformed the methylated 8-mer values by performing a standard linear regression onto the values of the unmethylated array for each transcription factor. We then calculated a single statistic for each 8-mer representing the change in binding strength between the two arrays:
where  is the transformed methylated score, and
  is the score on the unmethylated array. To estimate the significance of
  , we compared its value to that obtained on replicates of the unmethylated arrays:
where  is the score on the replicate unmethylated array. As a conservative estimate of the distribution of
  for the preferentially bound 8-mers of each transcription factor, we calculated the mean and standard deviation of
  across the 100 highest-scoring 8-mers for the given experiment. Similar results were obtained when using the top 50 or top 200 8-mers (data not shown). The final significance of the difference in binding between the methylated and unmethylated arrays to each 8-mer for each transcription factor was then calculated as:
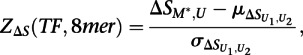 |
where  is the mean of
  across the 100 highest-scoring 8-mers for the given experiment, and
  is the standard deviation. The resulting Z-scores were transformed into P-values using the standard normal distribution.
Electrophoretic mobility shift assay
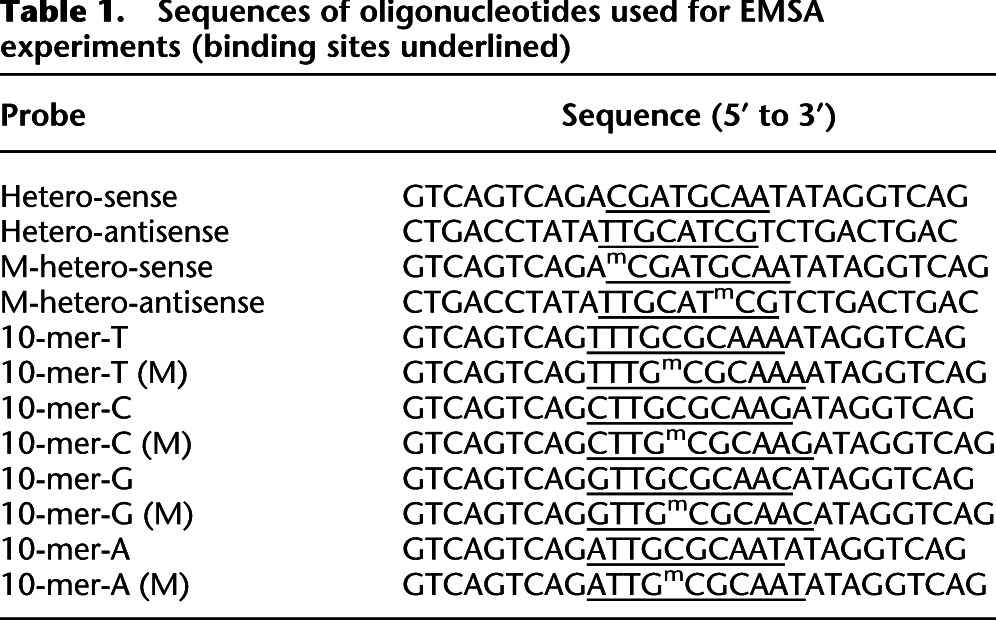
EMSA was performed as described previously (Rishi et al. 2010). The proteins were either in vitro translated using PURExpress In Vitro Protein Synthesis Kit (NEB) according to the manufacturer's instructions or were purified as previously described (Ahn et al. 1998). Proteins were mixed with 7 pM 32P-end-labeled double-stranded oligonucleotides in the gel shift buffer (0.5 mg/mL BSA, 10% glycerol, 2.5 mM DTT, 12.5 mM K2HPO4-KH2PO4, pH 7.4, 0.25 mM EDTA). The final volume of the reaction was adjusted to 20 μl. The reactions were incubated at 37°C for 20 min, followed by cooling at room temperature for 5 min before loading. Ten-microliter samples were resolved on 7.5% or 12% PAGE at 150 V for 1.5 h in the 1× TBE buffer (25 mM Tris-boric acid, 0.5 mM EDTA). Sequences of oligonucleotides used for EMSA experiments are listed in Table 1 (binding sites underlined).
Table 1.
Sequences of oligonucleotides used for EMSA experiments (binding sites underlined)
Mouse primary dermal fibroblasts culture
Dermal fibroblasts were cultured from newborn wild type according to the protocol given elsewhere (Rishi et al. 2010). Primary dermal fibroblasts were seeded at a density of one mouse dermis per 10-cm-dish or equivalent in DMEM/F12: GlutaMAX medium (Invitrogen) with 10% FBS. For ATF4 induction, the primary cells were treated with 2 μM of thapsigargin (Sigma) for 3 h.
Western blotting
Protein extracts were prepared in RIPA buffer containing 50 mM Tris, 150 mM NaCl, 1% NP-40, 0.5% sodium deoxycholate, 0.1% SDS, 1 mM EGTA, 5 mM EDTA, 10 mM NaF, 1 mM β-glycerophosphate, 1 mM sodium vandate, and protease inhibitor (Roche). Equal amounts of proteins were resolved on NuPAGE 4%–12% Bis-Tris gradient gels (Invitrogen) and transferred onto PVDF membranes (Hybond-P, Amersham Biosciences). Membranes were blocked in 5% skimmed milk for 1 h at room temperature and then incubated with primary antibody at 4°C overnight with shaking. After washing using PBST 3 × 5 min, the blots were incubated for 1 h with secondary antibodies against rabbit or mouse IgG (Amersham Biosciences, 1:5000) and washed 3 × 5 min. Blots were developed using ECL plus Western Blotting detection system (Amersham Biosciences). The following primary antibodies were used: anti-CEBPB (sc-150; Santa Cruz Biotechnology), anti-ATF4 (sc-200; Santa Cruz Biotechnology), and monoclonal anti-β-actin (sc-47778; Santa Cruz Biotechnology).
Chromatin immunoprecipitation (ChIP) sequencing
Primary cultured cells either untreated or treated with thapsigargin were chemically cross-linked for 10 min by adding 0.6% formaldehyde (Sigma) directly to the medium. The cross-linking reaction was stopped by adding 125 mM glycine, and dishes were swirled for 5 min at room temperature. Cells were washed twice with ice-cold PBS and harvested in ice-cold PBS containing protease inhibitor (Roche). A total of 107 cells were pelleted by centrifugation at 4°C for 5 min at 300g. Four times 300 μl of sonicated chromatin preparation was incubated overnight with CEBPB (sc-150; Santa Cruz) or ATF4 (sc-200; Santa Cruz) or CREB antibody (sc-186; Santa Cruz). Immunocomplexes were captured using protein G agarose beads (Invitrogen) and washed twice with the buffer containing 2 mM EDTA, 100 mM Tris-Cl, pH 8.0, and 0.18% Sarkosyl, and four times with the IP buffer (100 mM Tris-Cl, pH 8.5, 500 mM LiCl, 1% NP40, 1% deoxycholic acid). After incubating with RNaseA and Proteinase K, DNA was eluted using QIAquick PCR Purification Kit. Purified DNA were used to prepare the library for Illumina high-throughput sequencing using Illumina Single End ChIP-seq Sample Preparation Kit as described in the manufacturer's protocol. Libraries were sequenced to generate 35-bp single-end reads using Illumnia GAII sequencing machines. We used the Model-Based Analysis of ChIP-seq (MACS) algorithm with default parameters for detecting the ChIP-seq peaks of CEBPB before and after ATF4 induction and ATF4 after ATF4 induction by thapsigargin (Zhang et al. 2008)
RNA-sequencing of dermal fibroblasts before and after ATF4 induction
Total RNA was isolated from the mouse primary dermal fibroblasts before and after ATF4 induction using 3 h of treatment with 2 μM of thapsigargin. Purified RNA was used for generating the mRNA-seq library using the Illumina mRNA-seq kit as described in the manufacturer's protocol. Data analysis was performed using Cufflinks software with the default parameters as suggested in the Cufflinks manual (Trapnell et al. 2010). Transcript abundances were reported in fragments per kilobase of transcript per million fragments mapped (FPKM) with arbitrary units.
Determination of whole genome DNA methylation
Genomic DNA was isolated from cultured primary dermal fibroblasts and used for bisulfite sequencing using the protocol described previously (Lister et al. 2009). Approximately 10 μg of genomic DNA was sonicated to ∼300 bp using the Covaris S2 System. Sonicated DNA was purified using Qiagen DNeasy minielute columns (Qiagen). Each sequencing library was constructed using the Illumina paired end DNA sample preparation kit (Illumina Inc.) according to the manufacturer's instructions, with the following modifications: Illumina methylated adapters were used in place of the standard genomic DNA adapters. Ligation products were purified with AMPure XP beads (Beckman). Four times 500 ng of DNA were bisulfite-treated using the EpiTect Bisulfite Kit (Qiagen) following the manufacturer's guidelines, followed by PCR amplification using the Phusion Taq using the following PCR conditions: 2 min at 95°C, 4 cycles of 15 sec at 98°C, 30 sec at 60°C, 4 min at 72°C, and 10 min at 72°C. Libraries were sequenced using the Illumina HiSeq 2000 (Illumina) up to 101 cycles. For mapping, cross validation and data analysis, NIH Helix and biowulf clusters were used with our standardized custom algorithms for the whole genome bisulfite sequencing pipeline. Briefly, we aligned bisulfite-treated sequences against a reference genome (mouse, mm9) in a single pass that aligns against both C-T and G-A in silico indexed reference sequences using Novoalign (Novocraft Technologies). The base calls per reference position on each strand were used to identify methylated cytosines in the context of CpG, CHG, and CHH.
Data access
Protein binding microarray and sequencing data used in this study have been deposited with the NCBI Gene Expression Omnibus (GEO) (http://www.ncbi.nlm.nih.gov/geo) under accession numbers GSE44338 and GSE44942, respectively.
Acknowledgments
We thank Dr. David Fitzgerald for advice on ATF4 induction. We also thank Dr. Bao Tran, Ms. Jyoti Shetty, Yongmei Zhao, Shashikala Ratnayake, and Yuliya Kriga at the NCI CCR Sequencing Facility, Frederick, Maryland for providing expert technical assistance with the Illumina next-generation sequencing. This study was supported by the Intramural Research Program of the NIH, Center for Cancer Research, National Cancer Institute.
Author contributions: I.K.M. designed 180K arrays and standardized CG methylation. I.K.M. and J.Z. did the protein-binding microarray experiments, and data analysis was performed by I.K.M., J.Z., X.H., and M.T.W. J.Z. performed EMSA. R.C. did the whole genome bisulfite-sequencing, ChIP-sequencing, RNA-sequencing, and immunoblot experiments. R.C. did the data analysis for bisulfite-sequencing, ChIP-sequencing, and RNA-sequencing. R.C. and X.H. did downstream analysis of bisulfite-sequencing and ChIP-sequencing. I.K.M., R.C., J.Z., X.H., T.R.H., and C.V. wrote the manuscript.
Footnotes
[Supplemental material is available for this article.]
Article published online before print. Article, supplemental material, and publication date are at http://www.genome.org/cgi/doi/10.1101/gr.146654.112.
References
- Adams CM 2007. Role of the transcription factor ATF4 in the anabolic actions of insulin and the anti-anabolic actions of glucocorticoids. J Biol Chem 282: 16744–16753 [DOI] [PubMed] [Google Scholar]
- Ahn K, Herman SB, Fahnoe DC 1998. Soluble human endothelin-converting enzyme-1: Expression, purification, and demonstration of pronounced pH sensitivity. Arch Biochem Biophys 359: 258–268 [DOI] [PubMed] [Google Scholar]
- Ameri K, Harris AL 2008. Activating transcription factor 4. Int J Biochem Cell Biol 40: 14–21 [DOI] [PubMed] [Google Scholar]
- Badis G, Berger MF, Philippakis AA, Talukder S, Gehrke AR, Jaeger SA, Chan ET, Metzler G, Vedenko A, Chen X, et al. 2009. Diversity and complexity in DNA recognition by transcription factors. Science 324: 1720–1723 [DOI] [PMC free article] [PubMed] [Google Scholar]
- Benbrook DM, Jones NC 1994. Different binding specificities and transactivation of variant CRE's by CREB complexes. Nucleic Acids Res 22: 1463–1469 [DOI] [PMC free article] [PubMed] [Google Scholar]
- Berger MF, Bulyk ML 2006. Protein binding microarrays (PBMs) for rapid, high-throughput characterization of the sequence specificities of DNA binding proteins. Methods Mol Biol 338: 245–260 [DOI] [PMC free article] [PubMed] [Google Scholar]
- Berger MF, Philippakis AA, Qureshi AM, He FS, Estep PW III, Bulyk ML 2006. Compact, universal DNA microarrays to comprehensively determine transcription-factor binding site specificities. Nat Biotechnol 24: 1429–1435 [DOI] [PMC free article] [PubMed] [Google Scholar]
- Berger MF, Badis G, Gehrke AR, Talukder S, Philippakis AA, Pena-Castillo L, Alleyne TM, Mnaimneh S, Botvinnik OB, Chan ET, et al. 2008. Variation in homeodomain DNA binding revealed by high-resolution analysis of sequence preferences. Cell 133: 1266–1276 [DOI] [PMC free article] [PubMed] [Google Scholar]
- Biddie SC, John S, Sabo PJ, Thurman RE, Johnson TA, Schiltz RL, Miranda TB, Sung MH, Trump S, Lightman SL, et al. 2011. Transcription factor AP1 potentiates chromatin accessibility and glucocorticoid receptor binding. Mol Cell 43: 145–155 [DOI] [PMC free article] [PubMed] [Google Scholar]
- Bird AP 1986. CpG-rich islands and the function of DNA methylation. Nature 321: 209–213 [DOI] [PubMed] [Google Scholar]
- Bulyk ML, Gentalen E, Lockhart DJ, Church GM 1999. Quantifying DNA-protein interactions by double-stranded DNA arrays. Nat Biotechnol 17: 573–577 [DOI] [PubMed] [Google Scholar]
- Chatterjee R, Vinson C 2012. CpG methylation recruits sequence specific transcription factors essential for tissue specific gene expression. Biochim Biophys Acta 1819: 763–770 [DOI] [PMC free article] [PubMed] [Google Scholar]
- Chatterjee R, Zhao J, He X, Shlyakhtenko A, Mann I, Waterfall JJ, Meltzer P, Sathyanarayana BK, FitzGerald PC, Vinson C 2012. Overlapping ETS and CRE motifs ((G/C)CGGAAGTGACGTCA) preferentially bound by GABPα and CREB proteins. G3 (Bethesda) 2: 1243–1256 [DOI] [PMC free article] [PubMed] [Google Scholar]
- Eckhardt F, Lewin J, Cortese R, Rakyan VK, Attwood J, Burger M, Burton J, Cox TV, Davies R, Down TA, et al. 2006. DNA methylation profiling of human chromosomes 6, 20 and 22. Nat Genet 38: 1378–1385 [DOI] [PMC free article] [PubMed] [Google Scholar]
- Finn RD, Tate J, Mistry J, Coggill PC, Sammut SJ, Hotz H-R, Ceric G, Forslund K, Eddy SR, Sonnhammer ELL, et al. 2008. The Pfam protein families database. Nucleic Acids Res (suppl 1) 36: D281–D288 [DOI] [PMC free article] [PubMed] [Google Scholar]
- Grainger RM, Hazard-Leonards RM, Samaha F, Hougan LM, Lesk MR, Thomsen GH 1983. Is hypomethylation linked to activation of δ-crystallin genes during lens development? Nature 306: 88–91 [DOI] [PubMed] [Google Scholar]
- Hansen KD, Timp W, Bravo HC, Sabunciyan S, Langmead B, McDonald OG, Wen B, Wu H, Liu Y, Diep D, et al. 2011. Increased methylation variation in epigenetic domains across cancer types. Nat Genet 43: 768–775 [DOI] [PMC free article] [PubMed] [Google Scholar]
- Harding HP, Zhang Y, Zeng H, Novoa I, Lu PD, Calfon M, Sadri N, Yun C, Popko B, Paules R, et al. 2003. An integrated stress response regulates amino acid metabolism and resistance to oxidative stress. Mol Cell 11: 619–633 [DOI] [PubMed] [Google Scholar]
- Iguchi-Ariga SM, Schaffner W 1989. CpG methylation of the cAMP-responsive enhancer/promoter sequence TGACGTCA abolishes specific factor binding as well as transcriptional activation. Genes Dev 3: 612–619 [DOI] [PubMed] [Google Scholar]
- John S, Sabo PJ, Thurman RE, Sung MH, Biddie SC, Johnson TA, Hager GL, Stamatoyannopoulos JA 2011. Chromatin accessibility pre-determines glucocorticoid receptor binding patterns. Nat Genet 43: 264–268 [DOI] [PMC free article] [PubMed] [Google Scholar]
- Johnson PF 1993. Identification of C/EBP basic region residues involved in DNA sequence recognition and half-site spacing preference. Mol Cell Biol 13: 6919–6930 [DOI] [PMC free article] [PubMed] [Google Scholar]
- Jones PA, Baylin SB 2007. The epigenomics of cancer. Cell 128: 683–692 [DOI] [PMC free article] [PubMed] [Google Scholar]
- Jurka J 2000. Repbase update: A database and an electronic journal of repetitive elements. Trends Genet 16: 418–420 [DOI] [PubMed] [Google Scholar]
- Lam KN, van Bakel H, Cote AG, van der Ven A, Hughes TR 2011. Sequence specificity is obtained from the majority of modular C2H2 zinc-finger arrays. Nucleic Acids Res 39: 4680–4690 [DOI] [PMC free article] [PubMed] [Google Scholar]
- Letunic I, Copley RR, Schmidt S, Ciccarelli FD, Doerks T, Schultz J, Ponting CP, Bork P 2004. SMART 4.0: Towards genomic data integration. Nucleic Acids Res (suppl 1) 32: D142–D144 [DOI] [PMC free article] [PubMed] [Google Scholar]
- Lister R, Pelizzola M, Dowen RH, Hawkins RD, Hon G, Tonti-Filippini J, Nery JR, Lee L, Ye Z, Ngo QM, et al. 2009. Human DNA methylomes at base resolution show widespread epigenomic differences. Nature 462: 315–322 [DOI] [PMC free article] [PubMed] [Google Scholar]
- Lu PD, Harding HP, Ron D 2004. Translation reinitiation at alternative open reading frames regulates gene expression in an integrated stress response. J Cell Biol 167: 27–33 [DOI] [PMC free article] [PubMed] [Google Scholar]
- Meehan RR, Lewis JD, McKay S, Kleiner EL, Bird AP 1989. Identification of a mammalian protein that binds specifically to DNA containing methylated CpGs. Cell 58: 499–507 [DOI] [PubMed] [Google Scholar]
- Miller M, Shuman JD, Sebastian T, Dauter Z, Johnson PF 2003. Structural basis for DNA recognition by the basic region leucine zipper transcription factor CCAAT/enhancer-binding protein α. J Biol Chem 278: 15178–15184 [DOI] [PubMed] [Google Scholar]
- Miyamoto N, Izumi H, Miyamoto R, Bin H, Kondo H, Tawara A, Sasaguri Y, Kohno K 2011. Transcriptional regulation of activating transcription factor 4 under oxidative stress in retinal pigment epithelial ARPE-19/HPV-16 cells. Invest Ophthalmol Vis Sci 52: 1226–1234 [DOI] [PubMed] [Google Scholar]
- Moll JR, Acharya A, Gal J, Mir AA, Vinson C 2002. Magnesium is required for specific DNA binding of the CREB B-ZIP domain. Nucleic Acids Res 30: 1240–1246 [DOI] [PMC free article] [PubMed] [Google Scholar]
- Newman JR, Keating AE 2003. Comprehensive identification of human bZIP interactions with coiled-coil arrays. Science 300: 2097–2101 [DOI] [PubMed] [Google Scholar]
- Philippakis AA, Qureshi AM, Berger MF, Bulyk ML 2008. Design of compact, universal DNA microarrays for protein binding microarray experiments. J Comput Biol 15: 655–665 [DOI] [PMC free article] [PubMed] [Google Scholar]
- Rishi V, Bhattacharya P, Chatterjee R, Rozenberg J, Zhao J, Glass K, Fitzgerald P, Vinson C 2010. CpG methylation of half-CRE sequences creates C/EBPα binding sites that activate some tissue-specific genes. Proc Natl Acad Sci 107: 20311–20316 [DOI] [PMC free article] [PubMed] [Google Scholar]
- Sharrocks AD 1994. A T7 expression vector for producing N- and C-terminal fusion proteins with glutathione S-transferase. Gene 138: 105–108 [DOI] [PubMed] [Google Scholar]
- Stadler MB, Murr R, Burger L, Ivanek R, Lienert F, Scholer A, van Nimwegen E, Wirbelauer C, Oakeley EJ, Gaidatzis D, et al. 2011. DNA-binding factors shape the mouse methylome at distal regulatory regions. Nature 480: 490–495 [DOI] [PubMed] [Google Scholar]
- Thomas-Chollier M, Defrance M, Medina-Rivera A, Sand O, Herrmann C, Thieffry D, van Helden J 2011. RSAT 2011: Regulatory sequence analysis tools. Nucleic Acids Res 39: W86–W91. [DOI] [PMC free article] [PubMed] [Google Scholar]
- Trapnell C, Williams BA, Pertea G, Mortazavi A, Kwan G, van Baren MJ, Salzberg SL, Wold BJ, Pachter L 2010. Transcript assembly and quantification by RNA-Seq reveals unannotated transcripts and isoform switching during cell differentiation. Nat Biotechnol 28: 511–515 [DOI] [PMC free article] [PubMed] [Google Scholar]
- Vattem KM, Wek RC 2004. Reinitiation involving upstream ORFs regulates ATF4 mRNA translation in mammalian cells. Proc Natl Acad Sci 101: 11269–11274 [DOI] [PMC free article] [PubMed] [Google Scholar]
- Vinson C, Chatterjee R 2012. CG methylation. Epigenomics 4: 655–663 [DOI] [PMC free article] [PubMed] [Google Scholar]
- Vinson CR, Sigler PB, McKnight SL 1989. Scissors-grip model for DNA recognition by a family of leucine zipper proteins. Science 246: 911–916 [DOI] [PubMed] [Google Scholar]
- Vinson CR, Hai T, Boyd SM 1993. Dimerization specificity of the leucine zipper-containing bZIP motif on DNA binding: Prediction and rational design. Genes Dev 7: 1047–1058 [DOI] [PubMed] [Google Scholar]
- Vinson C, Myakishev M, Acharya A, Mir AA, Moll JR, Bonovich M 2002. Classification of human B-ZIP proteins based on dimerization properties. Mol Cell Biol 22: 6321–6335 [DOI] [PMC free article] [PubMed] [Google Scholar]
- Warren CL, Zhao J, Glass K, Rishi V, Ansari AZ, Vinson C 2012. Fabrication of duplex DNA microarrays incorporating methyl-5-cytosine. Lab Chip 12: 376–380 [DOI] [PMC free article] [PubMed] [Google Scholar]
- Weber M, Hellmann I, Stadler MB, Ramos L, Paabo S, Rebhan M, Schubeler D 2007. Distribution, silencing potential and evolutionary impact of promoter DNA methylation in the human genome. Nat Genet 39: 457–466 [DOI] [PubMed] [Google Scholar]
- Yukawa K, Tanaka T, Tsuji S, Akira S 1999. Regulation of transcription factor C/ATF by the cAMP signal activation in hippocampal neurons, and molecular interaction of C/ATF with signal integrator CBP/p300. Brain Res Mol Brain Res 69: 124–134 [DOI] [PubMed] [Google Scholar]
- Zhang Y, Liu T, Meyer CA, Eeckhoute J, Johnson DS, Bernstein BE, Nusbaum C, Myers RM, Brown M, Li W, et al. 2008. Model-based analysis of ChIP-Seq (MACS). Genome Biol 9: R137. [DOI] [PMC free article] [PubMed] [Google Scholar]