

Abstract
Objectives
Primary Sjögren's syndrome (pSS) shares clinical features and pathogenetic mechanisms with systemic lupus erythematosus (SLE). SLE is associated with an increased thromboembolic risk; however, it is unclear whether pSS patients are susceptible to thromboembolic diseases. In this study, we examined ex vivo blood clot formation (clot strength, rates of clot formation and lysis) in pSS using thromboelastography (TEG) and platelet aggregation to common agonists using multiple electrode aggregometry (MEA). We also investigated the relationship between TEG/MEA parameters and clinical/laboratory features of pSS.
Design
Case control.
Setting
Secondary care, single centre.
Participants
34 pSS patients, 11 SLE patients and 13 healthy volunteers (all women) entered and completed the study.
Primary and secondary outcome measures
Primary outcomes: TEG and MEA parameters between three subject groups. Secondary outcomes: The relationships between TEG/MEA and clinical/laboratory parameters analysed using bivariate correlation analysis with corrections for multiple testing.
Results
All TEG and MEA parameters were similar for the three subject groups. After corrections for multiple testing, interleukin (IL)-1α and Macrophage inflammatory proteins (MIP)-1α remain correlated inversely with clot strength (r=−0.686, p=0.024 and r=−0.730, p=0.012, respectively) and overall coagulability (r=−0.640, p=0.048 and r=−0.648, p=0.048). Stepwise regression analysis revealed that several cytokines such as MIP-1α, IL-17a, IL-1α and Interferon (IFN)-γ may be key predictors of clot strength and overall coagulability in pSS.
Conclusions
Clot kinetics and platelet receptor function are normal in pSS. Several cytokines correlate with clot strength and overall coagulability in pSS.
Keywords: Rheumatology
Article summary.
Article focus
To examine ex vivo blood clot formation and platelet aggregation in patients with primary Sjögren's syndrome (pSS).
To investigate the relationship between clinical and laboratory features of pSS and ex vivo coagulation and platelet aggregation.
Key messages
The kinetics of blood clot formation and platelet aggregation in pSS is normal.
Several cytokines such as MIP-1α, IL-17a, IL-1α and IFN-γ may correlate with clot strength and overall coagulability in pSS.
Strengths and limitations of this study
This is the first study to examine ex vivo clot kinetics and platelet aggregation in whole blood of patients with pSS.
The correlation between serum MIP-1α and IL-1α and clot strength/overall coagulability is a novel observation.
The sample size was relatively small.
Introduction
Primary Sjögren's syndrome (pSS) and systemic lupus erythematosus (SLE) share many clinical and pathobiological features.1 In SLE, many clinical and scientific studies have confirmed an increased risk of thrombosis,2 3 accelerated atherosclerosis and higher cardiovascular morbidity and mortality.4 To date, data on thrombosis and thromboembolic risk in pSS are limited.
Theander et al5 found no increase in ischaemic cardiovascular mortality in pSS patients compared with the general population. The incidence of thromboembolic events (TEEs) in pSS patients (1.44/100 patient-years) was less than that for SLE patients (2.9/100 patient-years).2 6 The incidence of venous thromboembolism was higher in pSS patients compared with the normal population (0.48 events/100 patient-years6 vs 0.07–0.1 events/100 patient-years7–9), but the incidence of arterial TEE was similar (0.96/100 vs 0.94/100 years10). The risk of pulmonary embolism during the first year after admission was high with pSS patients having a standardised incidence ratio of 7.4.3
Several clinical and laboratory observations support an increased thrombotic potential in pSS. First, pSS patients may have abnormal lipid profiles,11 accelerated atherosclerosis12 and increased prevalence of diabetes13 and hypertension (unpublished observations), all of which are risk factors for thromboembolic diseases. In addition, it has been reported that the prevalence of antiphospholipid antibodies is increased among pSS patients,14–18 which in turn may increase the thromboembolic risk. Second, there is an increase in microparticles, small membrane-bound vesicles secreted from activated/apoptotic cells, in pSS patients compared with controls and SLE patients.19 These microparticles are implicated in the initiation/propagation of thrombus and are associated with excessive thrombotic risk in rheumatoid arthritis and SLE.19 20 Third, other factors associated with pSS, such as elevated levels of inflammatory cytokines and immunoglobulins and reduced complement levels, have also been linked to thrombosis.21–23
Haemostasis is a complex process which involves interactions between platelets, coagulation factors and the blood vessel wall. Clot formation and resolution is therefore dependent on platelet function, ‘coagulability’ of the blood and vascular endothelium. Various tests can be used to assess coagulation ex vivo. Thromboelastography (TEG) enables a functional evaluation of the coagulation cascade in whole blood, from clot formation to clot lysis,24 25 whereas multiple electrode aggregometry (MEA) allows rapid assessment of the function of specific platelet receptors in whole blood.26 The use of whole blood has an advantage that it mimics more closely the in vivo conditions.
In this study, we used TEG and MEA to investigate whether ex vivo clotting is altered in pSS patients compared with healthy individuals. SLE patients were used as a disease comparator group. Additionally, we explored the relationships between clotting parameters and the clinical and laboratory data of pSS.
Methods
Participants
All patients were recruited from the Freeman Hospital, Newcastle-upon-Tyne, UK, or Newcastle University (see online supplementary document 1), following informed consent according to the principles of the Helsinki Declaration. Sunderland research ethics committee has approved the study. The inclusion/exclusion criteria are listed in online supplementary table S1. We initially studied 18 healthy controls, and found significant differences in many TEG parameters between male and female volunteers (see online supplementary table S2). Since the majority of pSS/SLE patients are women, in order to avoid the confounding effect of gender difference on clot kinetics, we have analysed the data from female participants only.
TEG and MEA
Blood samples were collected using 18G needles and vacutainer tubes containing citrate (for TEG) or hirudin (for MEA). Clinical and laboratory data were collected from medical records and from the UK Primary Sjögren's Registry (UKPSSR).27 All samples were analysed within 45 min to 3 h after collection as per manufacturers’ guidance.
Thromboelastography
A TEG 5000 Haemostasis Analyser (Haemoscope Inc, USA) was used and data were analysed using the TEG Analytical Software, V.4.1.54. Briefly, 1 ml of blood sample was transferred to a vial containing kaolin to activate the clotting cascade. In total, 340 µl was then transferred to a TEG vial with 20 µl CaCl2 which chelates citrate and promotes thrombogenesis. A TEG trace (see online supplementary figure S1) was produced over 90 min. The following parameters corresponding to various components of the clotting process were recorded: R time, K time, α angle, maximum amplitude (MA), LY30, LY60 and clotting index (CI).
Multiple electrode aggregometry
A multiplate analyser (Dynabyte, Munich, Germany) with integrated software was used. Briefly, blood samples were diluted with 0.9% saline solution (1:1), after 3 min of incubation (37°C), the corresponding agonists (20 µl) for four different platelet receptor pathways (cyclooxygenase: archidonic acid; P2Y12: ADP; thrombin: thrombin receptor-activating peptide; glycoprotein Ib: collagen) were added. Platelet aggregation enhances the electrical resistance on the duplicate sensors, which was transformed to arbitrary aggregation units for each agonist.
Serum soluble molecules measurement
Serum levels of various soluble molecules (see online supplementary table S3) from pSS patients (n=18) were measured using Cytometric Bead Array (Becton Dickinson, Oxford, UK) according to manufacturer's protocol. Briefly, capture beads for the corresponding analytes were added to diluted serum samples. After 1 h of incubation (room temperature), PE detection reagents were added and incubated for 2 h, the samples were then washed, resuspended and analysed with a flow cytometer (BD LSR-II) and the FCAP Array software.
Statistical analysis
Minitab (V.16) and SPSS (V.19.0) were used for statistical analysis. One-way analysis of variance and Kruskal-Wallis tests were used for group comparisons of parametric and non-parametric data. Pearson's correlation was used to analyse the relationships between the TEG/MEA data and clinical/laboratory data. p Values were corrected for multiple testing using Benjamini-Hochberg procedure. Stepwise regression analyses were performed using MA or CI as dependent variable. Factor analysis was used to identify independent factors among the cytokine data for stepwise regression analysis to avoid the problem of multicollinearity.
Results
Cohort characteristics
Table 1 summarises the baseline characteristics for the three subject groups. There were significant differences between groups for age. Compared with pSS patients, the average disease duration was longer for SLE patients (4.6 vs 13 years, p=0.016), and a higher proportion was taking steroids.
Table 1.
Demographics and clinical characteristics of the subject groups
| pSS | SLE | Healthy controls | p Values | |
|---|---|---|---|---|
| Sample size | 34 | 11 | 13 | |
| Age (years, mean (range)) | 58 (30–83) | 45 (20–78) | 35 (22–54) | <0.001 |
| Disease duration (years, mean (range)) | 4.6 (1–15) | 13 (4–28) | N/A | 0.016 |
| Anti-Ro/anti-La positive (number (%)) | 26 (76) | 4 (36) | N/A | 0.026 |
| ESSDAI (mean (range)) | 4.2 (0–15) | N/A | N/A | – |
| ESSPRI (mean (range)) | 5 (1.7–9.7) | N/A | N/A | – |
| Hydroxychloroquine use (number (%)) | 16 (47) | 6 (54) | 0 | 0.666 |
| Steroid use (number (%)) | 3 (9) | 5 (45) | 0 | 0.006 |
| Antihypertensive use (number (%)) | 8 (24) | 2 (18) | 0 | 0.711 |
| Platelet count (mean±SD (range), ×109/l) | 266±44 (205–436) | 236±65 (136–383) | N/A | 0.053 |
| Positive cardiovascular history* (number (%)) | 1 (3) | 0 (0) | N/A | 1.000 |
| Positive thromboembolioc/pregnancy loss (>1) history* (number (%)) | 1 (3) | 0 (0) | N/A | 1.000 |
*Based on medical records, ESSDAI, EULAR Sjögren's syndrome disease activity index; ESSPRI, EULAR Sjögren's syndrome patient reported index; pSS, Primary Sjögren's syndrome; SLE, systemic lupus erythematosus.
TEG and MEA
All TEG and MEA parameters were similar between pSS patients, SLE patients and healthy controls (table 2). The proportion of individuals in each subject group with TEG/MEA parameters outside the ‘reference ranges’ was also similar (data not shown). These observations indicate that there are no significant differences in the clot strength, rate of clot formation and lysis and platelet receptor function ex vivo between the three subject groups.
Table 2.
TEG and MEA parameters for pSS patients, SLE patients and healthy controls
| (A) TEG | |||||||
|---|---|---|---|---|---|---|---|
| TEG parameters |
|||||||
| R (mins) | K (mins)* | α Angle (degrees)* | MA (mm) | LY30 (%)* | LY60 (%) | CI | |
| pSS (n=34) | 5.5±1.3 | 1.5±0.5 | 68.1±5.5 | 65.7±3.7 | 0.7±1.7 | 4.2±2.7 | 1.2±1.5 |
| SLE (n=11) | 5.0±0.8 | 1.5±0.5 | 69.0±4.4 | 64.6±4.0 | 1.2±2.2 | 4.9±2.6 | 1.6±1.1 |
| Healthy controls (n=13) | 5.3±1.2 | 1.5±0.4 | 68.8±3.2 | 66.2±5.3 | 0.7±0.8 | 3.6±1.3 | 1.4±1.7 |
| p Value (ANOVA/Kruskal-Wallis) | 0.342 | 0.703 | 0.561 | 0.637 | 0.286 | 0.462 | 0.664 |
| (B) MEA | ||||
|---|---|---|---|---|
| MEA parameters |
||||
| AA (AU) | ADP (AU) | TRAP (AU) | COL (AU) | |
| pSS (n=34) | 89.4±22.3 | 77.6±21.0 | 101.1±22.7 | 75.2±20.5 |
| SLE (n=11) | 93.5±26.5 | 71.1±21.3 | 96.3±33.6 | 77.0±24.5 |
| Healthy controls (n=13) | 85.3±33.4 | 69.4±27.4 | 88.6±35.4 | 72.7±27.5 |
| p Value (Anova/Kruskal-Wallis) | 0.752 | 0.515 | 0.419 | 0.893 |
Normally distributed values are presented as mean±SD. Non-normally distributed values (asterisk) are presented as median±IQR. Aggregate unit (AU) values (mean±SD) shown for the platelet receptor agonists AA, ADP, COL and TRAP.
AA, archidonic acid; ANOVA, analysis of variance; CI, clotting index; COL, collagen; MEA, multiple electrode aggregometry; pSS, Primary Sjögren's syndrome; SLE, systemic lupus erythematosus; TEG, thromboelastography; TRAP, thrombin receptor-activating peptide.
Relationships between clinical/laboratory data of pSS and TEG/MEA parameters
Several serum cytokines/chemokines (interleukin (IL)-1α, IL-17a, IL-21, tumour necrosis factor-α, MIP-1α) and clinical laboratory measurements (erythrocyte sedimentation rate, C reactive protein, immunoglobulin M, platelet count) correlated with some TEG/MEA parameters (see online supplementary table S3). Upon corrections for multiple testing, however, only MIP-1α and IL-1α remained negatively correlated with clot strength (r=−0.730 and −0.686; corrected p=0.012 and 0.024, respectively) and overall coagulability (CI; r=−0.640 and −0.648; both corrected p=0.048; figure 1). Stepwise regression revealed MIP-1α and IL-1α as independent predictors for clot strength (p=0.001, adjusted r2=0.498) and overall coagulability (p=0.005, r2=0.381), respectively.
Figure 1.
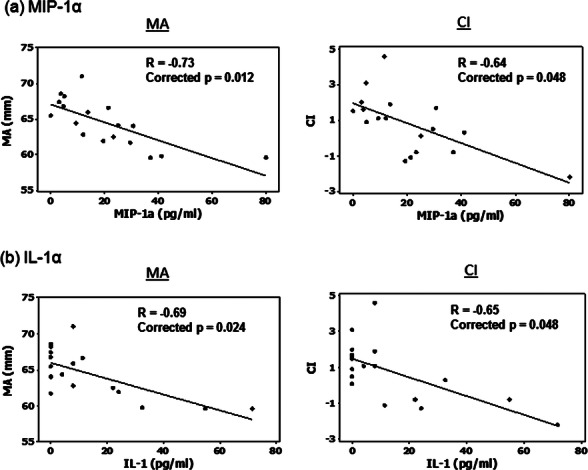
Correlation between clinical and laboratory parameters of primary Sjögren's syndrome and thromboelastography (TEG) values. (A) MIP-1α and (B) interleukin (IL)-1α. Only variables that have statistical significant correlations with TEG measurements after corrections for multiple testing are shown. The lower limits of detection for MIP-1α and IL-1α were 0.2 and 1 pg/ml, respectively.
As anticipated, there were significant correlations (table 3) between many cytokines given the known physiological links between some of these cytokines. However, some of these correlations were particularly strong (eg, between IL-1α, MIP-1α, IL-17a and IL-21 (R>0.8)), suggesting potential multicollinearity which may in turn be susceptible to over-fitting of the regression model. In order to mitigate the problem with multicollinearity, we first performed a factor analysis to identify independent factors within the cytokine data (see online supplementary table S4), and used these factors as independent variables in stepwise regression. For clot strength (MA), we identified factor 1 (which was predominantly represented by IL-1α, MIP-1α and IL-17a) being the key predictor (r=0.69, p=0.002; table 4A). For CI, the key independent predictors were factors 1 and 7 (r=0.807, p=0.021; table 4B). The latter was predominantly represented by IFN-γ. Taken together, our data suggest that several cytokines such as MIP-1α, IL-17a, IL-1α and IFN-γ may correlate with clot strength and overall coagulability.
Table 3.
Bivariate correlations between serum cytokines and soluble molecules
| Correlations (Pearson's r value) |
||||||||||||
|---|---|---|---|---|---|---|---|---|---|---|---|---|
| IL-1α | MIP-1α | IL-8 | IFN-γ | IL-6 | IL-1β | IL-12p70 | IL-10 | CD40L | IL-17a | TNF-α | IL-21 | |
| IL-1α | 1 | 0.832* | −0.266 | 0.339 | −0.222 | −0.13 | 0.392 | 0.119 | −0.366 | 0.823* | 0.668* | 0.837* |
| MIP-1α | 0.832* | 1 | 0.195 | 0.109 | 0.171 | −0.109 | 0.18 | 0.095 | −0.018 | 0.761* | 0.608* | 0.696* |
| IL-8 | −0.266 | 0.195 | 1 | −0.466 | 0.789* | −0.071 | −0.191 | 0.122 | 0.666* | −0.225 | −0.094 | −0.217 |
| IFN-γ | 0.339 | 0.109 | −0.466 | 1 | −0.328 | 0.252 | 0.334 | 0.085 | −0.538† | 0.224 | 0.122 | 0.264 |
| IL-6 | −0.222 | 0.171 | 0.789* | −0.328 | 1 | 0.09 | −0.177 | 0.04 | 0.365 | −0.168 | −0.115 | −0.219 |
| IL-1β | −0.13 | −0.109 | −0.071 | 0.252 | 0.09 | 1 | −0.026 | 0.026 | −0.134 | 0.21 | −0.06 | −0.191 |
| IL-12p70 | 0.392 | 0.18 | −0.191 | 0.334 | −0.177 | −0.026 | 1 | 0.571† | −0.231 | 0.234 | 0.369 | 0.547† |
| IL-10 | 0.119 | 0.095 | 0.122 | 0.085 | 0.04 | 0.026 | 0.571† | 1 | 0.184 | 0.149 | 0.455 | 0.246 |
| CD40L | −0.366 | −0.018 | 0.666* | −0.538† | 0.365 | −0.134 | −0.231 | 0.184 | 1 | −0.153 | 0 | −0.303 |
| IL-17a | 0.823* | 0.761* | −0.225 | 0.224 | −0.168 | 0.21 | 0.234 | 0.149 | −0.153 | 1 | 0.760* | 0.563† |
| TNF-α | 0.668* | 0.608* | −0.094 | 0.122 | −0.115 | −0.06 | 0.369 | 0.455 | 0 | 0.760* | 1 | 0.437 |
| IL-21 | 0.837* | 0.696* | −0.217 | 0.264 | −0.219 | −0.191 | 0.547† | 0.246 | −0.303 | 0.563† | 0.437 | 1 |
*Correlation is significant at the 0.01 level (two-tailed).
†Correlation is significant at the 0.05 level (two-tailed).
IL, interleukin; TNF, tumour necrosis factor.
Table 4.
Identify independent predictors of clot strength and clotting index using factor analysis approach
| Unstandardised coefficients | Standardised coefficients | Collinearity statistics |
||||||
|---|---|---|---|---|---|---|---|---|
| Model | B | SE | β | t | Significance | Tolerance | VIF | |
| (A) Independent predictor of clot strength | ||||||||
| (Constant) | 64.382 | 0.615 | 104.746 | 0 | ||||
| REGR factor score 1 for analysis 1 | −2.336 | 0.634 | −0.69 | −3.687 | 0.002 | 1 | 1 | |
| r=0.690, r2=0.475, adjusted r2=0.44 | ||||||||
| (B) Independent predictor of clotting index | ||||||||
| (Constant) | 0.724 | 0.26 | 2.779 | 0.015 | ||||
| REGR factor score 1 for analysis 1 | −1.18 | 0.268 | −0.694 | −4.395 | 0.001 | 1 | 1 | |
| REGR factor score 7 for analysis 1 | 0.697 | 0.268 | 0.41 | 2.596 | 0.021 | 1 | 1 | |
| r=0.807, r2=0.651, adjusted r2=0.601 | ||||||||
Discussion
In this study, we found no significant differences in ex vivo clot kinetics and platelet aggregation upon stimulation by various agonists in whole blood between patients with pSS, SLE and healthy volunteers. However, several inflammatory parameters were associated with ex vivo clotting parameters. Our findings in this population are novel and to our knowledge not yet reported.
In 1986, Oxholm et al28 reported that platelet aggregation (using Dual Channel Payton Aggregometer) in platelet-rich plasma of pSS patients was increased compared with healthy controls. However, there are important differences between the study by Oxholm et al and our study. First, the classification criteria used for pSS patients were different. Before the AECG consensus criteria 2002 were developed, studies of pSS used different criteria for the disease, which has been a potential reason for many discrepant data in pSS. AECG criteria are arguably the most widely accepted classification criteria for pSS to date. Second, Oxholm et al studied platelet aggregation in ‘isolation’, whereas in our study, platelet aggregation was measured in ‘whole blood’, which we believe is more physiologically relevant. In addition, the process of platelet enrichment can activate platelet and may introduce variability to the data. In contrast, the MEA method we used in this study involved minimal handling of the samples. Third, the methods used for measuring platelet aggregation and how the results are presented differ between the two studies.
The three subject groups differed in age, but we found no correlation between age and TEG/MEA parameters in healthy controls (see online supplementary table S2). Since patients taking antiplatelet agents or anticoagulants were excluded, clotting/platelet receptor abnormalities in pSS could have been underestimated. However, of the 639 pSS patients from the UKPSSR, only 10% and 3% were taking aspirin/clopidigrel and warfarin, respectively (unpublished data). The pSS group in this study has relatively short disease duration, but we found no correlation between disease duration and any TEG/MEA parameters. The sample size of this study was relatively small, but the mean/median values of all the test parameters were remarkably similar between the subject groups and the SDs for many TEG parameters were small.
Since there were no significant difference in clotting between SLE patients and healthy controls, our data suggest that alternative mechanisms such as in vivo factors (eg, endothelial dysfunction), traditional cardiovascular risk factors or other yet undefined mechanisms may be responsible for the increased thromboembolic risk in SLE.
Platelet number and function are important determinants of TEG/MEA parameters. In this study, the platelet counts in the pSS group were within normal range and there was no significant difference in platelet counts between the pSS and SLE groups. Although there were marginally significant inverse correlations between platelet counts and Ly30 (r=−0.359, p=0.040 (uncorrected)) as well as Ly60 (r=−0.355, p=0.042 (uncorrected)) on bivariate correlation analysis, such correlations were no longer statistically significant on corrections for multiple comparison (see online supplementary table S3).
Hydroxychloroquine is associated with reduced cardiovascular events and anti-phospholipid antibody-mediated platelet activation in SLE.29 Since approximately half of the pSS and SLE group was taking hydroxychloroquine, this may mask the clotting abnormalities among the patient groups. However, there were no significant difference in any of the TEG and MEA parameters between patients who were receiving hydroxychloroquine treatment and those who were not in this study (see online supplementary table S5). We could not exclude, however, that patients receiving hydroxychloroquine therapy might have abnormal clot kinetics or platelet aggregation prior to treatment.
The presence of antiphospholipid antibodies have been reported in pSS patients and may contribute to increased thromboembolic risk.14–18 In our study, antiphospholipid antibodies were not systematically tested in the patients although at least three pSS patients were positive for antiphospholipid antibodies. Future studies investigating whether the presence of antiphospholipid antibodies affect TEG/MEA parameters is worthwhile.
A novel observation in this study is the negative correlation between the serum levels of several proinflammatory molecules such as MIP-1α/IL-1α and clot strength/overall coagulability. Consistent with our findings, Ng et al30 reported serum IL-6 levels to be inversely correlated with clot strength and CI in posthepatobiliary surgery patients. These observations initially appeared contradictory to the link between inflammation and increased TEEs.31 However, many of the potential mechanisms by which inflammatory molecules promote thrombogenesis relate to in vivo phenomena such as endothelial cell dysfunction and tissue factor-mediated activation of coagulation.22 32 Another possibility for the inverse correlation between inflammation and TEG parameters could be prior platelet activation because previously activated platelets might be less ready to participate in coagulation and platelet aggregation compared with non-activated platelets. It is therefore of interest that platelet activation has been linked with an upregulation of the type I interferon signature in SLE,33 as a similar gene signature has also been described in the peripheral blood samples of pSS patients.34 35 However, in this study, soluble CD40L, a potential marker of platelet activation did not correlate with the TEG/MEA parameters. More detailed studies of the relationships between prior platelet activation and clot kinetics and platelet aggregation would be of interest. In TEG, clot strength is determined by platelet number and function, as well as cross-linking of fibrin to form a stable clot. In this study, neither MIP-1α nor IL-1α correlated with platelet counts (r=−0.146, p=0.575 and r=−0.130, p=0.619, respectively). Fibrinogen levels were not measured and therefore a role for MIP-1α or IL-1α in fibrin cross-linking cannot be excluded. Low levels of CCR1, receptor for MIP-1α, are expressed on platelets, but its function is unclear.36 An intriguing possibility is that MIP-1α may provide a negative feedback mechanism on platelet function. Further research into the mechanistic link between these cytokine/chemokine and hypocoagulability is warranted.
Supplementary Material
Acknowledgments
The authors would like to thank all the patients and healthy volunteers who have participated in this study.
Footnotes
Contributors: WFN, GV and AZ conceptualised the study. AZ, WFN and KSC designed the study. KSC and WFN wrote the manuscript. KSC, KB, AN and SM collected the data. KSC, WFN, AN, JT, DL and AZ performed the data analysis and interpretation. All authors have involved in the writing of the manuscript. They read and approved the final manuscript.
Funding: Graham and Jenny Watson Bursary provided stipends for lead author KSC. The UKPSSR (which provided some of the clinical data for this study) was funded by the Medical Research Council, UK (Grant number: G0800629)).
Competing interests: None.
Patient consent: Obtained.
Ethics approval: Sunderland Research Ethics Committee, UK.
Provenance and peer review: Not commissioned; externally peer reviewed.
Data sharing statement: The majority of the data analysis has been provided in the main documents or as supplementary files. Request for access to raw data can be made by contacting authors KSC or WFN.
References
- 1.Perl A. Emerging new pathways of pathogenesis and targets for treatment in systemic lupus erythematosus and Sjogren's syndrome. Curr Opin Rheumatol 2009;21:443–7 [DOI] [PMC free article] [PubMed] [Google Scholar]
- 2.Mok CC, Tang SS, To CH, et al. Incidence and risk factors of thromboembolism in systemic lupus erythematosus: a comparison of three ethnic groups. Arthritis Rheum 2005;52:2774–82 [DOI] [PubMed] [Google Scholar]
- 3.Zoller B, Li X, Sundquist J, et al. Risk of pulmonary embolism in patients with autoimmune disorders: a nationwide follow-up study from Sweden. Lancet 2012;379:244–9 [DOI] [PubMed] [Google Scholar]
- 4.Sherer Y, Shoenfeld Y. Mechanisms of disease: atherosclerosis in autoimmune diseases. Nat Clin Pract 2006;2:99–106 [DOI] [PubMed] [Google Scholar]
- 5.Theander E, Manthorpe R, Jacobsson LT. Mortality and causes of death in primary Sjogren's syndrome: a prospective cohort study. Arthritis Rheum 2004;50:1262–9 [DOI] [PubMed] [Google Scholar]
- 6.Haga HJ, Jacobsen EM, Peen E. Incidence of thromboembolic events in patients with primary Sjogren's syndrome. Scand J Rheumatol 2008;37:127–9 [DOI] [PubMed] [Google Scholar]
- 7.White RH. The epidemiology of venous thromboembolism. Circulation 2003;107(23 Suppl 1):I4–8 [DOI] [PubMed] [Google Scholar]
- 8.Silverstein MD, Heit JA, Mohr DN, et al. Trends in the incidence of deep vein thrombosis and pulmonary embolism: a 25-year population-based study. Arch Intern Med 1998;158:585–93 [DOI] [PubMed] [Google Scholar]
- 9.Petrauskiene V, Falk M, Waernbaum I, et al. The risk of venous thromboembolism is markedly elevated in patients with diabetes. Diabetologia 2005;48:1017–21 [DOI] [PubMed] [Google Scholar]
- 10.Rothwell PM, Coull AJ, Silver LE, et al. Population-based study of event-rate, incidence, case fatality, and mortality for all acute vascular events in all arterial territories (Oxford Vascular Study). Lancet 2005;366:1773–83 [DOI] [PubMed] [Google Scholar]
- 11.Lodde BM, Sankar V, Kok MR, et al. Serum lipid levels in Sjogren's syndrome. Rheumatology (Oxford, England) 2006;45:481–4 [DOI] [PubMed] [Google Scholar]
- 12.Bartoloni E, Shoenfeld Y, Gerli R. Inflammatory and autoimmune mechanisms in the induction of atherosclerotic damage in systemic rheumatic diseases: two faces of the same coin. Arthritis Care Res (Hoboken) 2011;63:178–83 [DOI] [PubMed] [Google Scholar]
- 13.Perez-De-Lis M, Akasbi M, Siso A, et al. Cardiovascular risk factors in primary Sjogren's syndrome: a case-control study in 624 patients. Lupus 2010;19:941–8 [DOI] [PubMed] [Google Scholar]
- 14.Fauchais AL, Lambert M, Launay D, et al. Antiphospholipid antibodies in primary Sjogren's syndrome: prevalence and clinical significance in a series of 74 patients. Lupus 2004;13:245–8 [DOI] [PubMed] [Google Scholar]
- 15.Pasoto SG, Chakkour HP, Natalino RR, et al. Lupus anticoagulant: a marker for stroke and venous thrombosis in primary Sjogren's syndrome. Clin Rheumatol 2012;31:1331–8 [DOI] [PubMed] [Google Scholar]
- 16.Asherson RA, Fei HM, Staub HL, et al. Antiphospholipid antibodies and HLA associations in primary Sjogren's syndrome. Ann Rheum Dis 1992;51:495–8 [DOI] [PMC free article] [PubMed] [Google Scholar]
- 17.Jedryka-Goral A, Jagiello P, D'Cruz DP, et al. Isotype profile and clinical relevance of anticardiolipin antibodies in Sjogren's syndrome. Ann Rheum Dis 1992;51:889–91 [DOI] [PMC free article] [PubMed] [Google Scholar]
- 18.Cervera R, Garcia-Carrasco M, Font J, et al. Antiphospholipid antibodies in primary Sjogren's syndrome: prevalence and clinical significance in a series of 80 patients. Clin Exp Rheumatol 1997;15:361–5 [PubMed] [Google Scholar]
- 19.Sellam J, Proulle V, Jungel A, et al. Increased levels of circulating microparticles in primary Sjogren's syndrome, systemic lupus erythematosus and rheumatoid arthritis and relation with disease activity. Arthritis Res Ther 2009;11:R156. [DOI] [PMC free article] [PubMed] [Google Scholar]
- 20.Ardoin SP, Shanahan JC, Pisetsky DS. The role of microparticles in inflammation and thrombosis. Scand J Immunol 2007;66:159–65 [DOI] [PubMed] [Google Scholar]
- 21.Oikonomopoulou K, Ricklin D, Ward PA, et al. Interactions between coagulation and complement—their role in inflammation. Semin Immunopathol 2012;34:151–65 [DOI] [PMC free article] [PubMed] [Google Scholar]
- 22.Grignani G, Maiolo A. Cytokines and hemostasis. Haematologica 2000;85:967–72 [PubMed] [Google Scholar]
- 23.Mehta J, Singhal S. Hyperviscosity syndrome in plasma cell dyscrasias. Semin Thromb Hemost 2003;29:467–71 [DOI] [PubMed] [Google Scholar]
- 24.Wegner J, Popovsky MA. Clinical utility of thromboelastography: one size does not fit all. Semin Thromb Hemost 2010;36:699–706 [DOI] [PubMed] [Google Scholar]
- 25.Scarpelini S, Rhind SG, Nascimento B, et al. Normal range values for thromboelastography in healthy adult volunteers. Braz J Med Biol Res 2009;42:1210–17 [DOI] [PubMed] [Google Scholar]
- 26.Lee KR, Verheyden VJ, Mumford AD. Evaluation of multiple electrode aggregometry in whole blood using multiplate mini test cells. Thromb Res 2012;129:e59–64 [DOI] [PubMed] [Google Scholar]
- 27.Ng WF, Bowman SJ, Griffiths B. United Kingdom Primary Sjogren's Syndrome Registry—a united effort to tackle an orphan rheumatic disease. Rheumatology (Oxford, England) 2011;50:32–9 [DOI] [PubMed] [Google Scholar]
- 28.Oxholm P, Winther K, Manthorpe R. Platelet function in patients with primary Sjögren's syndrome. Acta Med Scand 1986;219:85–90 [DOI] [PubMed] [Google Scholar]
- 29.Espinola RG, Pierangeli SS, Gharavi AE, et al. Hydroxychloroquine reverses platelet activation induced by human IgG antiphospholipid antibodies. Thromb Haemost 2002;87:518–22 [PubMed] [Google Scholar]
- 30.Ng KF, Ip MS, Ho ET, et al. Coagulation and cytokine profile after major hepatobiliary surgery in Chinese patients. Hepatogastroenterology 2000;47:1067–71 [PubMed] [Google Scholar]
- 31.Gurbel PA, Bliden KP, Kreutz RP, et al. The link between heightened thrombogenicity and inflammation: pre-procedure characterization of the patient at high risk for recurrent events after stenting. Platelets 2009;20:97–104 [DOI] [PubMed] [Google Scholar]
- 32.Shebuski RJ, Kilgore KS. Role of inflammatory mediators in thrombogenesis. J Pharmacol Exp Ther 2002;300:729–35 [DOI] [PubMed] [Google Scholar]
- 33.Lood C, Amisten S, Gullstrand B, et al. Platelet transcriptional profile and protein expression in patients with systemic lupus erythematosus: up-regulation of the type I interferon system is strongly associated with vascular disease. Blood 2010;116:1951–7 [DOI] [PubMed] [Google Scholar]
- 34.Emamian ES, Leon JM, Lessard CJ, et al. Peripheral blood gene expression profiling in Sjogren's syndrome. Genes Immun 2009;10:285–96 [DOI] [PMC free article] [PubMed] [Google Scholar]
- 35.Kimoto O, Sawada J, Shimoyama K, et al. Activation of the interferon pathway in peripheral blood of patients with Sjogren's syndrome. J Rheumatol 2011;38:310–16 [DOI] [PubMed] [Google Scholar]
- 36.Clemetson KJ, Clemetson JM, Proudfoot AE, et al. Functional expression of CCR1, CCR3, CCR4, and CXCR4 chemokine receptors on human platelets. Blood 2000;96:4046–54 [PubMed] [Google Scholar]
Associated Data
This section collects any data citations, data availability statements, or supplementary materials included in this article.